The Deceptiveness of the PE ratio
October 26, 2024
|
The Deceptiveness of the PE ratio
October 26, 2024
|The P/E ratio is one of the most commonly used valuation ratios. The ratio is simple in its construct, yet so powerful that it is used by both retail investors as well as professional fund managers. In simple words, it’s an assessment of how much the market community as a whole is willing to pay for every rupee of earnings of the company.
In this article, we try to debunk certain myths about the PE ratio and the mirage-like effects it has on the investors that use it.
The PE ratio in practice
The foundational principles of value investing, as pioneered by Benjamin Graham and David Dodd, teach us to:
- Buy a stock at price lower than its intrinsic value and sell it on reaching its intrinsic value, or higher
- Buy a stock with a “Margin of Safety” (i.e. the gap between the intrinsic value and the market value of a stock).
- Using the PE ratio: investors can buy a stock trading at a PE lower than its own historical averages, or average industry PE, or the PE of the country’s stock market index.
There are investors who live by this approach and have made consistent compounding returns for centuries.
However…
There are those investors who aim for “Sizeable Market Outperformance” – meaning they want to generate a much bigger alpha over the market returns.
The ones with a higher appetite for risk set out on the quest to find the stocks that will be “the best” performers in the whole market. This is the league where one makes the “greatest bang for one’s buck.” (Yes: “Growth Investors”, “Tactical Allocators”, “Active Management”)
Can we look at the PE ratio differently?
In an exploratory analysis, we tried to understand the behaviour of the PE ratios in stocks that made the most returns.
Methodology: We gathered some data on the top-performing stocks in the broader market over the last decade. Then we mapped those returns to the corresponding levels of PE ratios over the same periods.
Sample Dataset: Our sample consisted of the top 50 stocks from the BSE500 (by returns) in each financial year from FY2015 to FY2024, and the P/E ratios of the same stocks at the start and end of that financial year.
For example, the top 50 performers for FY24 are shown below:
| Company | Returns | Pre | Post |
|---|---|---|---|
| Jai Balaji Industries Ltd. | 1932% | 11.46 | 17.22 |
| BASF India Ltd. | 841% | 24.49 | 25.65 |
| Inox Wind Ltd. | 458% | 3.40 | 83.41 |
| HBL Power Systems Ltd. | 377% | 26.75 | 44.85 |
| Anand Rathi Wealth Ltd. | 357% | 19.99 | 68.63 |
| Mangalore Refinery And Petrochemicals Ltd. | 316% | 3.47 | 10.66 |
| Kalyan Jewellers India Ltd. | 306% | 25.06 | 73.80 |
| Jupiter Wagons Ltd. | 305% | 29.54 | 46.43 |
| Ircon International Ltd. | 291% | 6.88 | 22.15 |
| Chennai Petroleum Corporation Ltd. | 281% | 1.00 | 4.92 |
| Rail Vikas Nigam Ltd. | 269% | 10.66 | 33.50 |
| Cochin Shipyard Ltd. | 266% | 20.54 | 29.28 |
| SJVN Ltd. | 265% | 9.61 | 52.34 |
| Zomato Ltd. | 258% | 0.00 | 450.91 |
| Tata Investment Corporation Ltd. | 257% | 35.09 | 82.05 |
| Bharat Heavy Electricals Ltd. | 252% | 37.33 | 305.00 |
| Action Construction Equipment Ltd. | 250% | 28.25 | 51.75 |
| Titagarh Railsystems Ltd. | 250% | 24.08 | 43.21 |
| Himadri Speciality Chemical Ltd. | 245% | 17.50 | 36.17 |
| NBCC (India) Ltd. | 236% | 23.89 | 53.36 |
| Sobha Ltd. | 235% | 39.19 | 278.91 |
| Swan Energy Ltd. | 212% | 0.00 | 69.65 |
| Olectra Greentech Ltd. | 205% | 77.39 | 201.77 |
| Kaynes Technology India Ltd. | 198% | 58.76 | 99.90 |
| Jindal Saw Ltd. | 197% | 7.23 | 8.24 |
| NLC India Ltd. | 195% | 7.67 | 17.12 |
| Prestige Estates Projects Ltd. | 190% | 17.15 | 34.13 |
| Trent Ltd. | 187% | 109.94 | 94.41 |
| Birlasoft Ltd. | 184% | 21.64 | 32.83 |
| Hindustan Copper Ltd. | 183% | 32.22 | 91.10 |
| Mazagon Dock Shipbuilders Ltd. | 181% | 11.96 | 19.38 |
| JBM Auto Ltd. | 180% | 61.28 | 119.31 |
| Apar Industries Ltd. | 179% | 15.02 | 34.01 |
| Adani Power Ltd. | 179% | 6.89 | 9.88 |
| Gujarat Mineral Development Corporation Ltd. | 172% | 3.34 | 17.72 |
| Engineers India Ltd. | 171% | 12.08 | 25.49 |
| EIH Ltd. | 171% | 32.92 | 43.91 |
| Oracle Financial Services Software Ltd. | 169% | 15.61 | 34.23 |
| Torrent Power Ltd. | 166% | 11.56 | 35.52 |
| Angel One Ltd. | 162% | 10.90 | 22.72 |
We have removed banking, NBFCs and Holding Companies from the analysis.
Findings and Inference
The table below presents our key findings:
| Year | Pre | Post | BSE500 Historical PE | If prior to OP, the PE > index? | Post>Pre |
|---|---|---|---|---|---|
| 2015 | 21 | 40 | 20 | Yes | |
| 2016 | 21 | 41 | 22 | No | Yes |
| 2017 | 27 | 37 | 26 | No | Yes |
| 2018 | 66 | 45 | 25 | Yes | No |
| 2019 | 57 | 62 | 27 | Yes | Yes |
| 2020 | 38 | 41 | 18 | Yes | Yes |
| 2021 | 25 | 82 | 38 | No | Yes |
| 2022 | 40 | 79 | 25 | Yes | Yes |
| 2023 | 31 | 34 | 22 | Yes | Yes |
| 2024 | 23 | 71 | 26 | Yes | Yes |
| Average | 35 | 53 | 25 | 67% | 90% |
| Median | 29 | 43 | 25 |
- The average PE of stock, prior to the appreciation was 35x.
- The average PE of stocks, post the appreciation was ~50x.
- In the same period (FY15-24), the average PE of the BSE500 was only 25x.
- Prior to the outperformance, the PE of the stocks was higher than that of the index (BSE500) on 6 out of 9 occasions (67% of the time).
- In 9 out of 10 years, the PE ratios of the top performers ended up being higher by the end of the year.
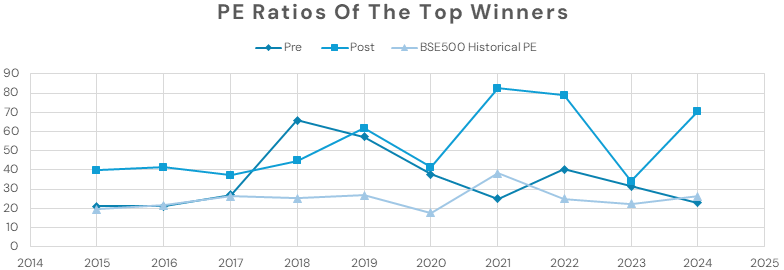
The PE ratios of stocks ended up higher 90% of the time, barring 2018 when the PE ratio declined from 66x to 45x - significantly higher than the BSE500’s PE of ~25x
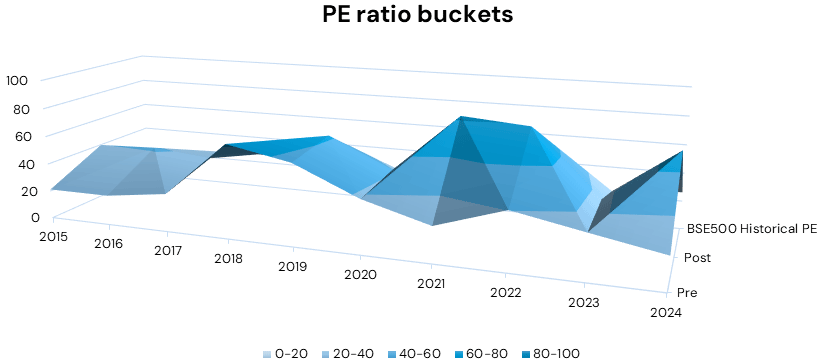
The figure above illustrates two things: (i) the year-on-year movement of PE ratios of the top performers for the last 10 years, (ii) The bucket sizes for several ranges of PE ratios.
Inference
- The top-performing stocks in each year had a common characteristic: they had PE Ratios of 35 and above at the beginning of the year.
- It is possible for stocks to sustain at elevated levels of PEs for several years at a time.
- There is a 2/3rds probability that the next set of top performers in the BSE500 would have PEs greater than 25x at the start of the year.
Limitations
Finally, we would like to highlight some limitations in our analysis mentioned in this article: (1) The analysis covers a period of secular bull market that started after the 2008 Global Financial crisis. It may be possible that in the bear periods, the value approach to PE might work better than buying at a premium to the index. (2) The returns cannot solely be attributed to the PE ratios alone. Several other factors are always influencing the stock prices.
One would ask then: if the stock is overvalued with the index and its peers, shouldn’t we be cautious and consider selling?
Answer: The smartest market investors believe that it is prudent to accept “the market's verdict” rather than what you consider true. Then, the ability to adapt quickly would be the fastest way to success.
The same market verdict is reflected in the PE ratios. An elevated PE reflects a higher demand for the stock vis-à-vis the broader market - which it commands due to:
- Earnings-driven fundamental factors, moats & competitive advantages.
- Sectoral conditions,
- Investors’/Traders’ behavioral biases,
- Overall market sentiment - driven by a slew of other factors.
Drivers of the PE ratio
The fundamental drivers of the PE ratio are:
- Earnings growth rates
- Return on Equity: Including both stock appreciation and dividend payout.
- Riskiness (Cost of Equity)
Strategy: A high earnings growth rate and a high return on equity, along with a low PE ratio present a significant buying opportunity. In this case, we compare these variables for the stock with the industry average or the broader market average.
The Concept of Stock Re-rating
A stock is said to “Re-rate” upwards when the market’s expectations about its earnings over the near to medium term improve significantly.
During a re-rating, the company is now expected to generate higher value/profits. Hence the market participants pile up on its shares, resulting in an increased demand. Every new investor is now willing to pay a little higher than the one before since it is affordable given the upside that is visible. This is how gradually a stock’s P/E multiple increases, due to price appreciation.
Similarly, a stock can de-rate too, i.e., lowering of P/E multiples due to disappointing earnings expectations.
The earnings expectations can change broadly due to these factors:
- Company-specific developments: Covers all aspects of business, ranging from corporate actions to industry participation.
- Industry-Specific Developments: There are times when the whole industry as a whole is experiencing favorable/unfavorable situations, which are driven by factors like the demand-supply environment, capex cycles, technological disruptions, government policies, etc.
- Change in Government policies/regulations.
- Geopolitical developments: these can open up opportunities for specific countries and sectors - The US-China trade war opened up doors for other countries to the global manufacturing pie, which was dominated by China. India is benefiting from the China + 1 opportunities globally.
- Economic, Political, and Social Evolution: Trends and changes in the economic, political, and social landscape of the country can significantly influence the earnings expectations of companies.
PE ratio behavior in high-quality and low-quality stocks
It is commonly known that the PE ratio rises as the price of a stock rises since the numerator of the ratio contains the “price” of the stock. However, the PE ratio does not follow this linear relationship all the time, since the denominator, i.e. the “earnings” plays a critical role in determining the ratio too. Let us see a couple of examples to understand this point better:
Example 1: Trent Ltd (TRENT)
TRENT has grown its earnings per share (EPS) at a CAGR of 32.2% over FY15-24. This is not only an impressive CAGR but has resulted in the creation of immense wealth for the shareholders of the company.
Notice here how the stock has been in a secular uptrend, driven by impressive EPS growth, especially over the last 5 years.
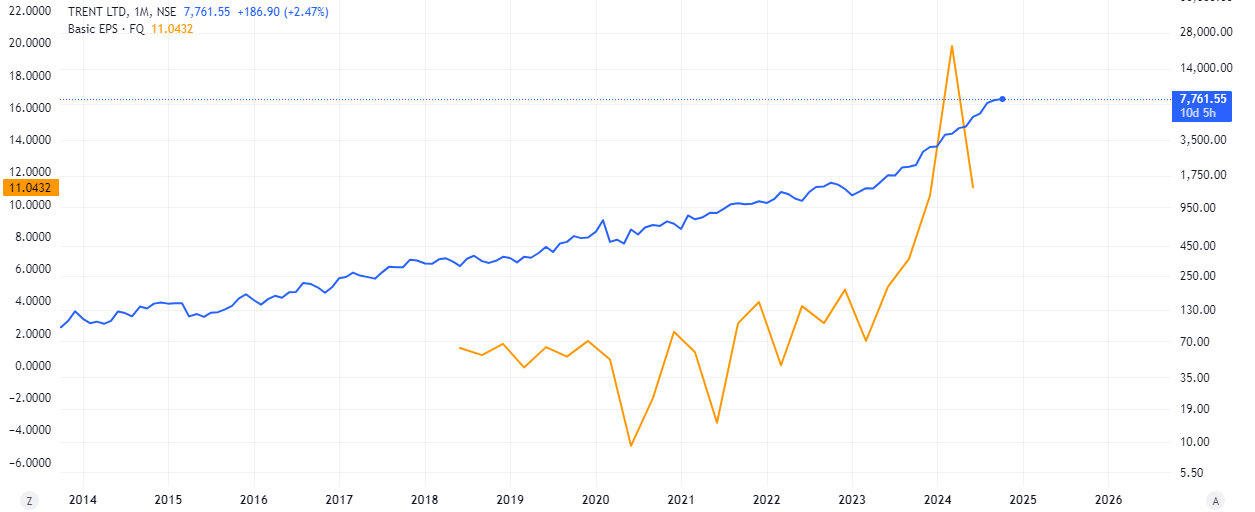
Figure 1: The above chart plots the Earnings Per Share of TRENT and its stock price.
Now notice the movement of the PE ratio in the period between Jan 2022-Present: while the stock has grown exponentially, the PE ratio shrunk from a peak of 600 to 220 currently, which is still significantly high.
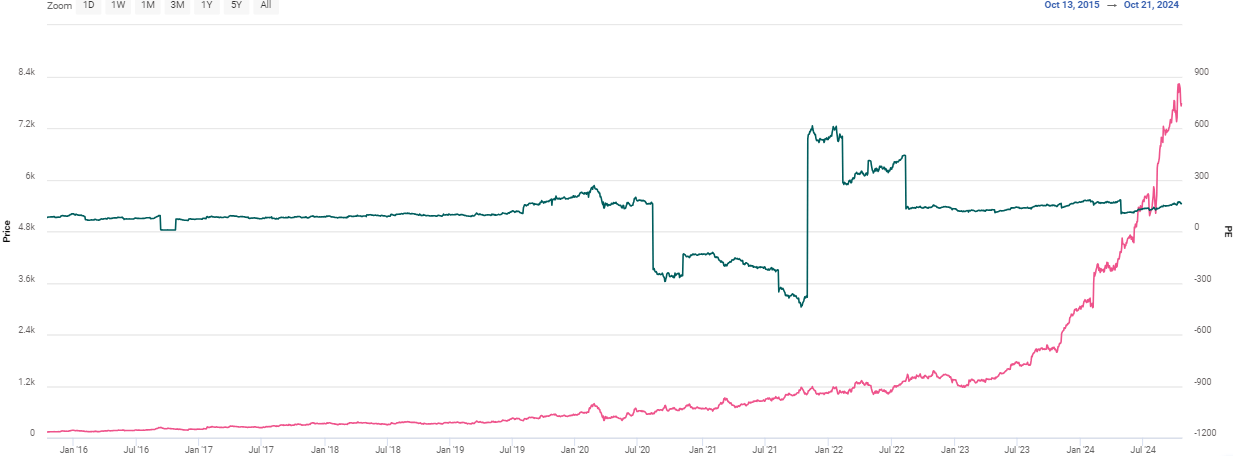
Figure 2: The above chart plots the PE ratio and the Stock price of TRENT over FY16-24
Many investors avoid investing in stocks with triple-digit PEs. But here is the conundrum:
When a stock commands a triple-digit PE, it could be because the business possesses inherent qualities that make it the earnings compounder that it is, and hence the market is willing to pay multiples that are significantly higher than its peers and the broader market.
A word of caution: not all stocks with triple-digit PE ratios possess such inherent qualities. Let us look at an example where this was the case:
Example 2: Zee Entertainment Enterprises Ltd. (ZEEL)
ZEEL has failed to impress the market with its lacklustre earnings track record over the years, as seen in the chart below:
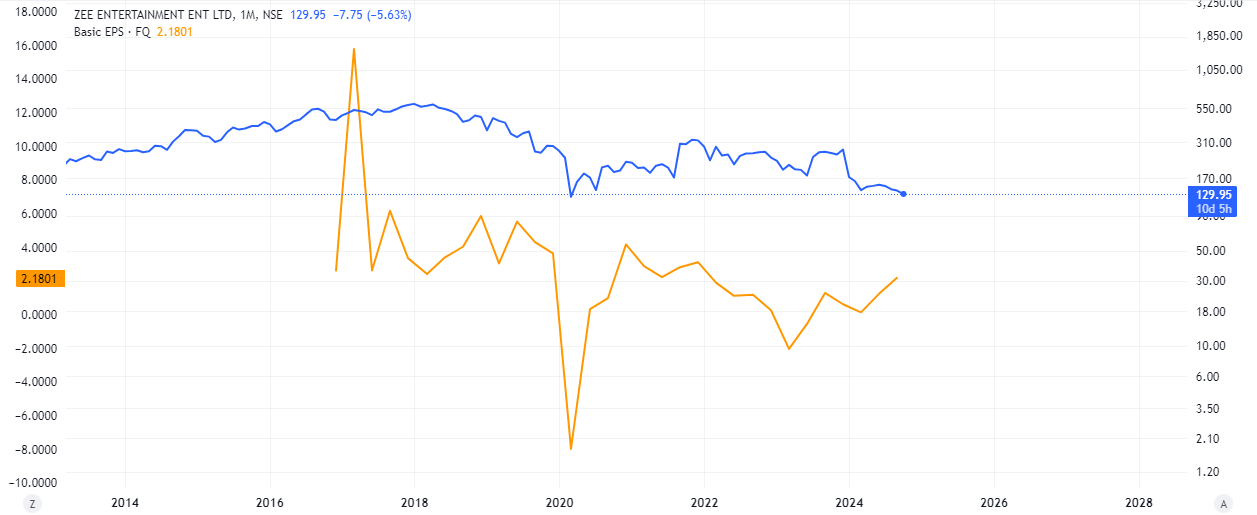
Figure 3: The above chart plots the Earnings Per Share of ZEEL and its stock price.
The weakness in the stock price reflects the weak track record of the company’s financial performance.
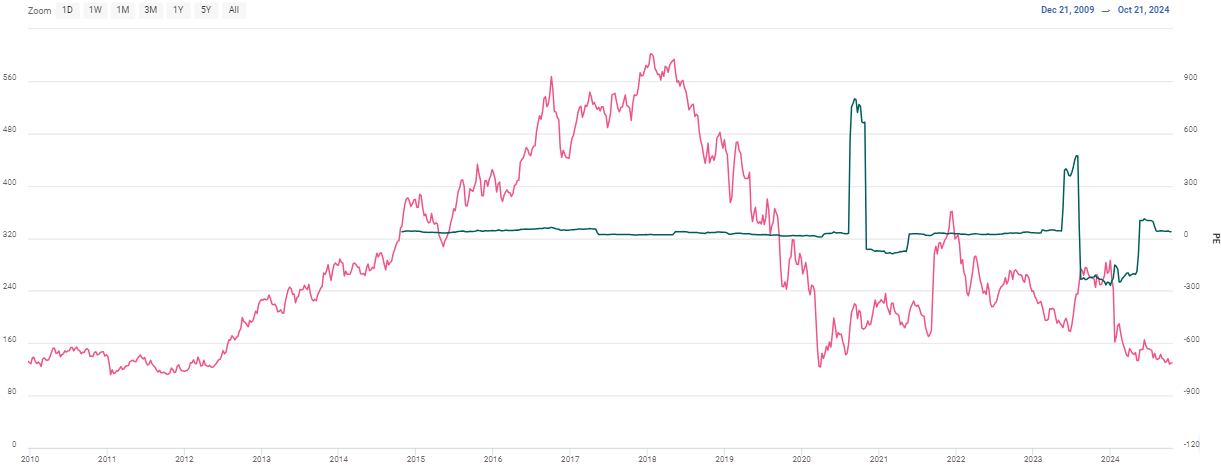
Figure 4: The above chart plots the PE ratio and the Stock price of ZEEL over FY16-24.
Contrary to the PE deflation seen in the TRENT example, the PE deflation in this case is coupled with a declining trend in the stock price. Over the last 5 years, this stock destroyed shareholder wealth, while commanding a peak PE of ~800x in 2021. It is down to a PE of ~30x currently, thus indicating a classic case of overvaluation and a massive PE ratio bubble burst caused by unreasonable valuations.
Market terminology for PE ratios:
“Trailing PE” and “Forward PE” are the two most commonly used terms by equity research analysts, when valuing companies using the PE ratios:
Trailing PE: Trailing PE (Price-to-Earnings) measures a company's current share price relative to its earnings over the past 12 months, reflecting historical performance.
Forward PE: Forward PE uses projected earnings for the next 12 months, providing insight into future growth expectations and market sentiment.
Conclusion
Now that we have had a fair bit of an idea of how the PE ratio works, we must also know that the PE ratio is only one of the many valuation tools available out there. Any investment decision requires diligent research, scrutiny, and dedicated valuation processes. We at Stockaxis follow a holistic approach to research and are always there to offer high-quality analysis at your fingertips.


