November 2024: Sector Updates, The TATA Legacy, & Earnings DeepDive
November 12, 2024
|
Global Market Developments
Trump's reintroduction of the 'Make in America' plan, focused on reshoring manufacturing, could have significant repercussions for Indian exports. If tariffs on Chinese goods increase, Indian products like textiles, machinery, and steel, which are competitive with Chinese imports, may face disruptions. India’s manufacturing processes could be affected, particularly in sectors where it has a strong foothold. Additionally, a weak Chinese economy could lead to increased dumping, further complicating India’s export landscape. Moreover, Trump's proposed tax cuts and tariff barriers risk reigniting inflation in the US, which could strain the Federal Reserve’s ability to keep interest rates low. This could worsen the US fiscal deficit and trigger higher interest rates, negatively impacting emerging economies like India through reduced capital inflows and currency depreciation.
India Market Update
October saw a significant market correction, driven by heavy selling from foreign portfolio investors, weak earnings, and high valuations. The current earnings season has been disappointing, with a noticeable decline in urban consumption and industrial demand, impacted by the heavy monsoons. However, we view these factors as temporary and expect demand to recover in the coming months, especially with the festive season boosting consumption. While export growth has been sluggish, domestic demand remains strong. India's robust foreign exchange reserves and stable fiscal position are key strengths, and the US focus on fossil fuels should help stabilize oil prices. Moreover, India's positioning as an alternative to China will support long-term growth. We believe these strengths will eventually reflect in the market, and this downturn will pass.
In this month’s newsletter, we discuss some topics that intrigue us and are worth a long read. We will be covering the following topics in this month’s newsletter:
- HCL Tech Q2 Earnings beat - A deep dive.
- The TATA Way - Fostering Capitalism with a Heart.
- PSU Banks deliver a surprise.
So, lets dive in.
HCLTech Q2 Earnings beat – A Deep Dive
Introduction
HCLTech is India’s third-largest IT company by market capitalization and revenues, with a presence in over 60 countries. Founded in 1991 by renowned industrialist and philanthropist Mr. Shiv Nadar, the company is a diversified global technology company based out of Noida.

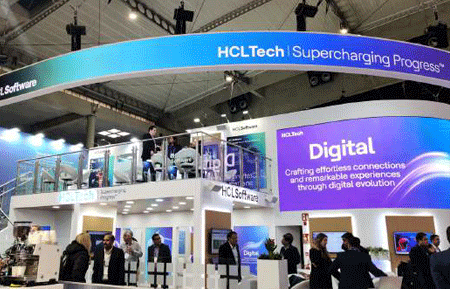
HCL Technologies delivered a beat on its Q2 results this year, surpassing the street estimates. In this article, we take a deep dive and discuss what’s working for the company, why we like it, its future outlook, and more.
Addressable Markets
HCLTech operates in a vast addressable market pool, mainly spread across the following markets:
IT Services (BPO market): This market accounted for 7.5% of India’s GDP in 2023 (amounting to ~$268bn or ~22.68 lakh crore). The IT services - BPO industry has been pivotal in propelling India’s GDP growth over the last few decades, by outperforming the economy consistently over time.
India’s growing reputation as the preferred destination for Global Capability Centres (GCCs) by MNCs has significantly boosted software and business services exports. India's share in digitally delivered services exports globally increased to 6.0 percent in 2023 from 4.4 percent in 2019.
Software: The Indian software services export market is estimated to be valued at ~$151.6bn in 2024. The global SaaS (Software as a Service) market is estimated at $273.5bn in 2023. The SaaS and Cloud services markets are the high-growth areas within the software space.
ER&D market: As discussed in one of our previous articles on ER&D, please click here to read about the size of the Indian ER&D industry.
Comparison with Peer group
We compared HCLTECH with similar-sized IT companies, namely TCS, Infosys, Tech Mahindra, and WIPRO. We have left out LTIMindtree owing to a lack of comparability due to the Mindtree acquisition and integration. The data from the analysis is as follows:
| Particulars (Rs Cr) | HCLTech | TCS | Infosys | Tech Mahindra | WIPRO | |||||
|---|---|---|---|---|---|---|---|---|---|---|
| Revenue | PBT | Revenue | PBT | Revenue | PBT | Revenue | PBT | Revenue | PBT | |
| FY19 | 60,427 | 12,622 | 1,46,463 | 41,563 | 82,675 | 21,041 | 34,742 | 5,543 | 59,019 | 11,542 |
| FY20 | 70,676 | 13,980 | 1,56,949 | 42,248 | 90,791 | 22,007 | 36,868 | 5,058 | 61,138 | 12,252 |
| FY21 | 75,379 | 15,853 | 1,64,177 | 43,760 | 1,00,472 | 26,628 | 37,855 | 5,953 | 61,935 | 13,903 |
| FY22 | 85,651 | 16,951 | 1,91,754 | 51,687 | 1,21,641 | 30,110 | 44,646 | 7,452 | 79,312 | 15,141 |
| FY23 | 1,01,456 | 19,488 | 2,25,458 | 56,907 | 1,46,767 | 33,322 | 53,290 | 6,446 | 90,488 | 14,766 |
| FY24 | 1,09,913 | 20,967 | 2,40,893 | 61,997 | 1,53,670 | 35,988 | 51,996 | 3,224 | 89,760 | 14,721 |
| CAGR | 13% | 11% | 10% | 8% | 13% | 11% | 8% | -10% | 9% | 5% |
Source: Company Filings, stockaxis Research
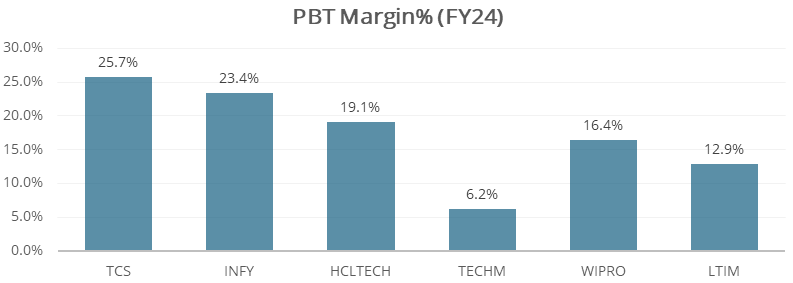
Profit margins of HCLTECH remains above industry average, but there is also a significant gap in the margins of TCS & INFY vs HCLTECH.
Business Segments & Key Updates
HCLTech derives its revenues from 3 primary segments, namely:
- IT & Business Services
- HCL Software
- Engineering & R&D Services
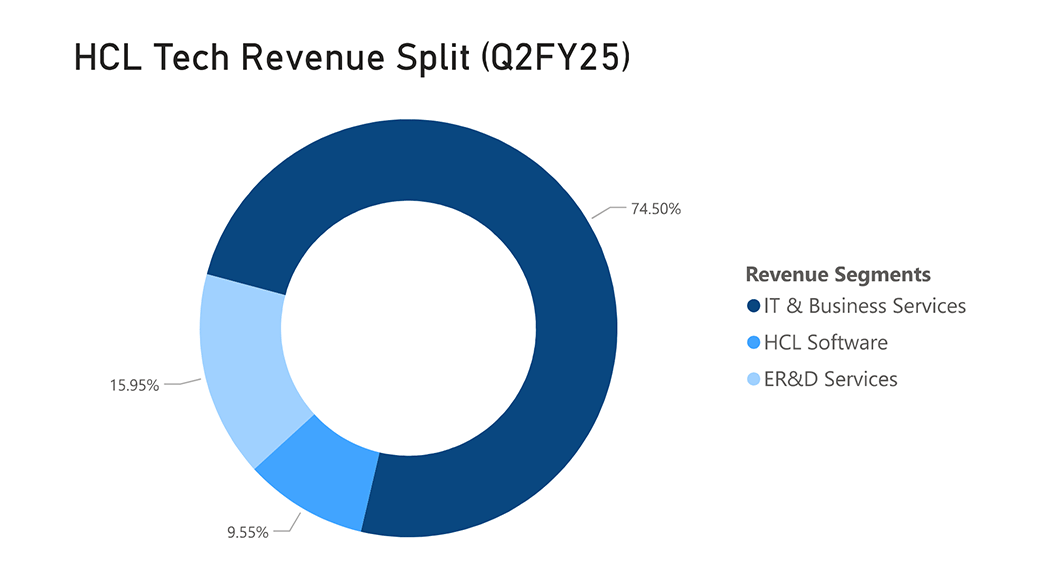
Revenue mix adjusted for inter-segment revenue
IT & Business Services (ITBS)
ITBS delivers digital solutions in applications, AI, cloud, infrastructure, and digital operations to meet global enterprise needs, that enable significant transformations for businesses.
Digital Services
This sub-segment of the Services vertical offers services like Digital consulting, application management and services etc. With over 152 patents, 75 solution offerings, 36 partnerships/collaborations, and over 400+ clients, the digital services vertical is rapidly changing the way businesses are run.
GenAI is one of the critical components of the digital transformation services offered by HCLTech.
Under Digital Foundation services (DFS), HCL offers Hybrid and Multicloud Services, Digital Workplace Services, network services (SDWAN & 5G upgrades & maintenance), Cybersecurity Services, Unified Service Management and Intelligent Operations.
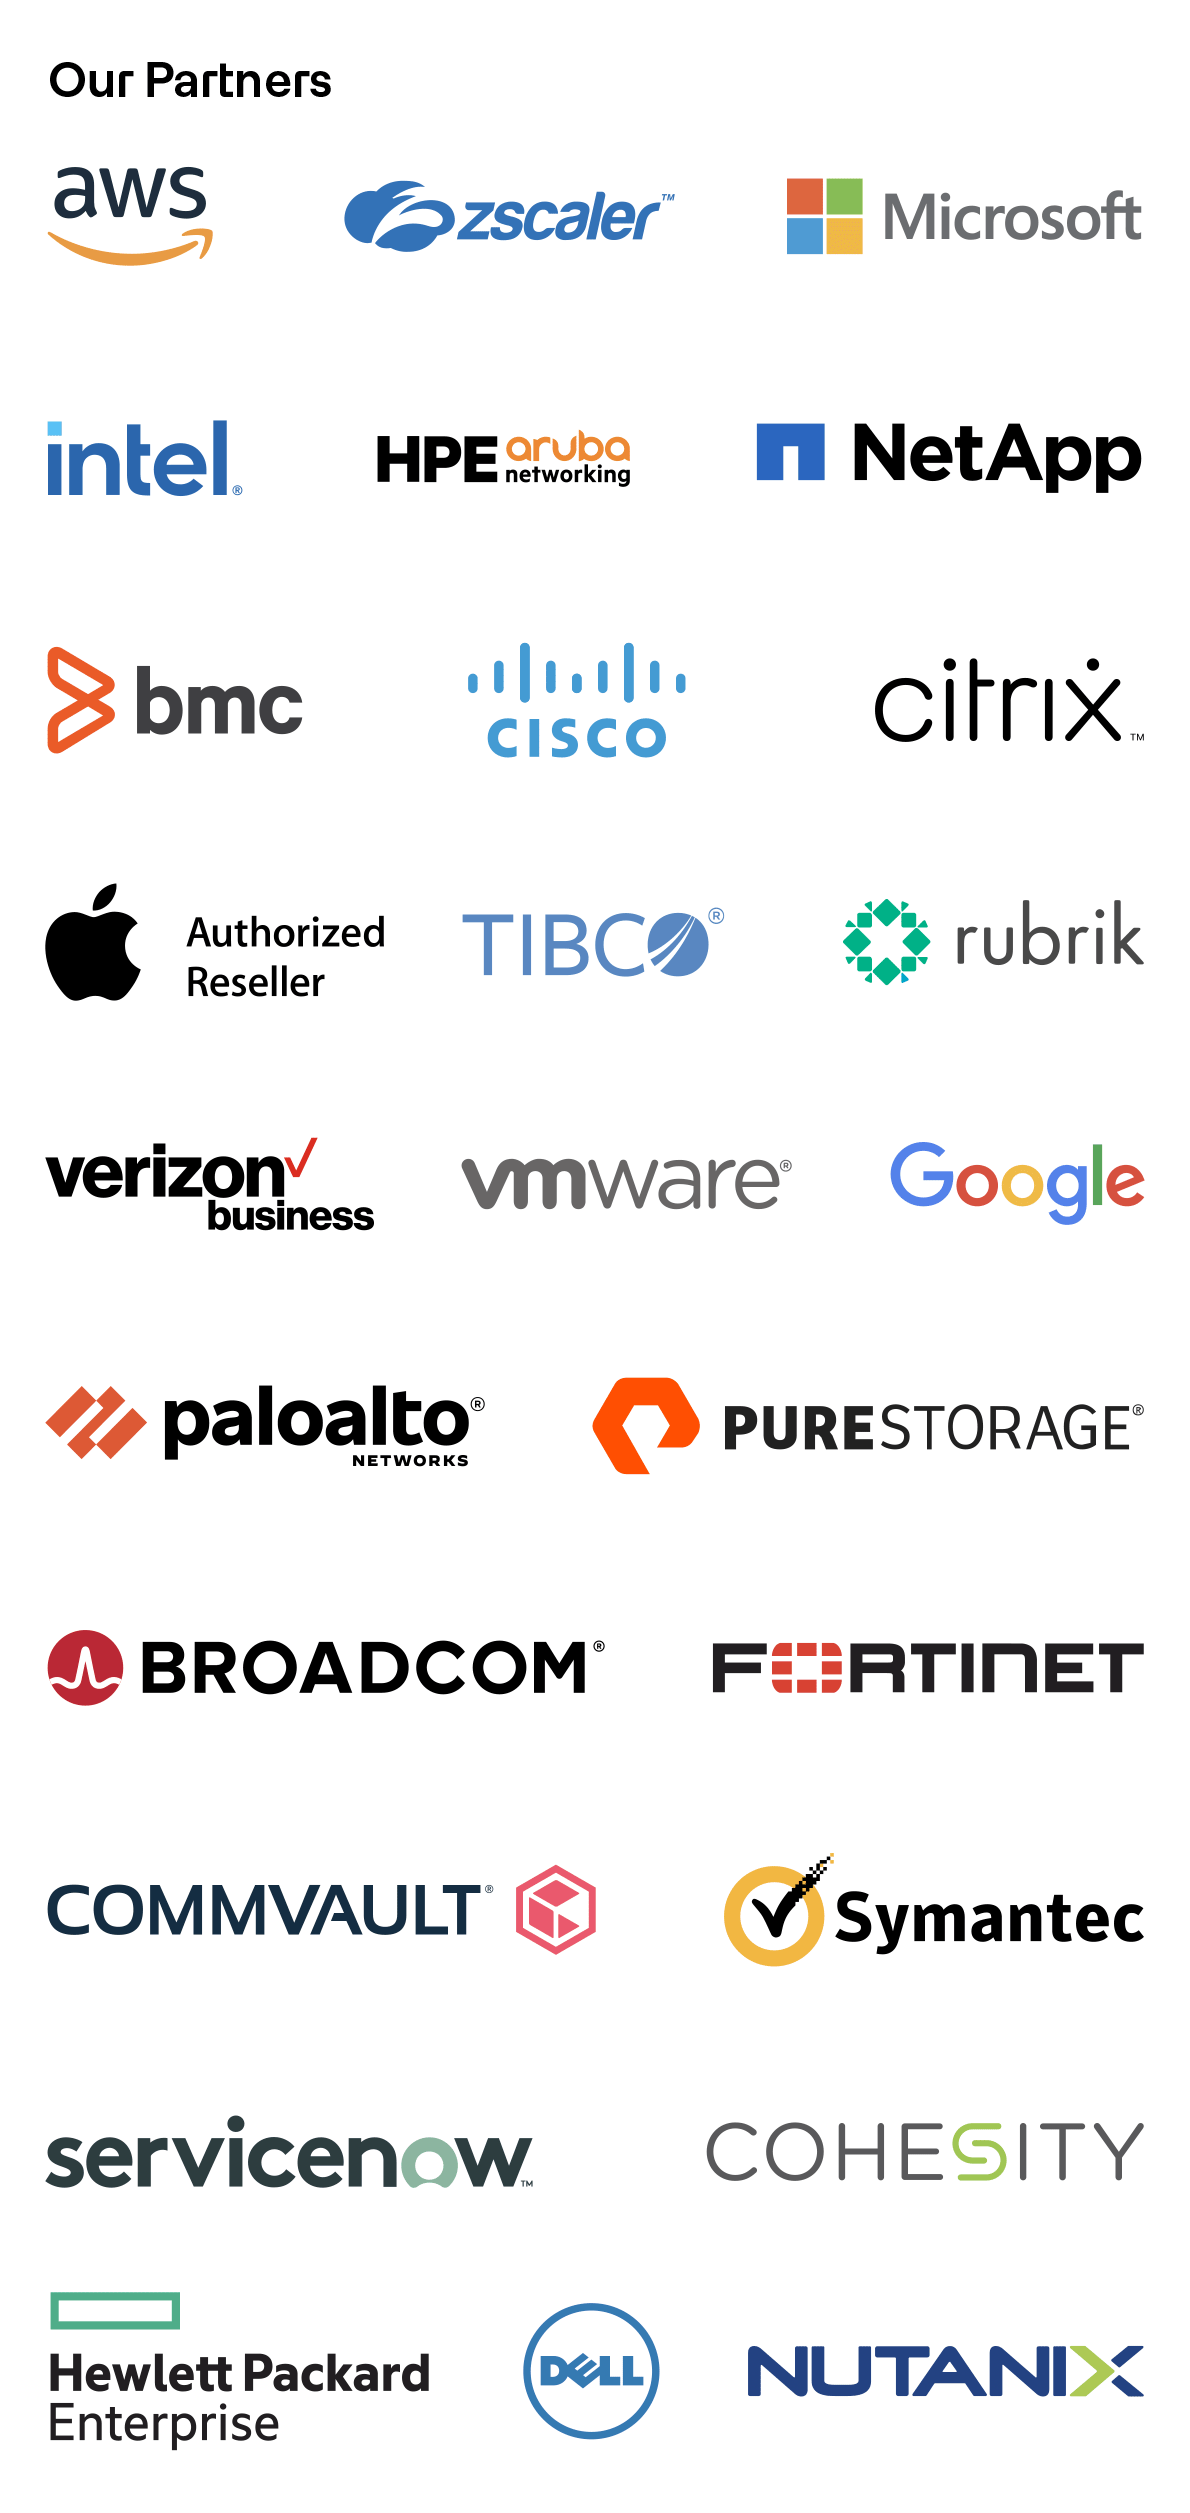
The image on the right shows some of the prominent partners of HCLTech in the Digital services ecosystem.
As the name suggests, “Digital Process operations” aims to optimize the speed, agility, and efficiency of business processes and customer experiences. This also uses the above-mentioned technologies to help their clients.
Source: HCL Technologies FY2024 Annual Report
Recent Updates
- SAP modernization programs have been driving growth for the company, alongside deal wins.
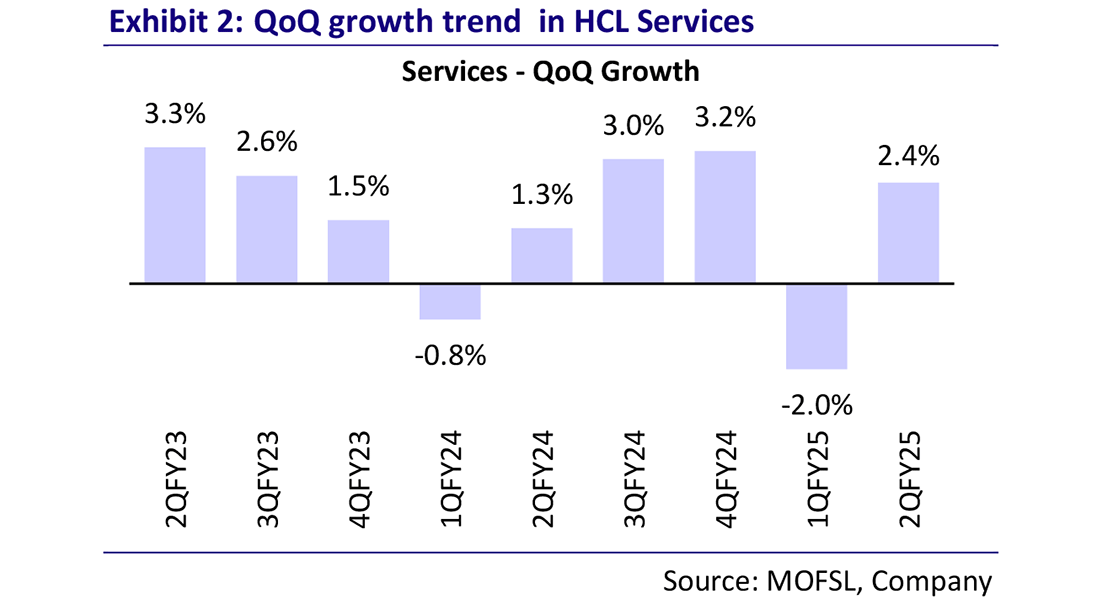
- The services vertical is seeing consistent QoQ growth:
- Shining through the darkness:
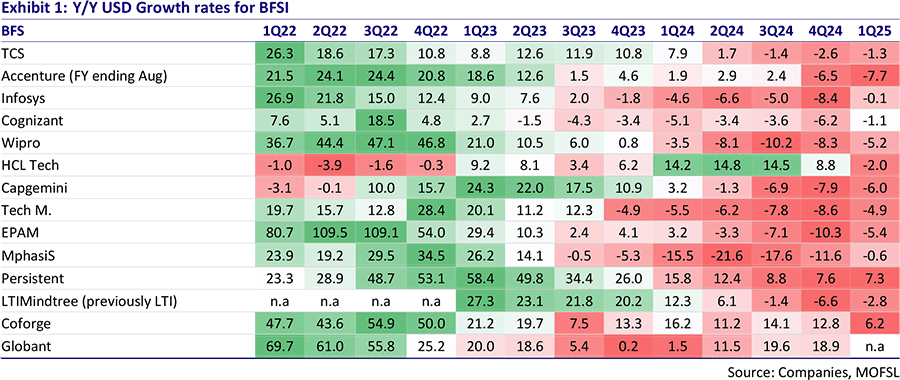
HCLTECH’s BFSI business has not only delivered industry-leading growth in FY24, going into FY25 but has also defied the overall IT industry slowdown during the same period.
HCL Software
HCLSoftware offers software products and cloud-based solutions across Total Experience (TX), Business Applications and Industry Software, Data and Analytics (Actian), Intelligent Operations (IO), and Security and Compliance, along with a bucket of Specialized Products, to make organizations more competitive while providing strategic insights and technologies needed to succeed in an increasingly hyperconnected world. It caters to 65 of the Fortune 100 and 220 Fortune 500 companies worldwide.

Recent Updates
- HCL Software’s revenue has been lumpy in nature:
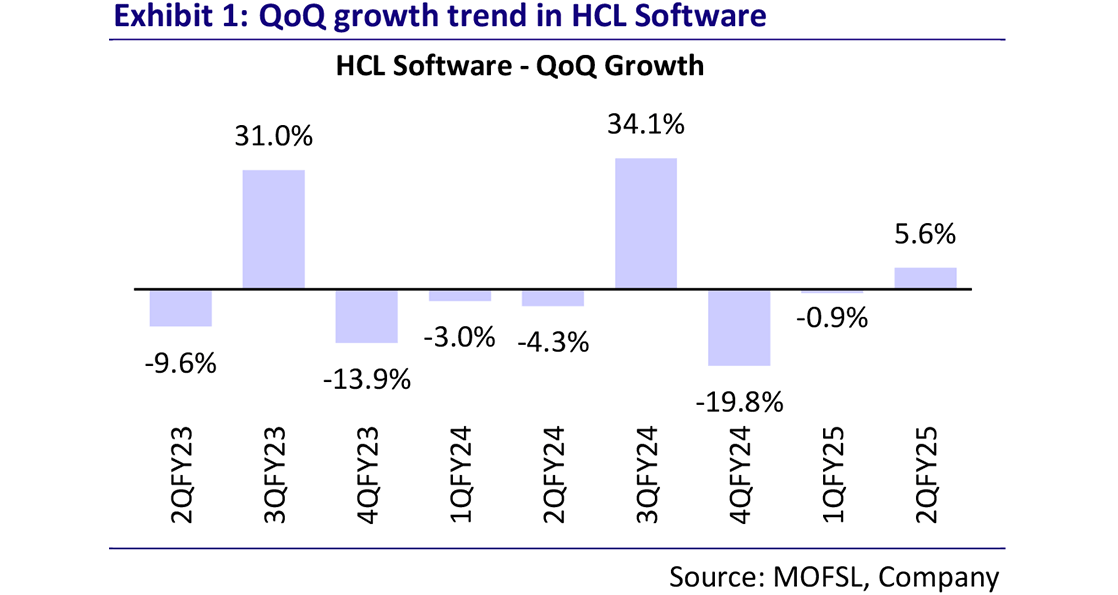
Q3FY25 should deliver a healthy performance, owing to seasonality.
- The Annual revenue rate (ARR) for this segment for HCL Software is $1.05bn
- HCL Unica (a customer marketing platform for enterprises) is seeing healthy traction, driven by an increase in subscription and renewals
- HCLSoftware delivered strong profitability in Q2FY25, with the operating margins coming in at 32.9%.
ER&D Vertical
We discuss this vertical later in the article.
TCV & Clients
- TCV of new deals won in FY24 was $9.8bn, up 10% YoY.
- In FY24, HCLTech added 3 clients in the $100mn+ category, 6 in the $20mn+ category, 25 in the $10mn+ category, and 20 in the $5mn+ category. It won 73 large deals: 36 in services and 37 in software.
- In Q2FY25, the total TCV of new deals won was USD 2.2.18bn, up 13% QoQ (Q4FY24: $2.3Bn, Q1FY25: $2bn), with a total of 20 deals signed: 8 in the software business and 12 in the services business (IT and ER&D).

The table above shows the number of clients based on the deal value in US$. A healthy deal-win momentum was witnessed across buckets in Q2FY25.
- The Verizon Deal: In the largest-ever services deal in its history, HCLTECH signed a $2.1bn deal with Verizon Business in FY24. HCLTech will lead post-sales implementation, cloud transformation, and ongoing support. Further, Flexspace5G is another initiative of this partnership, that caters to remote work environments and allied solutions that improve efficiency and performance.
Key Areas for Future Growth
Cloud & Cybersecurity
The cloud is a network of remote servers that store, manage, and process data over the Internet, allowing users to access and use applications and services without needing physical infrastructure.
- HCLTECH offers an extensive suite of cloud offerings including Hybrid Cloud, AWS, Microsoft Azure, Google Cloud, etc.
- HCLTECH’s proprietary “CloudSMART platform” is a consultancy service that provides a framework for leveraging all the capabilities of cloud to transform a business. HCLTECH boasts of:
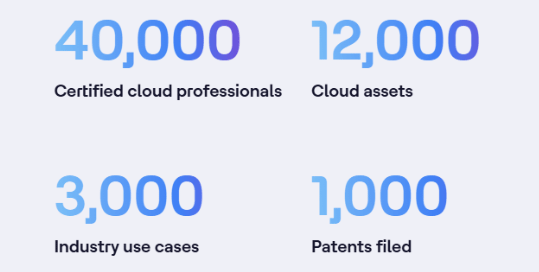
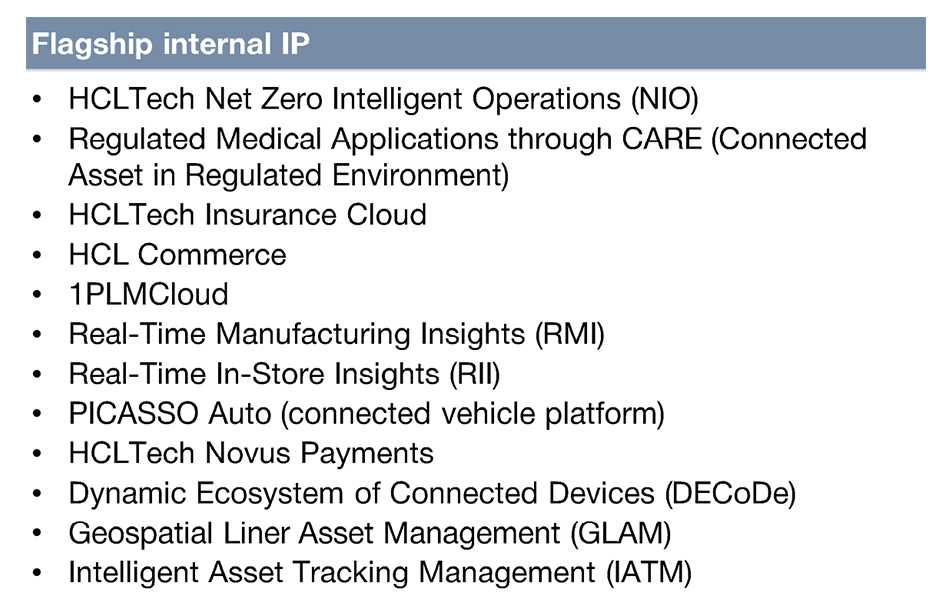
Key applications under CloudSMART
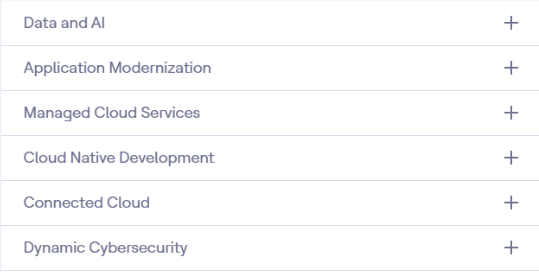
- A snippet of HCLTech’s Cloud-related offerings & Cloud-related M&A and partnerships:
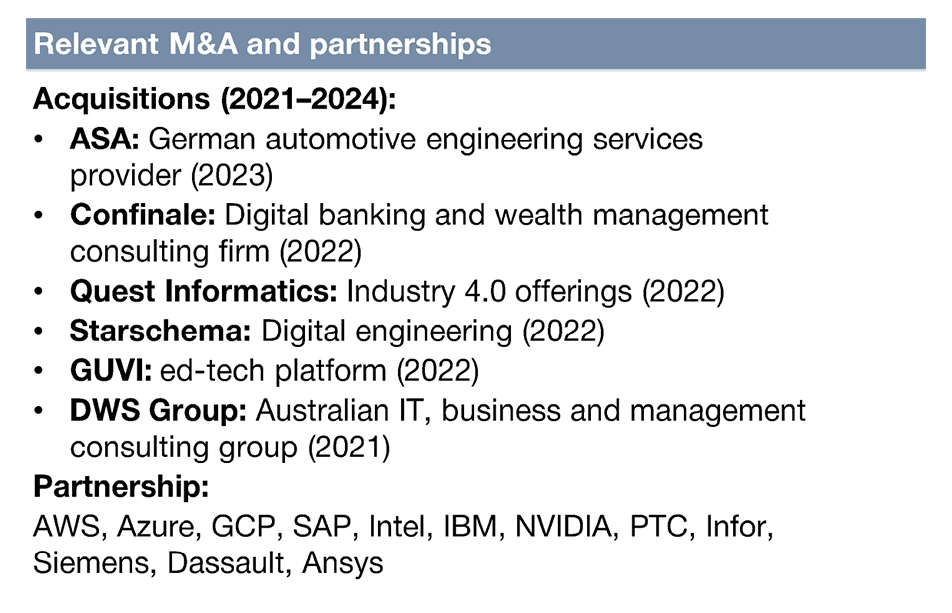
- The future of IT lies in a hybrid model, combining the flexibility of cloud services with the control and compliance of on-premises data centres. This approach allows organizations to meet regulatory requirements, maintain legacy systems, and harness the scalability and innovation of the cloud.
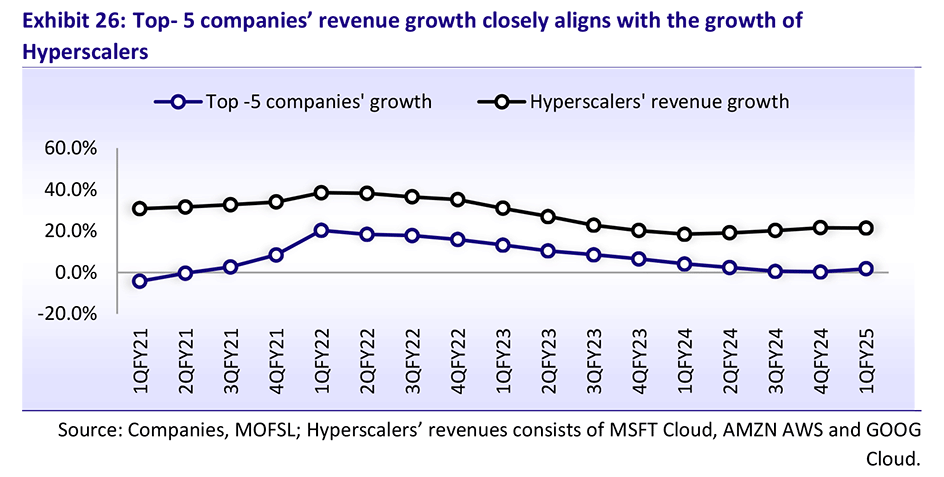
- The fact that the revenue growth of the top 5 IT firms in India are closely aligned with the hyperscalers (namely Microsoft, Google, and Amazon Web Services speaks volumes about the interlinkage between Indian and US IT companies.
GenAI
GenAI refers to artificial intelligence systems that can create new content, such as text, images, or music, based on patterns learned from large datasets.
- Cloud ecosystem, a precursor to GenAI ecosystem:
Once a suitable cloud infrastructure is in place, companies can then start to build the GenAI ecosystem on top of that. Organizations with a modernized data estate will be able to adapt swiftly to this evolving ecosystem. - HCLTECH has already delivered over 200 proofs of concepts for GenAI to its clients.

- The AI Force platform has 25 clients so far.
-
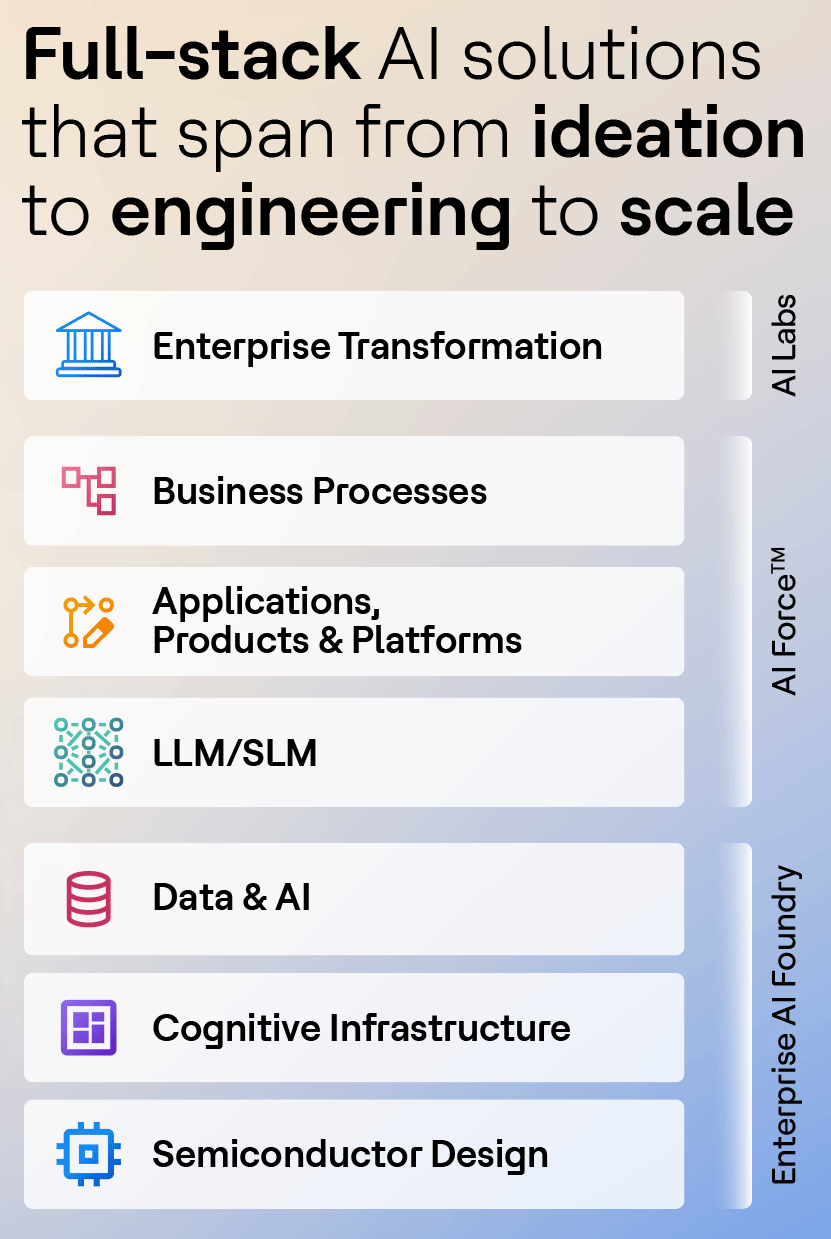
HCL technologies offer a comprehensive stack of AI solutions - across a wide spectrum of business applications, right from Ideation – to Engineering – to Scaling.
- AIForce: HCLTech’s AI ForceTM is built on Microsoft's Azure OpenAI and is capable of integration with GitHub Copilot, Google Gemini and AWS Anthropic Claude 3 Haiku in AWS Bedrock.
- Enterprise AI Foundry: is also built on Microsoft’s Fabric Copilot, Azure AI Studio, Azure OpenAI Service and Cognitive Services.
- AI Labs: Mainly used for early-stage planning, development or design using GenAI features. Proven business concept with over 200 projects undertaken.
Source: HCL Technologies FY2024 Annual Report
ER&D
HCLTech offers ER&D solutions to clients across industries like ISVs, consumer electronics, semiconductors, telecom and networking, medical, manufacturing, and transportation.
The outlook for this vertical is promising, specifically for automotive ER&D, especially after the acquisition of German automotive engineering services company ASAP Group for $279.2mn (~INR 2,295cr) in July 2023. ASAP group works with 63 of the top 100 global engineering R&D spenders. The acquisition will enable HCLTECH to become an important stakeholder in the technology transition underway in the automotive space globally.
Initiatives in the Semiconductor space
HCLTech has existing partnerships/collaborations with companies like Intel Foundry, Arm Holdings Plc., and CAST for semiconductor design and development.
Last month, the Foxconn Group announced a JV with HCL Technologies for an OSAT facility in India, mostly in the UP. The JV is in the works and more updates should flow in soon. The JV is with HCLTech’s promoter company Vama Sundari Investments, but there will be definite adjacency benefits that will flow through into HCL Technologies.
Key Deal Wins across business areas in Q2FY25
IT Services
- Biopharma Client for SAP managed service to improve business processes.
- US Financial services provider – cloud migration to improve fraud resilience. Digital Workplace Solutions.
- Europe-based financial service provider for Digital Workplace solutions
- A Fortune 50 telecom company - for a single client, integrated tech offerings across 17 countries
- A North American power and energy distribution company – business enterprise software – back end uses
- A leading Europe-based access management solutions provider – setting up GCC and optimization of costs & to manage digital applications
- An Africa-based technology services provider - Data sovereignty - collaboration with the African govt.
- A Fortune 50 global financial services company selected HCLTech to build an AI-based solution to automate document processing systems and create an efficient workflow system to reduce manual work.
ER&D and/or Semiconductors
- Fortune 500 MedTech company for managing its digital engineering hub and accelerating the modernization of its legacy software platform
- A Europe-based global semiconductor and computing technology major – Chip design and Development program
- Europe-based semiconductor company – Semiconductor initiative to build low-cost microcontrollers using Neural networks
Cloud and/or Cybersecurity
- US Financial Service company, cloud migration, fraud risk management.
- US-based diversified financial services provider – modernization of hybrid cloud and boost cybersecurity resiliency.
GenAI
- Xerox for AI Force
- A Fortune 100 global technology company selected HCLTech for creating a GenAI-as-a-Service (GaaS) platform.
- A US-based networking major selected HCLTech AI Force for test automation efficiency for network devices. The deployment reduced the test automation workload by 40%.
Why do we like HCLTech?
- Industry-best revenue and profit growth metrics:
Over the last one and a half decade, HCLTech has led the industry growth 50% of the time, while during other times it has delivered above industry-average growth rates, barring just 3 financial years. We tabulate the 5-year trend in revenues and profit before tax (PBT) for HCLTECH and its comparable peer (based on scale, market cap) group below:Particulars (Rs Cr) HCLTech TCS Infosys Tech Mahindra WIPRO Revenue PBT Revenue PBT Revenue PBT Revenue PBT Revenue PBT FY19 60,427 12,622 1,46,463 41,563 82,675 21,041 34,742 5,543 59,019 11,542 FY20 70,676 13,980 1,56,949 42,248 90,791 22,007 36,868 5,058 61,138 12,252 FY21 75,379 15,853 1,64,177 43,760 1,00,472 26,628 37,855 5,953 61,935 13,903 FY22 85,651 16,951 1,91,754 51,687 1,21,641 30,110 44,646 7,452 79,312 15,141 FY23 1,01,456 19,488 2,25,458 56,907 1,46,767 33,322 53,290 6,446 90,488 14,766 FY24 1,09,913 20,967 2,40,893 61,997 1,53,670 35,988 51,996 3,224 89,760 14,721 CAGR 13% 11% 10% 8% 13% 11% 8% -10% 9% 5% Source: Company Filings, stockaxis Research
- Established global standing as a Global Systems Integrator (GSI):
The emerging complexities and resource constraints for integration, managing, and scaling AI, digital, Cloud, and Cybersecurity projects is driving the demand for leading Global System Integrators like HCLTECH. - Global Partnerships and Collaborations:
HCLTECH has left no stone unturned in joining hands with the ones with relevant capabilities globally. It has used its vast resources and expertise to collaborate with a wide spectrum of companies such as Verizon Inc., CrowdStrike Holdings Inc., and global tech giants like Google, Amazon, NVIDIA, IBM, etc. to name a few.
Strategic partnerships/collaborations with “top-tier” OEMs, IP owners, software vendors, Cloud Service providers, Enterprise application providers, Open-source model providers, Full-stack LLM developers, etc.
The “Joint-go-to-market” model across geographies and industries has worked very well for HCLTech. -
Granular client base:
As seen in the table below, client concentration for HCLTECH is considerably low, with the top 5 clients accounting for only 9.8% of the total revenues, the top 10 accounting for 17.2% of revenues, and the top 20 accounting for 27.3% of the total revenues.
- Exposure to R&D-intensive markets like the US, Canada & Europe:
A significant exposure to the Americas & Europe gives HCLTECH global competitiveness in areas like design engineering and other emerging technologies. The Americas (including the US, Canada, Mexico, and South American economies like Brazil, Argentina, etc) account for 64.5% of the total services revenue for HCLTECH. Europe comes in second at 28.5%.
Valuation Multiples – A case for justifying valuations
| Particulars | 10Y Median Mcap/Sales | All-time Median Mcap/Sales | Present Mcap/Sales | %Premium over historical multiples |
|---|---|---|---|---|
| TCS | 5.4 | 5.3 | 6 | 12% |
| INFY | 4.2 | 4.4 | 4.8 | 12% |
| HCLTECH | 3.0 | 2.7 | 4.4 | 54% |
| TECHM | 2.1 | 2.1 | 3.1 | 48% |
| WIPRO | 2.6 | 2.8 | 3.4 | 26% |
| LTIM | 3.9 | 3.9 | 4.8 | 23% |
| Average | 3.5 | 3.5 | 4.4 | 25% |
When it comes to the Market Capitalization/Sales ratio, HCLTECH beats its peers on 3 fronts:
- HCLTECH trades at a significant premium to its own averages, when it comes to market capitalization to sales (or Price to sales).
- It also beats the average industry premium of 25% vs its own 54%
- Industry leaders Infosys and TCS themselves only trade at a premium of 12% over their respective historical multiples, but then their own multiples are higher than other peers.
HCLTECH warrants such a premium due to its:
- Growth leadership in the industry,
- Optimistic future earnings expectations
- Business initiatives such as multi-year strategic partnerships, a global association with Cloud computing & software giants like Amazon, Google, Microsoft, Nvidia, RedHat, etc.
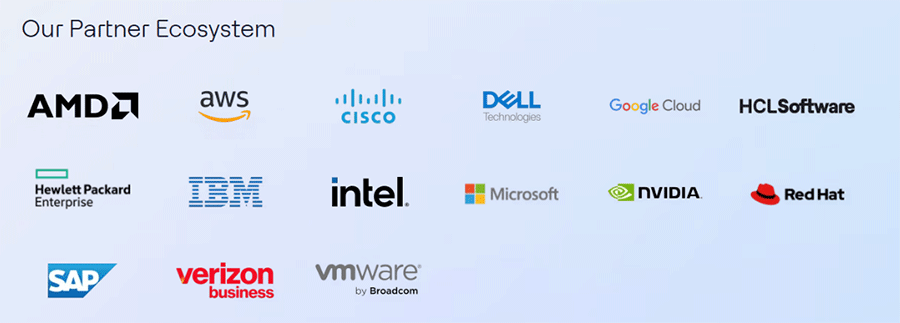
(Global partners in the cloud business)
- Increasing participation in transformational transition in areas like Cloud migration, automotive ER&D, Semiconductor chip design & development, and GenAI.
- We should also consider the dividend payout in our total return expectations, which have been upped by the company over the last 4 financial years. From FY2020-2024, HCLTECH has paid 16.7%, 63.3%, 84%, 88%, and 90% of its earnings to its equity shareholders. Its dividend policy states a minimum payout of 75% till FY26.
On the PE ratio front, HCLTECH is in line with the industry averages, trading at a PE of ~30x vs the industry average of 34x and a median of 30x.
Future Outlook
The Company upped its revenue growth guidance to 3.5% - 5.0% YoY in CC (3-5 guided earlier). EBIT margin is guided to be between 18.0% – 19.0%. Given its core fundamentals and a strong track record of delivering industry-leading growth, we believe HCLTech will continue to take the lead in emerging and existing initiatives in the IT industry and will thus drive long-term value for its stakeholders.
A Side Note on Philanthropy
Mr. Shiv Nadar, founder of HCLTech emerged as India’s leading philanthropist donating Rs. 2,153cr in FY2024, averaging 5.9cr per day. The 79-year-old mainly donates to education and technological endeavors through the Shiv Nadar Foundation. He has topped the EdelGive Hurun India Philanthropy List 3 times in the past 5 years.
The TATA Way
Fostering Capitalism with a Heart
Did you know that the Tata Group is over 156 years old?
That is quite a long time indeed. The fact that the Tatas are one of the few business houses to have been around for so long is a feat in itself. It also speaks volumes about the core values and principles that the Tata Group is built on.
With a combined market capitalization of over ~INR 33 lakh crore or ~$400bn and revenues of ~$165bn in FY24, the group has grown multi-fold, especially post Mr. Ratan Tata’s ascendancy as Group Chairman.
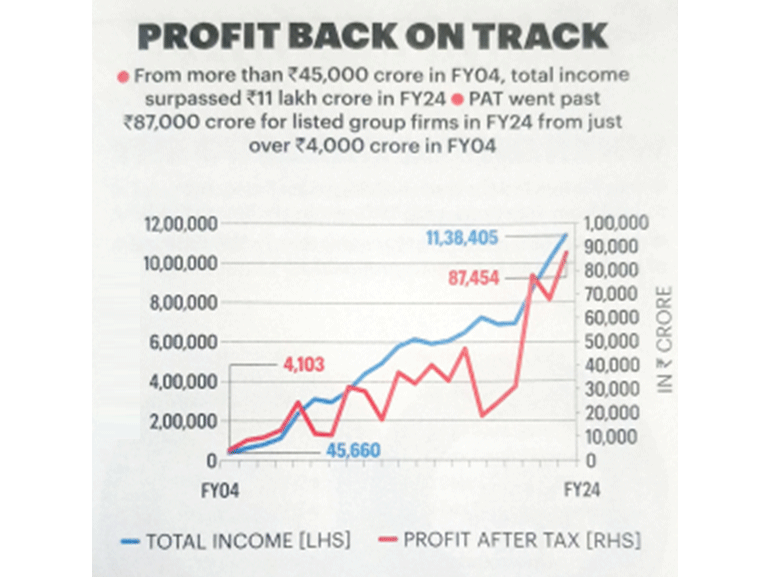
The Tata Group has compounded its business at a CAGR of ~17% over the last two decades. (Source: Business Today)
In this article, we revisit the illustrious legacy of the Tatas, and what really made them so special. The Tatas are a role model to anyone and everyone aspiring to pursue “capitalism with a heart.”
The TATA Stable
The Tata group has had 7 chairmen over its 156-year-long tenure, which are as follows:
| Name | Tenure |
|---|---|
| Jamsetji Tata | 1868–1904 |
| Sir Dorabji Tata | 1904–1932 |
| Nowroji Saklatwala | 1932–1938 |
| J. R. D. Tata | 1938–1991 |
| Ratan Tata | 1991–2012, 2016–2017 |
| Cyrus Mistry | 2012–2016 |
| Natarajan Chandrasekaran | 2017–present |
Source: Jagran Josh
The above-mentioned leaders imbibed the Tata values and principles across their businesses. Mr. Ratan Tata was merely following the qualities instilled in the group culture.
Dorabji and JRD Tata had faced tough times, where setting up businesses took humongous efforts. However, Mr. Ratan Tata was able to take these efforts and propel the group to new heights, driven by his able leadership and the tailwinds like the Indian economy opening post the 1990s. Surprisingly, his ascendance as Chairman of the Tata Sons coincided with the year of liberalization of the Indian economy.
Each of the above leaders had their own legacy and leadership styles, and their contributions to Indian society, polity, and economy are invaluable.
The current Chairman, Mr. N Chandrasekaran has spent over 30 years at TCS and now strives to take the Tata legacy forward.
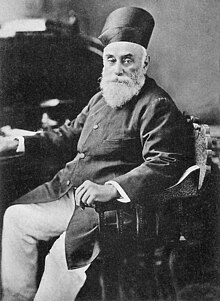
Sir Jamshedji Nusserwanji Tata
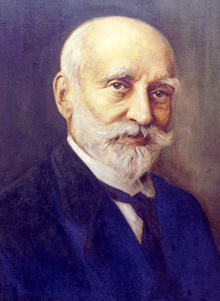
Sir Dorabji Tata
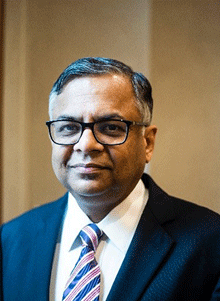
Mr. N Chandrasekaran
The Tatas were responsible for setting up several “firsts” for India:
- India’s first Steel Plant, named TISCO- 1907
- India’s first Airline (Tata Airlines -> Air India)
- India’s first Institute of Science (Indian Institute of Science) -1909
- Western India’s first Hydro Electric Plant - 1910
- Pioneers of the indigenization of soaps in India via TOMCO (Hamam and Moti brands)
- One of the pioneers in Soda Ash manufacturing in India.
- India’s first indigenously made passenger vehicle, Tata Indica. One of the oldest automotive manufacturers in India, via TELCO -> Tata Motors
One can imagine the kind of expertise, planning, confidence, determination, and conviction that would have been required to set up these projects when no one else has done it before.
The stories of how Tata Steel was built and how & Tata Indica was born in India are truly inspirational.
Through Thick and Thin
The Tatas have witnessed India and the world through different phases of its evolution. Be it World War 2, the British Rule in India, or the rise and fall of several governments, the Tatas have witnessed the successes, failures, growth and pessimism, the struggle and the serenity that India was synonymous with over these years.
From India’s first Prime Minister, Jawaharlal Nehru, to our current Prime Minister, Shri Narendra Modi, the Tatas have not only contributed to national progress but have also been key advisors to the government on shaping economic and social policy for our country.
The path was not easy, with a lot of struggles on the way. Jamsetji, JRD, and the succeeding leaders of the Tata stable had struggled for decades with the License Raj, the governments’ socialist stance on the industry, and the constant controls on companies, such as nationalization, forced shut-downs, mergers, and spin-offs without consulting the business owners. Words cannot express the pain felt by the Tatas at the time when their dream projects like Air India were nationalized and JRD was removed as Chairman from the board. A few other companies like New India Assurance were also nationalized. At one point, the government had come to a decision to merge Tata Steel with other steel companies and make it a public sector entity (This proposal was later withdrawn). Years of work were at stake, yet the Tatas never lost their grit and persevered, hoping for better times to come.
Leaders, like JRD Tata, criticized government policies on numerous occasions, but he never allowed himself to be bitter about it. Mr. Ratan Tata quoted in an interview that, “his (JRD’s) love for the nation was far larger, so he took all of that in stride”.
There were several instances of union strikes & political upheavals at Tata Motors, and Tata Steel, that disrupted business, such as the shifting of the shifting the entire Tata Nano plant from Singur, West Bengal to Sanand, Gujarat. But all of those were handled with impeccable maturity and eventually subsided over time.
Mr. Ratan Tata (1937-2024)
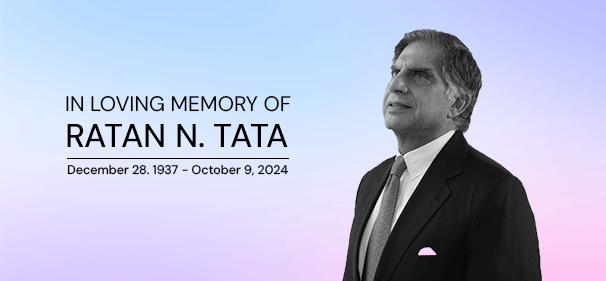
Mr. Ratan Tata took his last breath on the 9th of October 2024, at the age of 86, leaving behind a sparkling legacy and impeccable goodwill. Not only India, but several people across the globe mourned the death of this renowned industrialist.
Integrity – the word by which Mr. Tata lived by, was seen in his actions throughout his career.
Some of the landmark events that marked his tenure as chairman were:
- Driving Tata Motors’s entry into the passenger vehicle market.
- Driving bold acquisitions like Corus Steel by Tata Steel ($12bn in the year 2007), and Tetley by Tata Tea ($450mn in the year 2000)
- Turning around struggling businesses like Jaguar Land Rover and NELCO.
- Consolidating control of the Tata Sons: Mr. Ratan Tata was credited with the feat of regaining Tata Sons’ control over the Tata Group companies after ascendance to Chairmanship of Tata Sons. At that time, the Tata group was fragmented, with each of the large businesses being run as independent entities with fully autonomy. The stake of Tata Sons in each of these businesses had dwindled over time, and the risk of a takeover by competition was looming over the group. Mr. Tata, after consulting experts on the matter, took up the matter in his hands and implemented the plan to charge each of the group companies a royalty in order to use the “Tata” name. Almost all the group companies agreed, and naturally so, given the reputation of the Tata name, that was a huge benefit for each of the businesses.
The Hallmark of the TATAs
People across the board, all over the world, feel a sense of association with the Tatas. Why so?
- The hallmark of the Tatas has been to take extremely good care of its people (i.e. its stakeholders, employees, coworkers, etc.)
- Worker compensation schemes were introduced by Jamsetji Tata for the employees in Empress Mills, at a time when even the factories of England didn’t have any such thing for their employees.
- An attitude of giving to the society, community, the country, and the world at large.
- Reinvesting part of the profits back into society, which helps others and their own businesses in the long run.
- Placed immense faith in the Indian talent and youth: A prime example of this is the setting up of Titan company, which started off with hiring 400 local students who had just completed class 12 and trained them in Bengaluru.
- Abstinence from profiteering by taking advantage of market scarcity: When TELCO’s Tata 407 saw great success and trucks were in huge demand, suggestions were made to the management to increase the prices to take advantage of the same. JRD and Mr. Sumant Moolgaonkar advocated against taking undue advantage of the customer due to short-term demand-supply imbalances.
- Being a Truly Indian Global Conglomerate: Over 60% of the Tata Group’s revenue comes from exports. Not only does this bring valuable foreign exchange for the exchequer, but also bolsters India’s standing as a global hub for manufacturing and services.
Looking forward
N. Chandrasekaran, the current Chairman of the Tata Group has announced a capex outlay of over $90bn over the next five years across its businesses, including EV, batteries, 5G electronics, and semiconductors.
| Company | Committed Capex |
|---|---|
| Tata Power | $10bn |
| Tata Steel | $10bn |
| Tata Motors & JLR | $25bn |
Source: Business Today
The table above shows the committed capex for a few of the Tata Group companies, over the next 5 years.
Going forward, the group’s high-performing businesses like TCS, Tata Motors, Titan, Trent, Indian Hotels, and Tata Steel will continue to generate substantial profits for it.
Air India, which has struggled for over a century now, is undergoing pivotal changes. Vistara, a joint venture between Tata Group and Singapore Airlines, is set to merge with Air India in November 2024. Air India Express completed the merger of AIX Connect, formerly AirAsia India, with itself this month.
Disclaimer: Several excerpts in this article have been taken from the book: The TATAs – How a Family Built a Business and a Nation. We would like to give the credit for the same to its respected author, Mr. Girish Kuber.
PSU Banks Deliver a Surprise – Outpace Private Bank Profits in Q2
Not one or two, but the entire PSU banks space has reported outstanding numbers in Q2FY25, surpassing analyst estimates. Such an impressive set of numbers has once again surprised the pessimists of PSU banking.
We analyzed several metrics for PSU and Private Bank groups for QF2Y25, Q2FY24, and Q1FY25, the data for which is tabulated below:
| Particulars | Advances Growth | Deposits Growth | PAT growth | Avg P/B | ||||
|---|---|---|---|---|---|---|---|---|
| %YoY | %QoQ | %YoY | %QoQ | %YoY | %QoQ | |||
| Pvt Banks | 4% | 25% | 4% | 26% | -12% | 9% | 1.67 | |
| PSU Banks | 3% | 16% | 3% | 11% | 14% | 45% | 1.51 | |
Source: Company Filings, stockaxis Research
PSU Banks Shine in Q2
- In Q2FY25, the combined profits of the PSU Banks grew 14% YoY and 45% QoQ, outpacing the private banks at -12% YoY and 9% QoQ over the same periods.
- The average price-to-book ratio of PSU banks stood at 1.51x vs 1.67x for the private banks.
Given the current uptick in profitability for the PSU Banks, they may provide valuation comfort to investors looking to invest from a medium to long-term horizon. There is also room to consider companies within the PSU Bank space that may trade around its sector average and have significant PAT growth visibility over the next 3-4 years.
However, PSU banks are increasingly gaining favor owing to the growth coming from a low base, and other structural improvements in the balance sheets across the Indian banking space.
Indian banks are currently enjoying their strongest balance sheets in over a decade, marked by considerable improvements in asset quality, provision buffers, and adequate capitalization of their balance sheets.
The top three PSBs have performed even better in Q2:
Q2FY25
| Particulars | Advances Growth | Deposits Growth | PAT growth | |||
|---|---|---|---|---|---|---|
| %YoY | %QoQ | %YoY | %QoQ | %YoY | %QoQ | |
| State Bank of India | 3% | 15% | 4% | 9% | 3% | 23% |
| Bank Of Baroda | 7% | 12% | 4% | 9% | 19% | 26% |
| Punjab National Bank | 4% | 15% | 4% | 11% | 19% | 151% |
Source: Company Filings, stockaxis Research
Another evidence that the outperformance may be sector-wide is that the top 3 PSU banks have also shown similar outperformance vis-à-vis the top 3 private banks. The top 3 private banks grew their profits by 12%YoY and 18% QoQ, as compared to the growth rates of the PSU banks as seen in the table above.
PNB’s recovery has been quite interesting, as it delivered its highest-ever PAT in FY24. PNB's gross NPA ratio improved to Rs 4.48 percent at the end of September, from 4.98 percent at the end of June. Net NPA ratio too improved to 0.48 percent from 0.6 percent in the preceding quarter. New provisions and contingencies fell to just Rs. 288cr from Rs. 3,444cr, thus boosting its PAT. The lender’s RoA jumped to 1.02% vs 0.46% in the same quarter last year.
To Conclude
Historically, the private banks have traded at a premium to PSU banks.
However, there is a definite case for the gap narrowing in the near future, owing to:
- With The advent of UPI and payment facilitators like PhonePe, Paytm, Google Pay, Cred, and Navi, the fluidity of bank transactions has become a lot faster, more convenient, and easier.
- These same apps result in increasing partnerships via co-lending, which aids the loan book growth of these banks.
- Several PSBs have also become more competitive in terms of their own mobile applications, the prime examples being SBI Yono and Bank of Baroda’s BoB World.
- Digital interfaces have enabled better cross-selling of banking products and deposit instruments.
- Tighter lending standards, a large branch network, and controlling sector exposure can enable sustainable growth for PSU banks.
- For the PSU banks that exceed earnings expectations, the case for rerating can be very strong.


