October 2024: Market Insights, Sectoral Trends and Policy Initiatives
October 16, 2024
|
Global Market Developments
The intensification of conflict in the Middle East, coupled with the unexpectedly aggressive stimulus package introduced by the Chinese Government, has prompted a sell-off and a swift reallocation of funds from India to China by Foreign Portfolio Investors (FPIs). While we anticipate challenges in the short term, the narrative surrounding India remains robust, and domestic inflows will cushion FPI's sell-off. We are optimistic that a recovery will ensue.
Chinese stocks are being traded at notably low valuations due to reversion to socialist principles by the ruling party, and the collapse of the Chinese property market in recent years. The government's stimulus package appears to be a desperate measure aimed at reversing this trend. The difference in valuation, between the Indian and Chinese markets, which had expanded in recent years, has now contracted. While this gap may continue to narrow slightly, we believe that the most significant correction has already occurred. We anticipate that foreign portfolio investment will begin to flow back into India once the exuberant rally in the Chinese market subsides.
India Market Update
The pipeline of initial public offerings is currently robust and is expected to redirect capital from the secondary market in the upcoming months, potentially hindering its recovery. The upcoming significant event for the market is the United States Presidential election.
The earnings season for the Q2FY25 is imminent. We believe it is prudent to await the earnings announcements and evaluate the new information before making any buying or selling decision solely based on price movements. The approaching festive season is likely to enhance consumer demand and positively influence market sentiments.
India stands out as the most promising long-term investment for foreign investors in a global landscape that lacks sustainable growth prospects. This market correction presents an opportunity for investors to enhance their allocations to India.
In this month’s newsletter, we discuss some topics that intrigue us and are worth a long read. We will be covering the following topics in this month’s newsletter:
- The Brightest Spot of the Renewables Sector: Solar Power.
- National Electricity Plan and Energy Storage.
- India Inc. is Raising Massive Capital via the Public Markets.
So, lets dive in.
The Brightest Spot of the Renewables Sector: Solar Power
In this article, we delve into one of the most exciting arenas in the world of energy: - Solar Power. We discuss how India’s Solar Sector is shaping up, and how this mega industry is driving exponential growth for all stakeholders (including of course, investors)
Power Capacity in India - 2024
India today has a total power generation capacity of 448GW. Of this, conventional sources account for 56% of the total capacity, while renewables account for the remaining 44%. As of March 2024, the total Renewables capacity (Including Solar, Wind, and biofuel) stood at 191GW, having grown at a 9.3% CAGR since 2016. Compared to this, conventional sources (like Coal, Oil & Gas, and nuclear energy) have a capacity of 251GW, growing at a meagre 1.7% CAGR.
Capacity Additions: Solar Leads by a Large Margin
Across all sources of energy, Solar power has seen the largest capacity additions over FY18-24, adding over ~60GW of capacity over this period.

This is head and shoulders above any other renewable source, such as wind or hydro.
This goes on to show that Solar energy is by and far the most reliable, cost efficient, and scalable source of renewable power, and thus the preferred choice among all renewable sources of power.
This fact is reiterated given the massive investments made by Indian companies, be it mega conglomerates like Reliance and Adani, or mid-size companies like Waaree Renewable Energy, or small caps like Gensol Energy, to name a few examples.
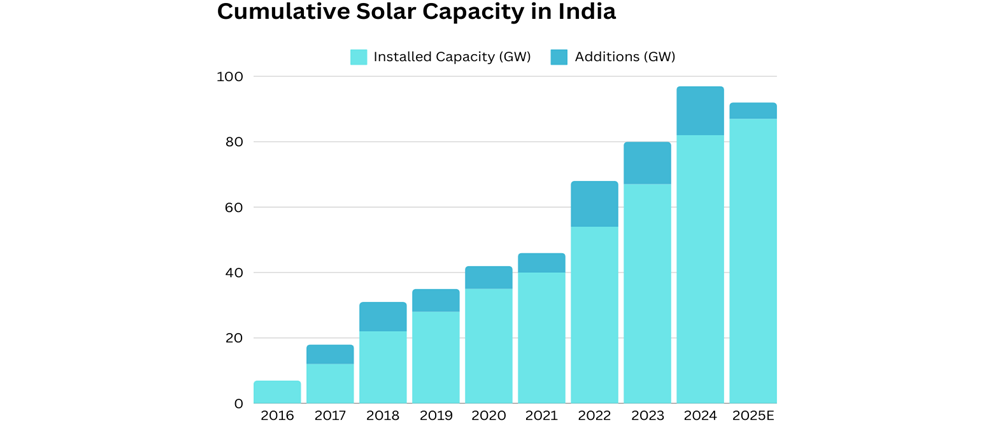
India’s Solar power capacity has grown at a CAGR of 33% from FY16-24.
Government support
The Indian government has offered financial as well as non-financial support to incentivize this sector.
The Indian government's capital expenditure (capex) on solar energy in 2024-2025 includes:
- Centrally Sponsored Scheme for Solar Power (Grid): INR 10,000 crore, which is up ~110% from INR 4,757 Cr in the previous year.
- PM-Surya Ghar Muft Bijli Yojana: An allocation of INR 6,250 crore; launched in February 2024. This scheme has a proposed outlay of Rs. 75,000 crore and aims to light up 1 crore households by providing up to 300 units of free electricity every month.
- The Ministry of New and Renewable Energy has been allocated INR 19,500 crore mainly for Solar PV Modules in the 2024 Union budget, which is a 143% increase from the previous year.
- The government also plans to impose a 10% customs duty on solar glass imports starting in October 2024. However, the government will exempt tinned copper interconnect from the 7% and 5% basic customs duty for use in solar cell and solar module manufacturing.
- Support for procuring, preserving, augmenting technology, extracting rare earth metals like Graphite, Silicon Quartz, and Silicon Dioxide, (required in manufacturing solar equipment) by reducing rates on them. These are critical for the manufacturing of solar modules.
Value Chain
There are numerous components to a Solar Photo-Voltaic (PV) System:
- The most basic building block is the silicon wafers/semiconductors that are manufactured from sand, and silicon. These go into manufacturing the solar cell.
- Solar Glass
- Solar Cell
- Solar PV Module
- Solar Inverters
- Tinned Copper Interconnect
- Power Storage - Battery
- Metering Equipment
- Conductors and Cables to connect to the grid
- Other equipment used in a power grid.
Solar companies can be broadly classified into (i) those building capacity & generating solar power (EPC cum O&M), and (ii) those manufacturing parts that make up a solar project/farm/park, right from solar glass to solar PV modules, and all other equipment required to connect to the grid.
The picture below shows us the entire manufacturing lifecycle, from Poly silicon (the core raw material) to the module.

The picture below is a subtle illustration of the module-to-grid integration:
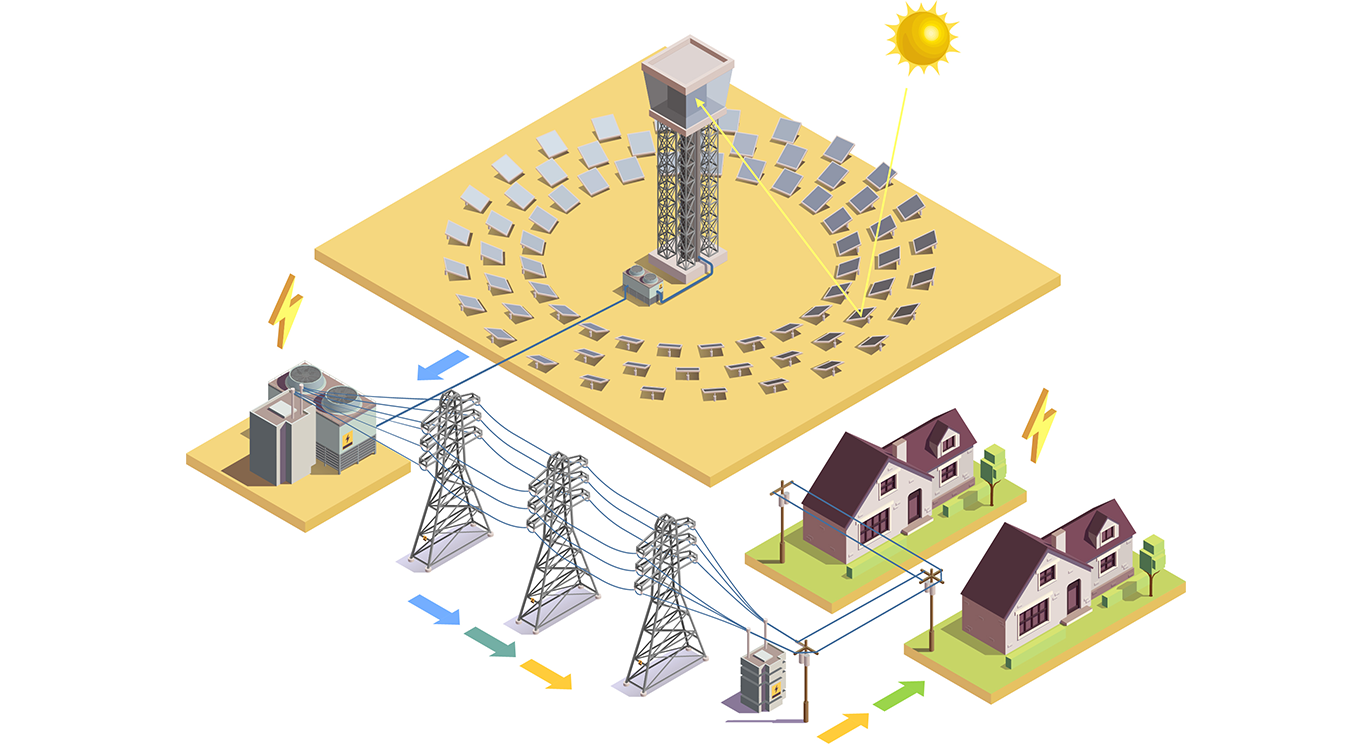
Key Facts and Developments in the Industry
- India ranks 3rd globally in terms of solar power generation, after China and the US.
- Solar power contributes about ~one-fifth of the total power capacity in India, versus just 2.2% in 2016.
- 59 solar parks with an aggregate capacity of 40 GW have been approved in India (A solar park is basically a large chunk of land developed with common infrastructure facilities like transmission infrastructure, road, water, drainage, communication network, etc. with all statutory clearances.)
- Adani Green Energy Limited (AGEL): is developing a 30GW hybrid renewable energy park in the Khavda Desert of Kutch, Gujarat, out of which 26GW will be Solar and 4GW will be wind energy capacity.
- Tata: Tata Power Solar has about 1.5GW of solar capacity, spread across 13 states and 17 utility-scale projects in India. On January 8, 2024, Tata Power announced a Rs 70,000 crore investment to develop 10 GW of solar and wind power capacity in Tamil Nadu over the next 5-7 years.
- Reliance: Industries (through its subsidiary Reliance New Energy) is setting up an integrated production facility with a capacity of 10GW.
- NTPC Renewable Energy Ltd: (NTPC-REL) a subsidiary of NTPC Ltd., operates ~3448MW of solar capacity in India.
- JSW Energy possess: 675MW of solar capacity as of 30th June 2024.
- KPI Green: commands a solar O&M capacity of 473 MW, as of 30th June 2024.
- Waaree Renewable Technologies: operates a solar power generation capacity of 578MW,
- CESC has acquired Deshraj Solar Energy with a 300MW capacity via its subsidiary, very recently.
- Torrent power has 403 MW operational solar O&M capacity and 1688 MW under development
- Premier Energies operates ~178 MW of solar capacity as of 30th June 2024.
Lessons to be learned from China
China has dominated the world in solar energy capacities for a VERY long time. From 2008 to 2012, China’s solar panel manufacturing capacity rose by an astounding 10x. In 2022, the capacity installed by China alone was equivalent to that installed by the rest of the world. It doubled on that capacity in 2023!
The exponential rise in China’s solar capacities is a golden example for oil-importing economies like India, which must follow suit and adopt an increasing % of renewable sources in its energy mix over the coming years.
The Chinese government has taken initiatives to reduce the dependence on conventional fossil fuels by incentivizing renewable energy sources. Yet a lot more needs to be achieved on this front. Even in 2024, China still generates about 70% of power from conventional sources, owing to factors such as the intermittency of renewable sources.
National Electricity Plan 2023-2032 & Energy Storage
Weather Events Are Inducing Power Security Measures Across the Globe
As the world advances toward sustainable energy, it has also encountered extreme weather events, such as record heatwaves in Asia, intense sandstorms in Beijing, and devastating cyclones in Africa and Myanmar. These challenges have put the resilience of power supply systems to the test and underscored the urgent need for investment in energy security. In response, some countries have reverted to traditional thermal sources for baseload power, while others have increased their renewable energy capacity.
The Surge in Energy Demand in India
- Energy demand, closely tied to GDP, saw a significant increase of 7.4% (Source: CEA), reaching 1,626 billion units (BU) in FY24. Projections indicate that electricity demand will peak at 458 GW by 2032. Over the past two years, energy demand has surged by 20%, raising the prospect of necessary revisions to the National Electricity Plan (NEP) 2022-27.
- The peak demand for power in September 2024 declined to 230 GW compared with 243 GW registered in the corresponding period of last fiscal, which was also the annual peak for the year.
- As of March 31, 2024, India's installed generation capacity stood at 442 GW (Source: CEA), reflecting a capacity addition of 26 GW during FY24.
The National Electricity Plan (NEP)
The Ministry of Power has finalized the National Electricity Plan for 2023-2032 which is to expand both central and state transmission systems to meet a projected peak electricity demand of 458GW by 2032.
As per the plan, with a planned investment of IN 9.15 lakh crore India’s transmission network will undergo a massive upgrade, expanding from 4.85 lakh circuit kilometres (ckm) in 2024 to 6.48 lakh ckm by 2032 (3.69% CAGR).
It is worthy to note that the announced capital outlay is for upgrading only the power “transmission” network. The outlay for the power “generation” and “distribution” would be separate and about equal in magnitude, if not more.
What All is Going Under Upgrade?
The transformation capacity will rise from 1251 GVA to 2,342 GVA, and 9 HVDC (High Voltage Direct Current) lines with a combined capacity of 33.25GW will be added (on top of the existing 33.5). These upgrades will support the integration of renewable energy sources, such as offshore wind and solar power, into the grid.
50GW of Inter-State Transmission System capacity (ISTS) approved.
Transmission projects worth 50.9GW were approved, with a project cost of Rs 60.676cr.
On the conventional energy side, coal-based capacity is expected to increase by nearly 17 GW-28 GW, by 2031-32, over and above the 25 GW of coal-based capacity that is currently under construction. The government projects to increase the plant load factor (a measure of efficiency) of the coal-fired power plants from 55% up to 2026-27 and 62% in 2031-32.
Mr. Alok Kumar, Chairperson of the Central Electricity Authority (CEA), stated that India expects to have 1 lakh EV charging stations by 2030. A list of other procedures and guidelines was streamlined cum standardised to further ease the setting up of EV charging stations.
India plans to add 39 GW of Pumped Storage Project (PSP) capacity by 2030. Around 4.7 GW of this capacity is already installed, 6.47 GW is under construction and 60GW is in the planning stages. This, 60 GW can be attributed to private players, signalling their keen interest in PSP.
The draft Plan also highlights the need for significant investments in battery storage, with an estimated requirement of between 51 GW to 84 GW by 2031-32.
Equity assistance of up to 750cr per project (up to 24%) is being offered to boost Hydro Power capacity in the Northeast. Another ₹12,461cr was allocated towards financing transmission networks of hydropower projects.


Who will be the likely beneficiaries?
The beneficiaries of the National Electricity Plan will be:
- Transmission Companies: NTPC, PowerGrid, Adani Green, Adani Power, Tata Power, JSW Energy, Adani Energy Solutions, Torrent Power, NHPC, SJVN, CESC, Waaree Renewables, Reliance Power, Inox Wind Energy, JP Power Ventures, Nava Ld., GMR Power and Urban, Rattan India Power, PTC India, BF Utilities, Gujarat Industries and Power, Orient Green Power, Kalpataru projects International Ltd.
- Conductors, Cables: Polycab, KEI Ind, Finolex Cables, RR Kabel, Sterlite Technologies, Precision Wire, Paramount Communications, Universal Cables.
- Switchgear: ABB, Siemens, L&T, Havells, CG Power & Industrial Solutions, Schneider Electric, GE T&D India, Crompton Greaves, BHEL, Kirloskar Electric Co.
- Transformers: Voltamp Transformers, Transformers & Rectifiers, Apar Industries, CG power, Shilchar Technologies, Siemens, ABB, Hitachi Energy India, Kirloskar Electric Co.
- EPC players: BHEL, L&T, Tata Power, Sterlite Power & Transmission, Reliance Infra, Sterling & Wilson Renewable Energy Ltd.
- Meters: Genus Power Infra, Tata Power, HPL Electric and Power, Adani Energy Solutions, GMR Power and Urban Infra, Rishabh Instruments.
- Energy Storage Companies: (covered later in the article)
-
Indirect beneficiaries:
- Power Finance Companies: PFC, REC, IREDA
- Renewable Energy Companies
- EV Car manufacturers and Associated Charging Infrastructure
The National Electricity Plan has specifically taken into consideration the need for energy storage capacities. We discuss this intriguing aspect of the NEP below:
Energy Storage
A proxy + pivotal industry is born in 2024
Energy storage is key to securing constant energy supply to power systems – especially for renewable sources - even in the absence of sunlight or the paucity of adequate wind. It provides flexibility, enhances grid reliability and power quality, and accommodates the scale-up of renewable energy capacities.
Energy Storage is an essential piece in the overall power infrastructure framework. It is natural then to see a consequential increase in energy storage capacities, with an increase in power generation capacity – India plans to nearly double its power capacity to about 900GW by 2030, up from the current 427GW, at an expected CAGR of 13.23%.
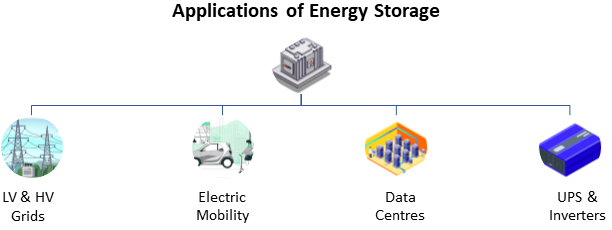
The following figure illustrates the broader applications of Energy Storage:
The picture below illustrates the key players in the Indian Energy Storage Landscape:
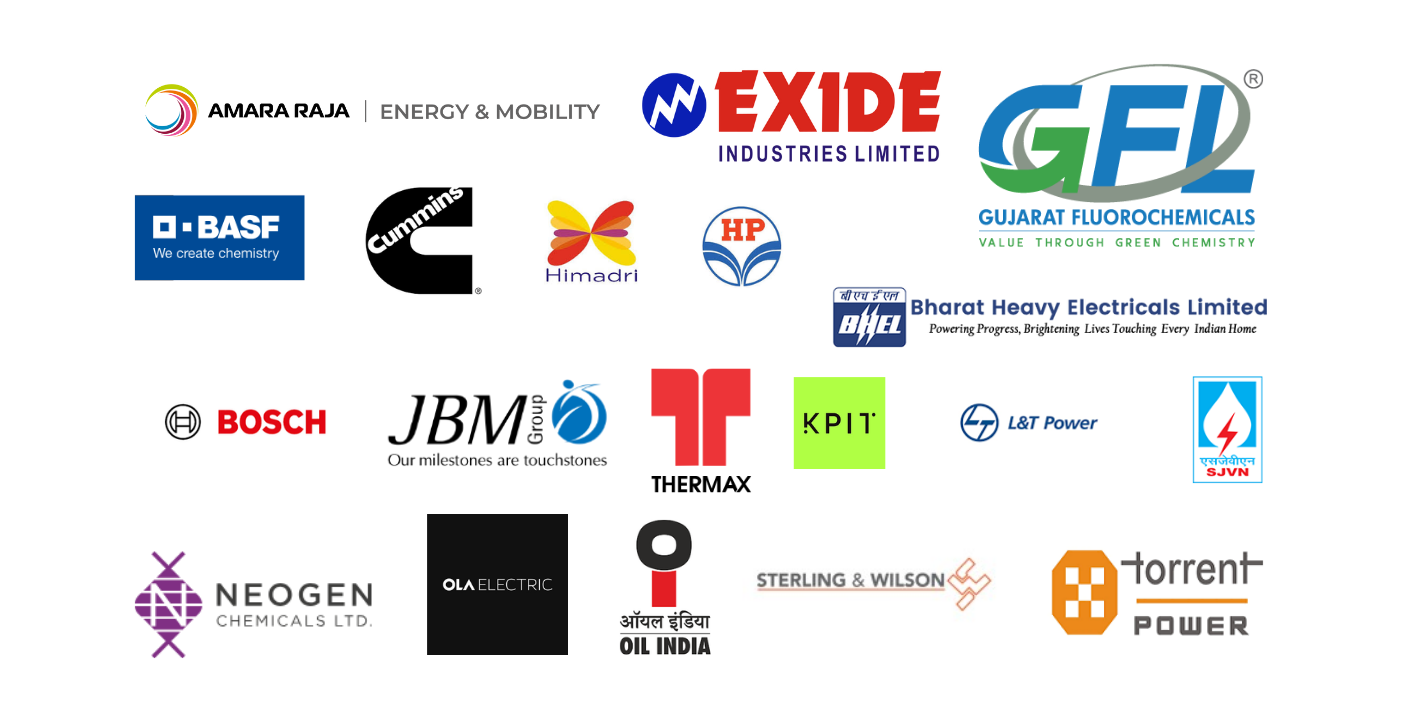
Other players include Elgi Equipments, KSB Ltd, Ingersoll Rand India Ltd., Kirloskar Pneumatic, Shakti Pumps, WPIL, Amara Raja Energy & Mobility Ltd, Eveready Industries, Indo National, HBL Power Systems, Siemens.
Global Developments
A draft proposal, called the “Global Green Energy Storage Pledge”, will be presented at the COP29 Summit as soon as next month. The proposal aims to attain 1500GW of energy storage capacity by 2032 from 230GW by 2022, a six-fold increase. For this ~158 GW of capacity will be needed to be added each year.
Let us now dive into the various energy storage technologies available in India today:
Energy Storage Technologies
In descending order of popularity and usage:
- Pumped Storage Hydro Plants (PSP): This technology is the most prevalent in India right now. Used within the hydroelectric generating system.
- Battery energy storage systems (BESS): BESS technology efficiently stores electrical energy in and releases it according to demand. Some of the commonly used BESS technologies are Advanced Lead Acid, Lithium-ion (Sodium Nickel Chloride NaNiCl2 batteries, and Flow batteries. The BESS segment gained traction, with the Indian government issuing guidelines for an INR 94 billion program to provide viability gap funding of up to 40% for developing 4,000MWh of battery energy storage systems in the coming years.
- Fuel Cell: This technology can be used to supply electricity for a longer time than batteries and is environmentally friendly. These require a cooling system and are very costly to install.
- Hydrogen Storage: Hydrogen gas has the largest energy content (120 MJ/kg) of any fuel, which is about 2.5 times of natural gas. Therefore, a relatively small amount of hydrogen is needed to store significant amounts of energy. However, hydrogen is not naturally available as ready-to-use fuel. Therefore, it is used as a carrier for storing or transporting energy.
Other Technologies:
- Compressed Air Energy Storage (CAES): These are essentially combustion turbines.
- Flywheels: The main applications of flywheel energy storage are transportation, rail vehicles, rail electrification, uninterruptible power supplies, pulse power, grid energy storage, wind turbines etc.
- Thermal Energy Storage
- Super Conducting Magnetic Energy Storage (SMES) System: A superconducting coil that uses magnetic fields to store energy
- Ultra Capacitors: Larger, more efficient than batteries.
Energy Storage Capacities
India started adding energy storage capacity in 2013 with small-scale test projects. Today, energy storage is broadly divided into Pumped Storage Projects (PSPs) and Battery energy storage systems (BESS). As of March 2024, India had 219.1MWh of energy storage capacities. However, this capacity is ramping up as we speak. Out of the 219.1 MWh capacity, 120MWh (40MWh) was added in Q1FY24 alone.
As per the National Electricity Plan (NEP) 2023 of the Central Electricity Authority (CEA), the energy storage capacity requirement is projected to be 82.37 GWh (47.65 GWh from PSP and 34.72 GWh from BESS) in years 2026-27. This requirement is further expected to increase to 411.4 GWh (175.18 GWh from PSP and 236.22 GWh from BESS) in the years 2031-32.
As of March 2024, over 1.6 GWh of BESS projects are under development. The government has issued tenders worth 57 GW and has auctioned 11.5 GW of energy storage projects, with or without renewable energy capacities, as of March 2024. Tenders for standalone and renewable projects with energy storage totaled 7.4 GW in Q1 2024.
The data above shows that India is setting itself up very well in terms of energy storage capacities, given the pipeline of ongoing and upcoming projects.
India Inc. is Raising Massive Capital via Public Markets
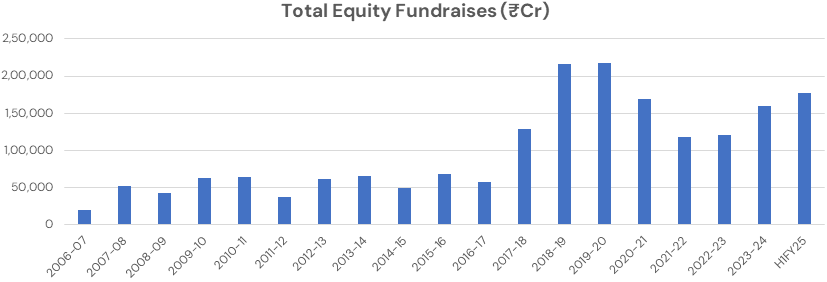
Equity Funding is one of the major funding avenues used by Indian companies to raise capital for their businesses. In India, companies have been raising equity capital for decades, but the trends in recent years warrant us to have a closer look.
Historical Trends in Equity Capital Raises
A brief analysis of equity fundraises over the last ~18 years shows us that equity capital raises have seen a significant pickup post-2017. Notwithstanding a decline leading into the COVID-19 pandemic, the flows have bounced back much stronger and more consistently.
Sources of Equity Capital Fundraising
Among the four routes of equity fundraising, namely (i) QIPs, (ii) IPOs, FPOs, OFS, (iii) InvITs & ReITs, (iv) Preference Shares, QIPs were the 2nd most popular route, raising ₹ 70,836cr in H1 alone, versus ₹71,343 raised in the full year FY23.
IPOs, FPOs, and OFSs are also making records, raising a record ₹81,700cr in H1FY25 vs ₹86492cr in the full year FY23. FY23 and FY24 have turned out to be above-average years for public offerings. FY25 is about to top that.
| Route | H1FY25 (% of Equity Raises) |
|---|---|
| QIP | 40% |
| IPO, FPO, OFS | 46% |
| InvITs/ReITs | 1% |
| Preference Shares | 30% |
QIPs are leading the way
Qualified Institutional Placement (QIP) is a quicker and more efficient way to raise equity capital for listed companies. It removes the need for all the regulatory and procedural requirements that a company needs to fulfill in case of an IPO, FPO, OFS or a rights issue. Here, the company raises capital by issuing equity shares to a select group of institutions, at a predetermined price, among other terms.
Among all routes, QIPs have seen consistent acceptance as a preferred route by listed Indian companies. This is seen in its 3-year rolling average, which has seen a “consistent” trend since FY2008-09. This is significant as the other routes have picked up too, but do not have a trajectory like that of QIPs.
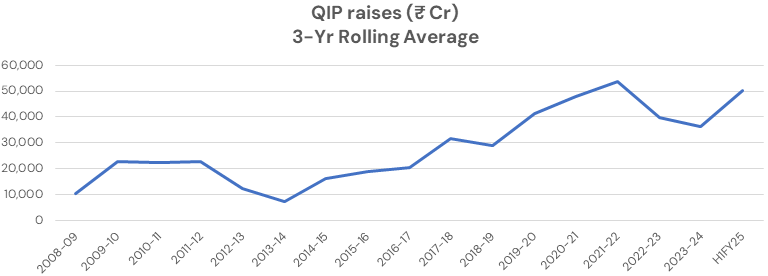
India’s QIP journey began in 2006 when SEBI rolled out regulations for QIPs.
Data from the first half of FY25 is hinting at a record year for equity fundraising in FY25 (especially for QIPs).
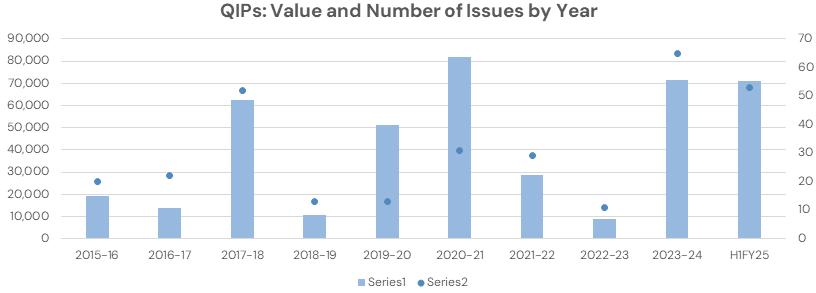
We further tabulated the QIP data along with the total equity fundraises in the secondary market.
| Year | QIP% of total (3-year rolling average) | QIP % of total (Actual) |
|---|---|---|
| FY16 | 33% | 28% |
| FY17 | 37% | 24% |
| FY18 | 33% | 48% |
| FY19 | 26% | 5% |
| FY20 | 26% | 24% |
| FY21 | 26% | 48% |
| FY22 | 32% | 24% |
| FY23 | 27% | 7% |
| FY24 | 25% | 45% |
| H2FY25 | 31% | 40% |
| Median | 29% |
The data suggests the QIPs constituted about 29% of total fundraises under discussion. Now the same metric was 45% in in FY24 and 40% in H1FY25 alone. This is the first ever instance where this metric has stayed above 40% for 2 consecutive years.
What we can infer is that QIPs are gaining an increasing share of the overall fundraising mix and are gaining prominence as a convenient fundraising route for Indian companies.
It also speaks volumes about the confidence of managers of these companies in the stability of the market, funding, and liquidity environment in our country and the economy in general.


