January 2025: Story in Charts, Sector Spotlight & Macro Focus
January 11, 2024
|
India Market Update
LM, EML & LCF were +3.0%, +4.5%, and -0.7% respectively in December vs -2.0% for the NIFTY50. For the calendar year ended 2024, LM, EML & LCF were +54.0%, +29.1% and +25.7% vs +8.9% for the NIFTY50. These results indicate the strength of our Growth strategy and our approach to risk management.
FII selling is driven by high secondary market valuations, while they remain active in the primary market, especially via QIPs. In 2024, they sold Rs 121,210 crore but bought Rs 121,637 crore, netting Rs 427 crore. In December, they sold Rs 2,590 crore but bought Rs 18,036 crore in the primary market, reflecting confidence in India’s long-term growth.
Global Market Update
The US Fed's hawkish shift in mid-December, reducing rate cuts from four to two due to low unemployment and persistent inflation, led to a two-year high in the Dollar Index at 109. The Indian rupee dropped 2.8% in 2024 to 85.6150 per USD, marking its seventh consecutive year of decline. While the rupee fared better than many Asian peers, a weaker rupee worsened the trade deficit and inflation, posing a challenge for India's market and economy.
In this month’s newsletter, we discuss some topics that intrigue us and are worth a long read. We’ll be covering the following topics:
- Markets in 2025 - Story in Charts
- Diagnostics - Bridging the Gap Towards Quality Healthcare
- Budget 2025 - Requires India to step up its Capex
So, let’s begin!
Markets in 2025 – Story in Charts
As we wrap up CY2024, we’d like to take a look at our markets and review the year gone by. A lot has happened in 2024, with the market throwing up countless opportunities and a duet of both pleasant and unpleasant surprises.
Here’s a quick summary of our markets in CY2024:
| Sector | 12M Returns% |
|---|---|
| Pharma | 34% |
| Auto | 25% |
| IT | 24% |
| Realty | 24% |
| Infrastructure | 16% |
| Broder Market | 11% |
| Metal | 11% |
| Energy | 5% |
| FMCG | 0% |
| MCap | 12M Returns% |
|---|---|
| LargeCaps | 15% |
| MidCaps | 22% |
| SmallCaps | 25% |
| Particulars | |
|---|---|
| Number of IPOs* | 91 |
| Number of QIPs | 74 |
| IPO Net Flows (₹ Cr) | 1,90,517 |
| QIP Net Flows (₹ Cr) | 1,19,204 |
| FlI Flows (Net ₹ Cr) | - 3,02,435 |
| DII Flows (Net ₹ Cr) | 5,26,545 |
| FPI Flows (Net ₹ Cr) | 427 |
| Market PE (x) | 26 |
| Market Cap-to-GDP % | 129% |
* excluding SME IPOs
GDP estimates for FY25 and FY26 remain in the 6.5-6.6% range for India, broadly in line with its recent historical averages. However, in good periods, India’s GDP has grown at anywhere between 6.4%-11.4%.
It is important to note that India’s impressive stock market performance is more a function of the higher return on capital generated by Indian firms, rather than GDP growth. In simple words, Indian firms made more profits on each rupee invested – when compared to other countries and its own past performance.
As we enter 2025, we set the tone by evaluating "What we are seeing" in the markets and India's position in a dynamic macroeconomic setup. We'll also highlight key factors likely to influence the markets as they navigate the year ahead.
Presenting our Story in Charts - India in 2025:
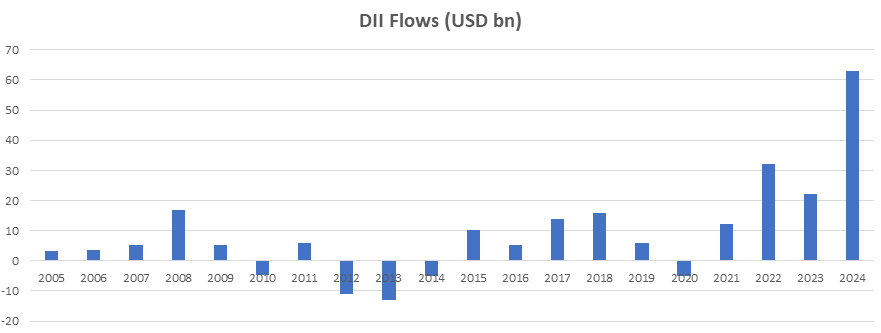
Chart 1: Domestic Flows have kept the markets afloat
In what is an eye-opening figure, the DIIs have never bought more than that in 2024:
Source: National Stock Exchange, stockaxis Research
Domestic Institutions like banks, insurance companies, mutual funds and pension funds generated record buying in Indian equities, at levels never seen before in the history of the markets. This was driven by the trend of increasing “financialization of savings” by Indians, through direct as well as indirect modes of investment into the markets.
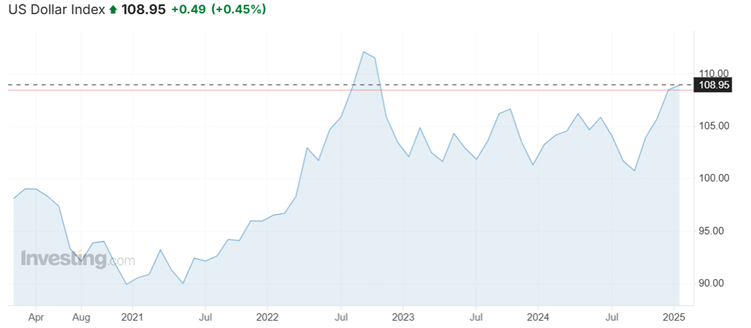
Chart 2: Uncle Sam makes a comeback: - The US Dollar shows renewed strength
Source: Investing.com, data as of 5th Jan, 2024
The Dollar Index, which is representative of the US Dollar, showed renewed strength in 2024, emerging from a 2-and-a-half-year long consolidation that went as low as $100.
This has significant implications for India which can be both positive and negative:
- Flight to Dollar Assets: A rising dollar indicates that global flows are being directed to US$-denominated assets, which means a flight from riskier (deemed) markets like India.
- Indian Equities become more attractive to foreigners: At the same time, foreigners can buy more of Indian assets with the same dollars, which may incentivize further inflows into India.
- Economic Impact: Imports become costlier, which impacts the profit margins of businesses, which in turn slows down economic growth and planned capital expenditure.
- Inflation: The Indian Rupee also weakens with a rising dollar, thus reducing the purchasing power of Indians, and fuelling inflationary pressures in the economy.
With robust domestic flows, India is relatively insulated from the outflow of foreign money, at least in the near term. Furthermore, the RBI has sufficient levers to control inflation via interest rates, and other measures.
Nevertheless, any sharp increase in US Dollar volatility can impact our markets in the near term.
Chart 3: But Indian markets have remained in a secular trend despite dollar volatility
The direction of the US Dollar has never been a concern for Indian investors in the last 17 years. Will this historical correlation sustain? Or are the markets in for a surprise?
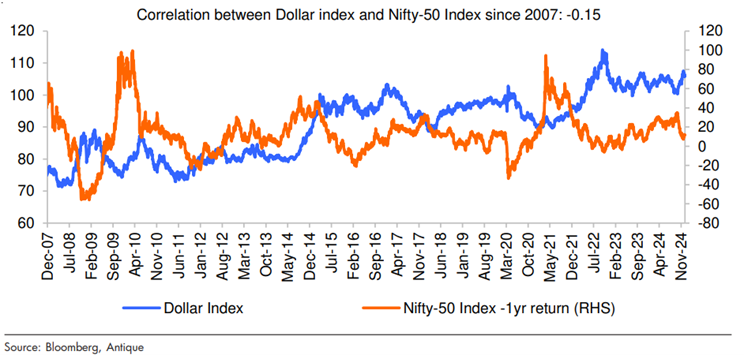
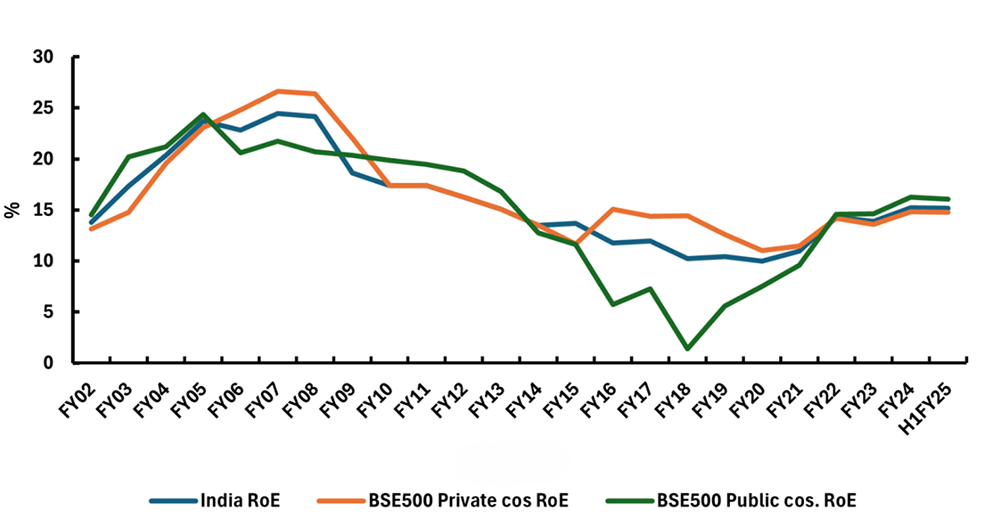
Chart 4: PSUs regain their lost Sheen!
(Source: Nuvama Research)
The gap between public sector companies and private companies’ ROE converged in FY22 and is now at par with the private companies in our market. Can this significant profitability improvement across PSEs indicate a large-scale shift in their operational models?
ChartSet 5: Sectoral Valuations & Outlook
While the broader market is currently trading at a PE of ~26x, sectors like Realty, FMCG, IT, and Pharma are trading at a significant premium to it.
Sectors like Auto, Metals, Energy, and Infrastructure are broadly in line with the broader market valuations, on a relative basis.
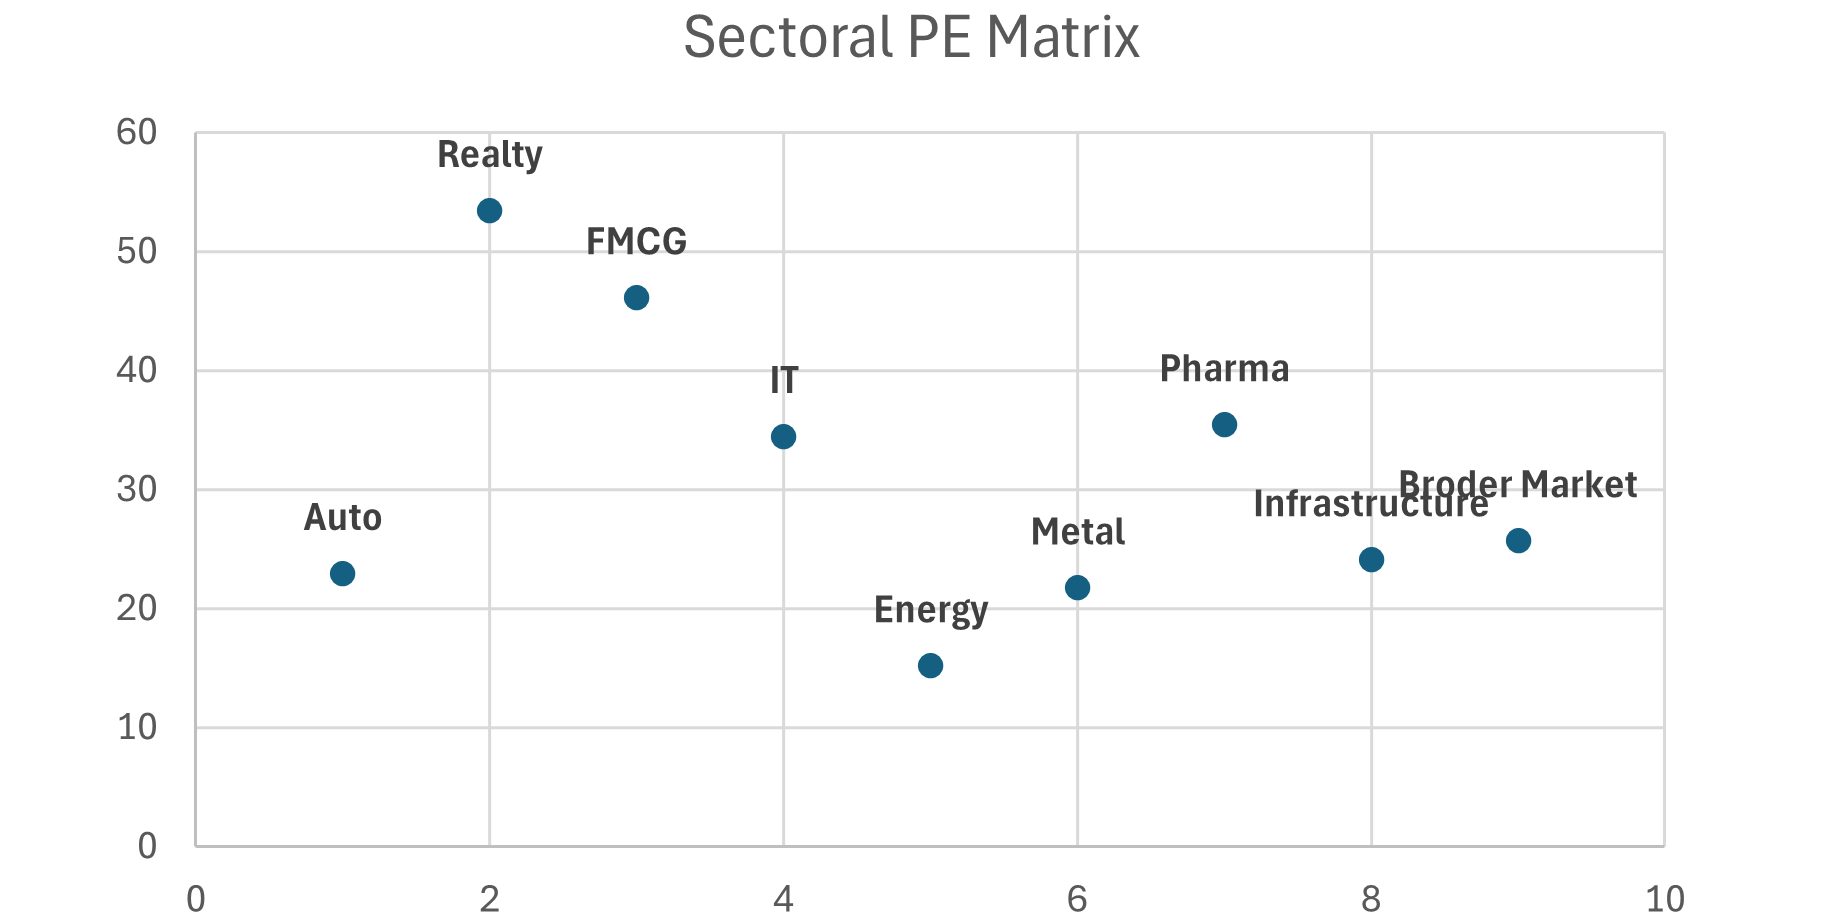
Source: Exchanges, stockaxis Research
Let’s dig down into each of these sectors by examining the sectoral indices, and explore where they are placed in the “earnings growth-valuation” matrix:
Auto
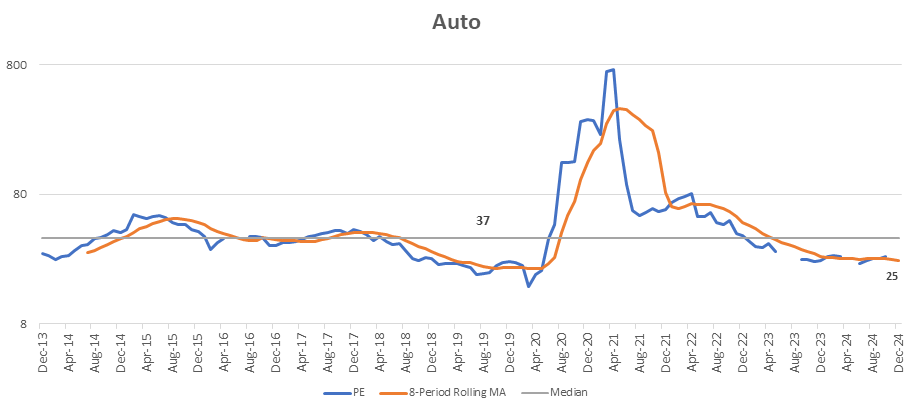
The auto sector has outperformed the overall market over the last two years. Despite this, it currently trades at a PE of 25x, which is well below its long-term median PE of 37x. But is in line with the broader market valutaions.
Real Estate
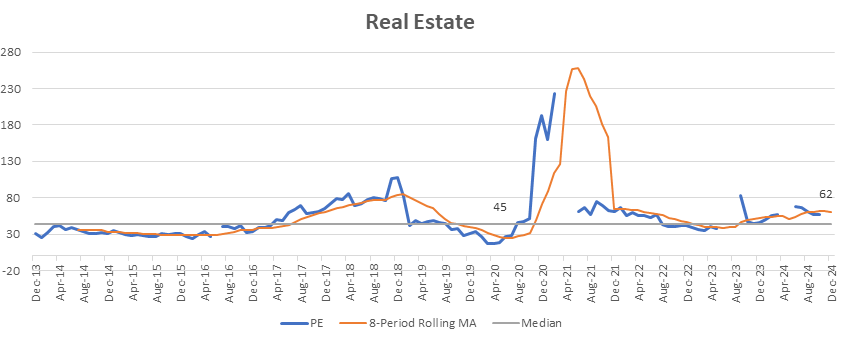
Driven by strong earnings momentum, coupled with impressive stock performance, realty stocks now trade at 62x earnings, above their long-term averages. A strong earnings outlook for FY25-27e bodes well for the sector.
Fast Moving Consumer Goods (FMCG)
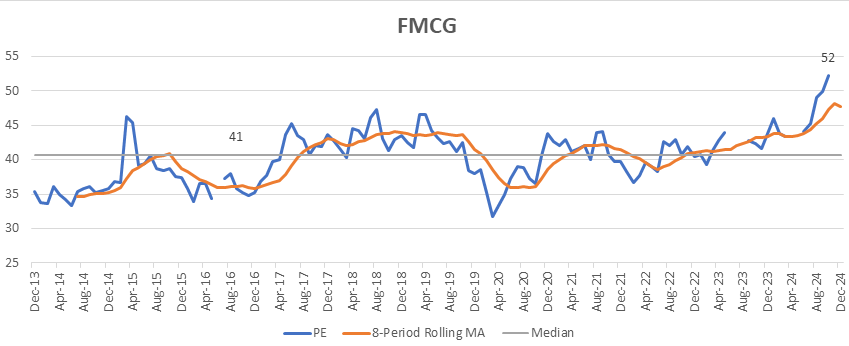
FMCG stocks are have traded at the premium to the market historically, and that trend seems to continue. With a moderate earnings outlook, the case of further rerating seems difficult. Select names can perform well.
IT
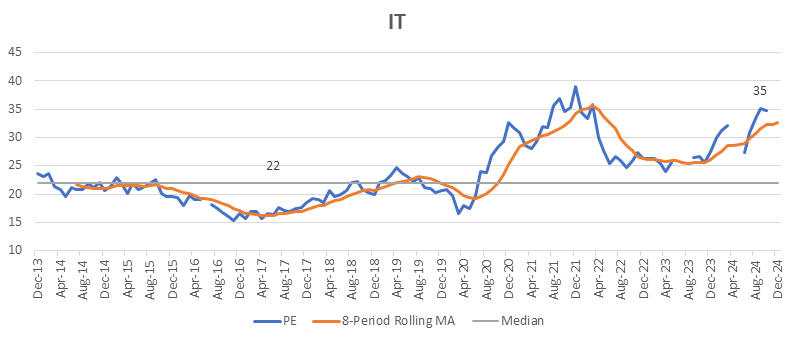
The IT sector currently trades at a forward P/E of 32x (FY25e), significantly above its 5- and 10-year averages of 25x and 21x, respectively. With the sector up 25% YTD, valuations near all-time highs, and a moderate earnings growth outlook, we remain neutral on the sector. Again, select names may outperform.
Energy
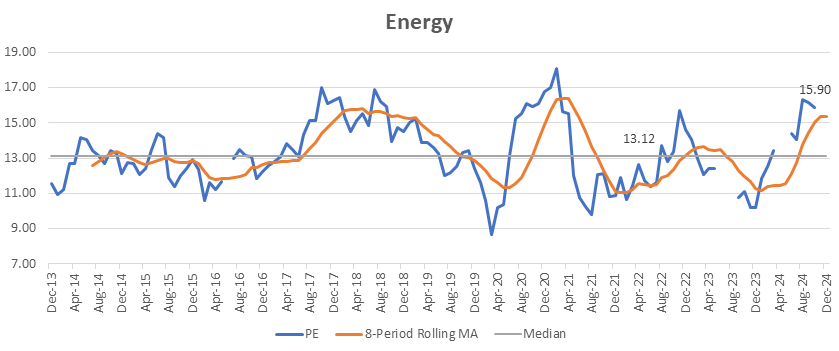
This sector is trading in its historical range, around it long-term averages. Being a cyclical sector, it is important that one remains cautious and extremely stock-specific.
Capital Goods
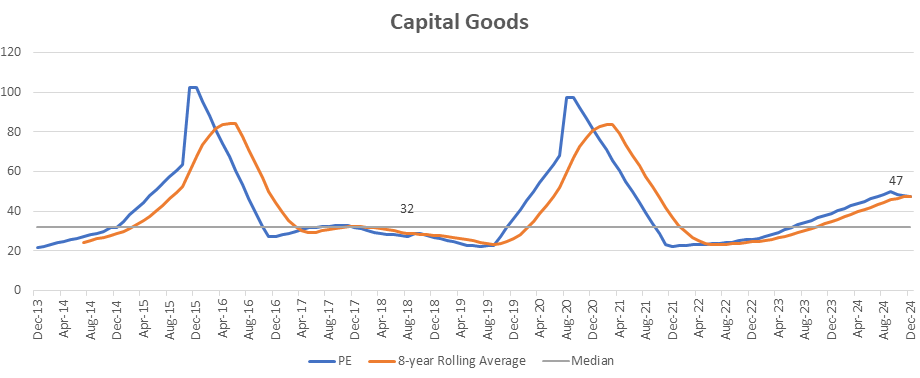
The sector trades at a multiple of 47x, significantly above its 10-year median of 32x. However, this is supported by the possibly the best sectoral earnings growth outlook for the next 3 years. (Source: Bloomberg consensus estimates). History has shown (as seen in the chart by two distinct upcycles), that rerating in capital goods can be particularly strong, when in force. Orderbook and capex execution would be the key monitorables here.
Metals
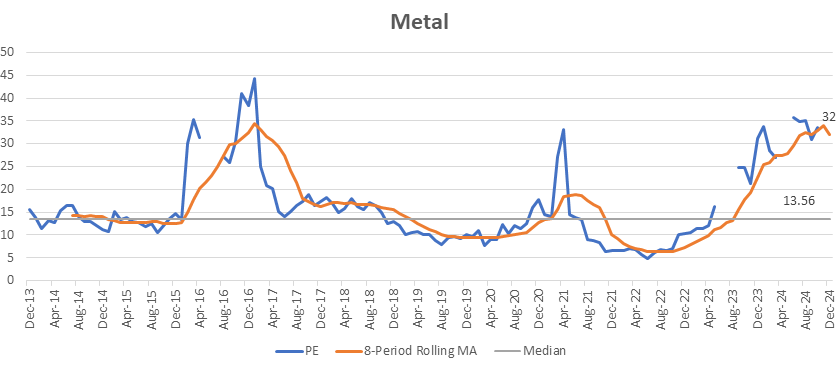
The metals sector is trading at a valuation of 32x, which is significantly higher than its median PE of 14x. With moderate growth expectations and a stable outlook, the view on this sector is neutral.
Pharma
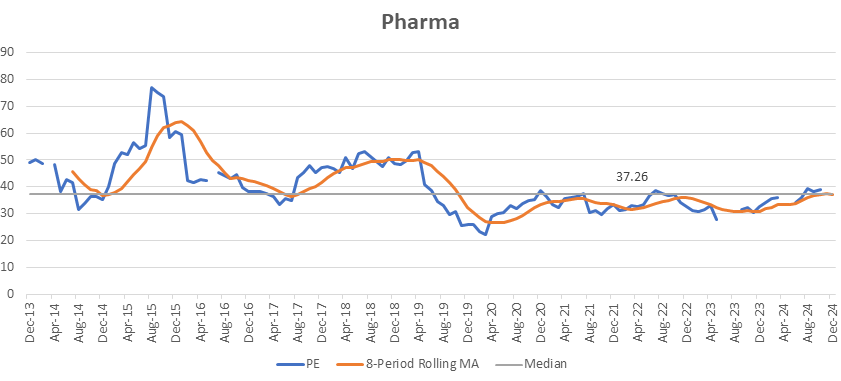
This sector is trading around its long-term median PE of 37x, which makes it fairly valued on a standalone basis. With the USFDA inspections and supply chain woes now abating, the prospects for this sector now look bright. We remain optimistic about this sector.
Infrastructure
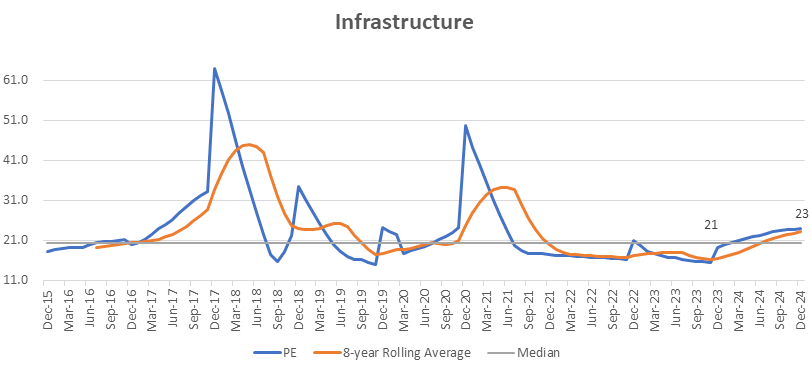
The infrastructure sector currently trades in line with its long-term median PE, which makes it fairly valued. With growth expectations ranging from high-single-digit to mid-teens, this sector should churn out some potential re-rating candidates, in case of positive developments and the consequent revision of estimates.
Private Banks
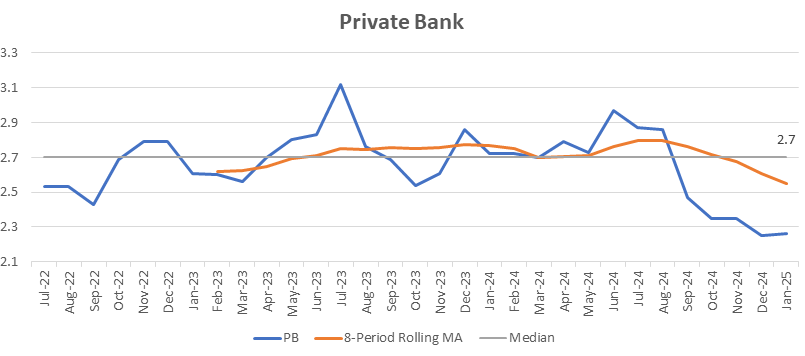
The private banks are trading at a discount to their long-term median Price to Book ratio and its 8-period rolling moving average, indicating an undervaluation region. Loan growth is expected to moderate to 12-13% in FY25 from a peak of 15-16%. Profitability is expected to remain rangebound but around all-time highs. Consequently, earnings growth estimates predict moderate growth for the sector. The case for rerating in select stocks can be made. Near term risks include rise in credit costs driven by unsecured loans, and stress in the banks with MFI books.
PSU Banks:
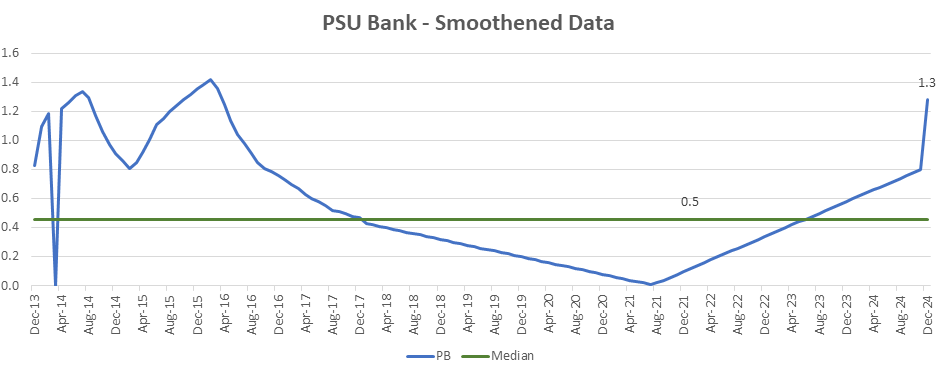
The PSU Banks sector has historically been shunned, but this changed post the Covid-19 pandemic, as PSU Bank stocks delivered stellar returns. However, the valuation gap remains evident, both on a standalone and on a relative basis (vs pvt Banks).
Overall, for the banking sector, select large cap private banks and PSU banks look attractive, basis their earnings and valuation outlook.
Diagnostics – Bridging the Gap Towards Quality Healthcare
Introducing Diagnostics
What is it?
Diagnostics in healthcare involves identifying diseases or conditions through various tests, evaluations, and tools to guide the treatment. It encompasses several types, including radiology (e.g., X-rays, MRIs, CT scans) and pathology (e.g., blood tests). There are other kinds of tests as well, but these two are the most prevalent in India.

Why is it in the spotlight?
Being the most populous country in the world, the demand for healthcare is going to be perennial. Additionally, government schemes like Aayushan Bharat and the National Health Mission are expected to democratize access to affordable healthcare in India.
Diagnostics is Under Penetrated in Non-Metros
The extent of under penetration of diagnostic services in India can be understood by the following statistics:
- Only 30-40% of the rural population has access to diagnostic services in India. This is drastically low, given that ~65% of India’s population resides in the rural areas.
- Non-metro regions accounted for 85-90% of the total tests.
- Tests per 1,000 stood at 1,500-2,000 per 1,000 population for metros, and 550-600 tests for non-metros.
Diagnostics is now seen differently - Not Curative but Preventive
A significant transformation in healthcare is currently underway, shifting the focus from curative measures to diagnostics. The Indian government, alongside healthcare enterprises, is actively advocating for preventive healthcare, with diagnostics playing a crucial role in the early identification and intervention of health issues, often before symptoms manifest. With 65% of the Indian population under the age of 35, lifestyle changes and genetic factors have increased their susceptibility to non-communicable diseases (NCDs). Consequently, diagnostics and early detection are essential for their health and well-being.
The advantages of early detection are well-documented, including (I) enhanced treatment outcomes, (II) decreased healthcare expenses, and (III) the empowerment of individuals through accessible health status information via affordable diagnostic services.
Whenever a patient consults a physician, they are first referred to take a test. This simply illustrates the joint requirement of diagnostics, medical consultation, and medical drugs.
Key Developments in the Diagnostics Space
Expansion, Consolidation, & Capacity Creation – The pursuit of scale
The COVID-19 situation has invigorated the pace of consolidation in the diagnostics sector. Not only did it induce demand for rapid and convenient testing, but it also resulted in the policymakers realizing the importance of diagnostics and preventive healthcare as a discipline within the healthcare space.
Since the pandemic, this sector has been synonymous with high levels of activity, including new mergers and acquisitions, entry of new players (both small and large), and outright acquisitions by large hospital chains across the country.
The pandemic went by, but it left behind a more resilient industry, that had adopted itself to the “new normal” and new ways of doing business. Diagnostic companies became more agile and revamped their business models to adapt to the prevailing environment.
“A prominent theme that emerged from this is the larger players acquiring standalone entities and expanding geographic presence through those acquisitions.”
Additionally, there is massive scope for integrating standalone diagnostic centres into national and regional diagnostic chains, which have a strong presence in cluster-based target markets. This is good since it will boost the overall operational efficiency of the units due to integration benefits.
Summary of major Acquisitions in the post-pandemic era:
| Buyer | Target | Acqn Date | Consideration (₹ Cr) | Comments |
|---|---|---|---|---|
| Dr. Lal PathLabs | Suburban Diagnostics | Oct-21 | 1,150 | |
| Vijaya Diagnostics | Medinova Diagnostics | Jun-24 | 15 | First acquired in Mar-2014 |
| Vijaya Diagnostics | PH Diagnostics | Dec-23 | 135 | |
| PharmEasy | Thyrocare | Jun-21 | 4,546 | 66% stake |
| Thyrocare | Polo Labs | Jul-24 | 4 | |
| Metropolis | Hitech Diagnostic Centre | Oct-21 | 636 | |
| Metropolis | Core Diagnostics | Dec-24 | 247 | |
| Fortis Healthcare | Agilus Diagnostics | Dec-24 | 429 | 7.6% stake |
| Krsnaa Diagnostics | Apulki Healthcare | Sep-24 | ? | 30-year exclusive partnership for cancer diagnostics |
| Suraksha Diagnostics | Future Medical and Research Trust | Mar-20 | ? |
Source: Public Sources, stockaxis research
Large-cap companies in both the healthcare and non-healthcare space have also taken an interest in the sector. For example, Lupin Ltd. has ventured into the sector via Lupin Diagnostics, Reliance through Reliance MedLabs, Torrent Pharma via Torrent Diagnostics, Adani Enterprises via Adani Health Ventures Pvt. Ltd. Other competitors include Tata 1mg and Reliance’s Netmeds who sell diagnostic tests online.
Several companies in the sector have resounded plans to expand capacity via the inorganic route, such as Dr. Lal Path Labs and Krsnaa Diagnostics.
Hospital Chains like Apollo Hospital Enterprises and Max Healthcare Institute and Fortis also have sizeable network of diagnostic centres (2203, 900, and 4085 touchpoints respectively).
Multi-channel pharmacies like MedPlus have also ventured into this space.
Hence, the common goal across most companies in the sector is to expand their presence and thereby gain scale.
Today, the diagnostic centre capacity in India is divided into three major categories of providers:
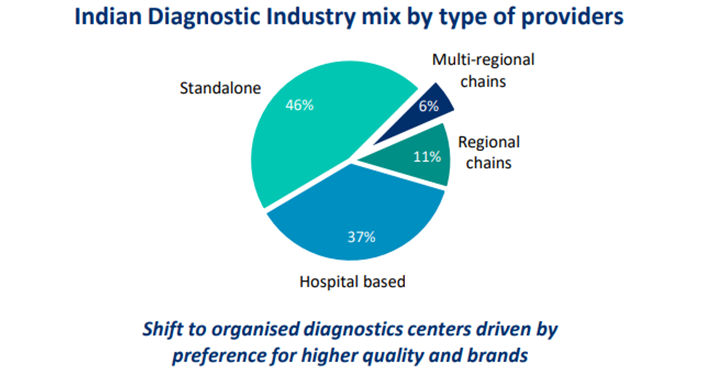
(Source: Industry Reports, stcockaxis research)
As the industry gets increasingly organized, the share of diagnostic chains is bound to rise.
Emerging Trends in Diagnostics
- Novel technologies in testing: The last few years have witnessed the emergence of newer technologies in diagnostics, like: Molecular Testing, Genomic Testing, Flow cytometry, Genetics (NGS), Digital Pathology & AI, Histopathology & IHC Markets, etc.
-
More Agile operational models: Both the COVID-19 pandemic and the consolidation in the industry have prompted diagnostics businesses to adapt more efficient operational models.
Some of the prominent ones are:
- Pay-per-use model: Usage-based pricing of testing and/or equipment services.
- Rental Model for Testing Equipment
- Distribution & Logistics: Involves efficiently managing and distributing diagnostic equipment, reagents, and supplies. New distributional approaches may include hub-and-spoke models, franchise arrangements, or partnerships with local labs to ensure widespread access and timely delivery of services
- Partnership models: Strategic partnerships between diagnostics companies and healthcare technology companies to offer more agile services with lower turn-around times.
- Telemedicine and Teleradiology: Telemedicine in India enables remote consultations, improving healthcare access, especially in rural areas. Tele-radiology allows radiologists to interpret images remotely, speeding up diagnoses. Both services are growing with better internet and mobile access, enhancing healthcare in underserved regions.
- Health and Wellness Packages: An increasing number of companies are offering bundled health and wellness packages to their customers, which have higher average selling prices (ASPs).
- Partnerships and Collaborations: Tie-ups between diagnostic and health care - technology companies are gaining traction over the recent years. This may include the integration of services across several steps in the value chain.
Budget 2025 requires India to step up its Capex
What do we mean by CapEx?
Capital expenditure, or “CapEx” - is the money a company or an economy spends on acquiring, upgrading, and maintaining its strategic assets used for commerce and industry (i.e., business or economic activity).
Like any business, the economy requires capex to set up long-term assets to manufacture goods and services. It also requires investments in assets like (i) Public infrastructure, such as roads, railways, and ports, and (ii) Utilities, such as power transmission grids and water supply networks.
Hence, we can broadly classify a country’s industrial capex in two distinct heads:
- Public Capex/Government Capex: Capex incurred by the Central and State Governments, & Public sector companies.
- Private Capex: Capex incurred by private enterprises, ranging from the smallest of businesses to the largest of conglomerates.
Now, coming to the topic at hand:
Why does India need more capex to support GDP growth?
In the July–September 2024 quarter, India's real GDP growth fell to a seven-quarter low of 5.4%, well below even the most pessimistic independent forecasts. In Q1FY25, it had grown at 6.7%, down from 7.8% in Q4FY24. Some economists have quoted the recent prints as “weak growth” and “disappointing.
Now, this was attributed to a weak corporate earnings scorecard by India firms in H1. However, a more fundamental reason is related to capex:
The growth in capital expenditure is one of the fundamental factors influencing GDP growth.
Please refer to the chart below:
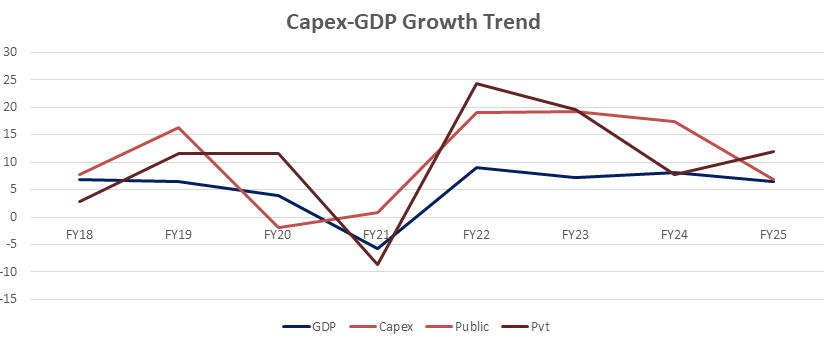
As seen in the chart above, GDP growth moves in tandem with the growth in public and private sector capex. There appears to be a slight lag between the two. It must be noted that there is no perfect correlation, but a sense of direction can be ascertained based on the capex trends.
An official from the Finance Ministry has quoted that a ₹1 spend on public capex by the government leads to a ₹3 increase in GDP. Whether this metric works as per textbook definition is worth assessing. However, the core message here is to highlight the importance of linkage between GDP growth and Capex.
Capex Outlook
In the previous budget of FY24-25, the allocation towards infrastructure capex stood at ₹ 11,11,111 crore, marking only an 11.1% increase over the previous year. This figure has grown at approximately 30% each year in FY2021, FY2022 and FY2023.
With this in context, experts say that the government must now increase this allocation by at least 30% in the upcoming budget, to make up for the lost ground on the GDP growth front. This includes expenditure on Renewables, Transmission & Distribution, Ports, and Airports, among others.
On the private sector front, the expectations are that capex should pick up reasonably well towards the 2nd half of FY2025.
Experts have suggested an increased adoption of dedicated PPP (Public Private Partnership) projects in the upcoming budget, for a more efficient implementation of Capex.
Conclusion
The recent fluctuations reflect short-term factors rather than fundamental issues. India’s growth trajectory is long-term, and the market is expected to stabilize, presenting discerning investors with opportunities to acquire high-quality companies at more favorable prices.


