February 2025: Sectoral Take, Economic Lens, and Empirical Analysis
February 11, 2024
|
Note to the Investors
Intense selling pressure from Foreign Portfolio Investors (FPIs), coupled with a lack of indications for a rebound in urban demand and private sector capital investment and instability instigated by the Trump administration has led to a significant decline in the broader market, as valuations appeared excessively high. The aggressive selling by FPIs transformed a positive market trend into a negative one. During this downturn, cyclical sectors were particularly affected, and at times, the selling became indiscriminate, resulting in collateral damage. Nevertheless, most of the excesses within the system have been addressed. As market stability returns and the earnings season distinguishes between successful and underperforming businesses, we are optimistic that many of our investments will experience substantial recovery.
We view this as a significant correction, not the start of a new bear market. The current environment favors buying on dips. India’s narrative remains strong post-Union Budget 2025, which included no negatives and many positives, like fiscal discipline and cuts in non-essential spending. The budget effectively tackles urban demand slowdown with substantial personal income tax cuts. We remain optimistic about the market opportunities that present themselves to us. While most price adjustments may have already occurred, another round of consolidation cannot be negated, if negative global news persists.
Additionally, we would like to emphasize that we are trend followers, aiming to maintain our investment ideas for as long as the trend persists. In retrospect, our miscalculation was not exiting our positions when we had substantial gains, and we underestimated the depth of the correction that occurred once it was initiated. We are currently reevaluating our strategies to implement more robust safeguards aimed at optimizing our profit-taking in the future. It is advisable to book profits as they are generated, given the unpredictability of future market corrections or bear markets. We secured a significant portion of the gains in this market correction.
Thank you for your continued trust in us.
In this month’s newsletter, we discuss some topics that intrigue us and are worth a long read. We’ll be covering the following topics:
- Are 2 Wheelers at an Inflection Point?
- Economic Survey 2025 - Key Insights
- Analysis of Drawdowns in Nifty Indices
So, let’s begin!
Are 2 Wheelers at an inflexion point?
The story of India’s 2-wheeler revolution has been remarkable. Popular models like the Bajaj Chetak and brands like Hero Honda were concepts that gave impetus to this revolution – the one of upgrading the standards of mobility of the Indians.
India’s large population, along with almost one-thirds of that falling under the middle-class category makes it a large market for discretionary goods like 2-wheeler autos. Like any other automotive product, 2-wheelers have historically been representative of the “aspirational Indian”, and still are, to a large extent.
During the times of the Bajaj Chetak, having one symbolized a lifestyle upgrade. Today’s Indian consumer is different - he is more affluent, has more options, and aspires for a premium offering, if made available at the right price point (even if it means paying slightly more).
The 2-wheeler market witnessed a difficult 3-4 years between 2018 and 2022, where it saw significant a deceleration as well as de-growth in sales volumes, marred by softer rural demand and weak consumer sentiments.
We believe that this space has some interesting developments shaping up, that are worth taking note of, as we collectively evaluate emerging investment opportunities in our market.

In this article, we explore the recent developments in the Indian 2-wheeler space and try to makes sense of data as it comes to us. We also explore the competitive landscape, evaluating the recent performance of the key players.
So, let’s dive in!
The industry is surpassing its peak growth rates
The new year of 2022 didn’t look quite encouraging for the domestic two-wheeler industry, as almost every 2-Wheeler automaker in the country reported a year-on-year degrowth in sales. In January 2022, most 2-wheeler companies reported a year-on-year degrowth in their sales.
This was majorly due to issues like semiconductor shortage (which was troubling the entire automotive space at that time), price hikes, volatility in crude prices, supply chain issues, and the risk-averse attitude in the post-pandemic period.
The downturn in automotive 2-wheeler sales was even more brutal in the 2-2.5 years preceding 2022. However, 2022 seemed to mark the end of this difficult period, and growth has only picked up from there since then.
Refer to the chart below to get a visual representation of the same:
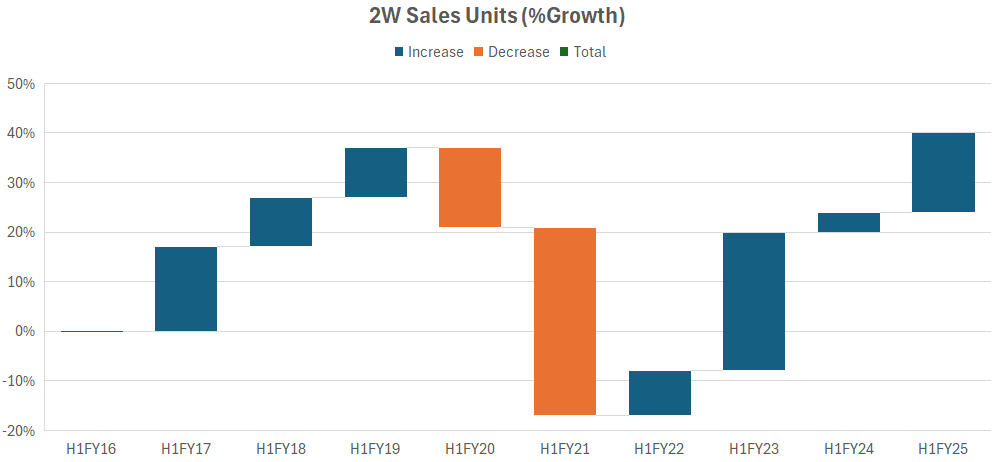
A chart showing the growth trajectory of 2-wheeler sales, through the period of declining growth and into the phase of sustained recovery.
Company Specific Updates
Fast forward to 2025, the industry is in much better shape, thanks to the easing of supply chain shortages and a sustained bounce-back in rural demand.
Here are the latest updates with the top companies in this space:
Hero MotoCorp (Revenue: ₹ 40,098cr, MCap: ₹85,387cr, ROE%: 22%, ROCE%: 29%)
- Hero MotoCorp anticipates a big rebound in two-wheeler (2W) sales in rural India over the next four to eight quarters, driven by favourable factors such as a decent monsoon, rising crop prices, improved employment conditions, and increasing consumer confidence, its Chief Executive Officer (CEO) Niranjan Gupta in a recent interview.
“They (2Ws) are not seen as goods or luxury goods. They provide mobility to the masses in India. They also help generate a lot of direct and indirect employment”, he mentioned during a media roundtable. All other major companies like Honda and Bajaj are also calling for a lowering of GST rates on two-wheelers in India.
- The positive commentary from the market leader states that there are definite signs of green shoots, indicating a possibly significant pickup in product offtake in the forthcoming quarters.
Bajaj Auto (Revenue: ₹ 49,903cr, MCap: ₹2,49,760cr, ROE%: 26.5%, ROCE%: 34%)
- Bajaj Auto recorded highest highest-ever quarterly sales in the 125cc+ segment in Q3FY25.
- The company expects the 2wheeler industry to grow by 6%-8% in the near term, with the 125cc+ segment outpacing the 100cc segment.
- Its export sales units were the highest in 9 quarters. Export guidance is optimistic and is expected to exceed 20% in the near term.
- EV Revenue share now stands at 22%, the green energy portfolio (Electric and CNG) accounts for 44% of revenue.
- The company plans to launch 9 new models between Dec-24 and Mar-25.
- Its Spares business crosses the ₹1,500cr revenue mark.
TVS Motor Company (Revenue: ₹ ₹42,866cr, MCap: ₹1,25,486cr, ROE: 26.6%, ROCE:15 %)
- TVS became the No. 1 player in the 2W space in volumes, for the first time in December 2024.
- EV sales showed very promising growth during the quarter, growing by 58.3% YoY and 1.3% QoQ to ~76,000 units. TVS remains confident of EV adoption, alluding to higher demand for EVs, declining cost of ownership of EVs, digital first technologies, and support from multiple government bodies.
- Most international markets displayed healthy growth for TVS, showing consistent MoM growth and healthy demand.
Ola Electric (Revenue: ₹ 5,010cr, MCap: ₹32,636cr, ROE: 26.6%, ROCE:15 %)
- In Q4FY25, Ola Electric’s market share dwindled to 23% from a peak of 49% in the first quarter of FY25 but recovered to 25.8% in January 2025 from a low of 19% in December 2024.
- New Launches: Ola Electric launched 8 new scooters under its S1 Portfolio under the name of “Gen 3”, which will target a wide spectrum of mass-to-premium segments.
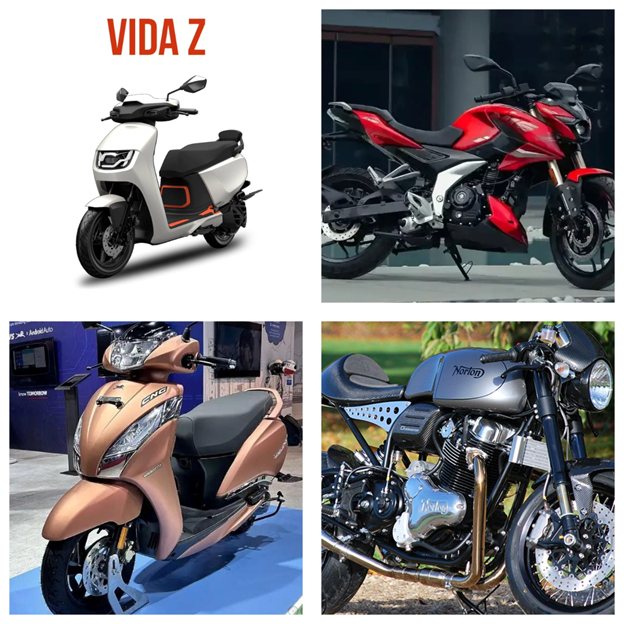
New Launches Galore!
We also noticed an industry-wide increase in new product launches and new launch announcements.
Hero MotoCorp plans to launch 5 models in the upcoming year, while Bajaj Auto plans to launch 5 new Chetak scooters in the coming months. TVS also has an exciting product pipeline lined up, with the recently launched TVS Jupiter CNG model, Jupiter 11, and the upcoming Norton Motorcycles in FY26. Ola Electric has launched its own family of S1 Gen 3 electric scooters, becoming among the early movers in the industry to launch this year.
CNG models are also now beginning to see traction in the Indian 2-wheeler market, after making their mark in PVs and SUVs space. Both TVS and Bajaj Auto have launched CNG models in their respective scooters this year. (Bajaj’s Freedom 125 CNG and TVS Jupiter CNG). While other players are yet to launch their CNG models, we expect CNG models to see the same traction as in the case of 4-wheeler cars going forward.
The tale of Two leaders: Hero vs Bajaj
Hero MotoCorp and Bajaj Auto are by far the oldest and the largest companies in this industry. Hence it makes sense to understand them well before we move forward.
How do the top 2 companies fare when compared like-for-like?
| Particulars | Hero MotoCorp | Bajaj Auto |
|---|---|---|
| Revenue (₹ Cr) | 40,098 | 49,903 |
| Profit After Tax (₹ Cr) | 4,133 | 7,534 |
| Sales Volumes (Q3FY25) | 14,63,802 | 10,54,621 |
| Volume Market Share (CY24) | 29% | 11.60% |
| Market Cap (₹Cr) | 85,744 | 2,48,717 |
| Export Sales Volume (Q3FY25) (in units) | 4,66,766 | 72,470 |
| Top Model |
|

|
- Bajaj Auto’s profit after tax stood at ₹7,534cr, which is nearly 1.8x that of comparable Hero MotoCorp.
- Hero MotoCorp dominates the domestic 2-wheeler market in terms of units sold. It is also known for its dominance in the <125cc segment, while Bajaj Auto’s strength lies in other segments and a strong export business.
- Both Hero MotoCorp and Bajaj Auto are significant players in the EV segment. In fact, both of them have made massive market share gains over the last year.
- While Hero MotoCorp itself commands only 1% share of the EV market, it owns about 39% stake in Ather Energy, a popular name in the space that commands an impressive 14% share.
Business Trends, Competition & Key Takeaways
In an analysis of the key trends in the 2-wheeler markets, we found certain interesting observations that were worth putting forth. Here’s the list of key takeaways from our study:
Takeaway 1: Q3FY25 saw the industry grow its sales units by 12.4% YoY.
Only one company outperformed the industry – Eicher Motor, which grew by an impressive 19.4% YoY. TVS also performed well, and made market share gains even though it underperformed the industry during the quarter! On the other hand, both Hero and Bajaj saw muted growth. Refer to the table below: -
Q3FY25 Sales growth (%YoY growth in units):
| Company | %YoY |
|---|---|
| Royal Enfield | 19.4% |
| TVS | 10.1% |
| HMSI | 8.7% |
| Bajaj | 1.4% |
| Hero | 0.3% |
| India Yamaha Motor | -2.0% |
| Industry | 12.4% |
Takeaway 2: Exports are leading the charge for the 2W makers.
Q3 Exports Sales growth (%YoY growth in units)
| Company | %YoY |
|---|---|
| Hero | 57.4% |
| Bajaj | 21.3% |
| TVS | 25.9% |
| HMSI | 37.7% |
| Royal Enfield | 106.2% |
2-Wheeler company exports have shown remarkable growth recently. In the third quarter of FY2025, all major 2-wheeler companies saw export growth exceeding 20%. This impressive growth trend was also observed throughout the CY24.
In a recent public appearance, Union Minister Shri Nitin Gadkari said that India’s 2-wheeler export market has a lot of potential. Quoting figures, he said that 50% of the motorcycles produced in India are exported.
Takeaway 3: Multiple Contenders for the top spot in EVs
The race of EVs is even more interesting in 2-wheelers than in other segments. With quicker adoption and time-to-market, EVs have seen massive traction in 2-wheelers.
While Ola Electric, an E-2Wheeler startup founded by Bhavish Aggarwal has already made a name for itself in the industry, companies like TVS, Bajaj, and Hero have already upped their game to capture significant market share for themselves.
| Market Share | Oct’24 | Nov’24 | Dec’24 | Jan ‘25 |
|---|---|---|---|---|
| OLA Electric | 30% | 24% | 19% | 25% |
| TVS Motor | 22% | 23% | 23% | 24% |
| Bajaj Auto | 20% | 22% | 25% | 22% |
| Ather Energy | 12% | 11% | 14% | 13% |
| Hero MotoCorp | 5% | 6% | 1% | 2% |
At the same time, EV startups like Revolt Motors (Rattan India), Ultraviolette, and Ampere by Greaves are challenging legacy manufacturers like Hero and Honda.
The EV market is distinctive, owing to its differentiated design and performance experience as compared to traditional ICE models. Its growth trends are indicative of the elevated traction that the EV models are witnessing in the market. The cost of an EV is expected to close in on that of its comparable ICE counterparts, and this will result in elevated demand for the same in the coming years.
Takeaway 4: In a space dominated by Royal Enfield, new competition is lining up.
Eicher motors-backed Royal Enfield dominates the 350cc+ segment in India currently. Challenging its dominance, new competition has lined up in the form of:
- New entrants: Classic Legends (backed by Mahindra & Mahindra), and
- Existing Brands like Triumph and Harley Davidson, are partnering with Bajaj Auto and Hero MotoCorp.
Conclusion
The recent developments in the 2-wheeler markets are encouraging, with signs of green shoots emerging. Will this momentum sustain? – Only time can tell.
Industry experts and ministry officials have maintained a broader tone of encouraging this well-established ecosystem to dream bigger and to pursue opportunities like the export markets (such as Africa and LATAM, among others) to drive growth for itself. Even now, the story of India’s 2-wheeler market remains an intriguing one!
Economic Survey 2025 – Key Insights
Setting the Background
With the Union Budget 2025-2026 now presented, the stance of the Government for the upcoming year is now loud and clear:
- To encourage core sectors of agriculture, power and mining.
- To boost the Startup and MSME ecosystem in the country
- Invigorate private sector investments,
- To enhance spending power of India’s rising middle class.
- Specific policies for Insurance, Electronic Goods, Pharma, and Shipping.
Some may call the budget a populist one, but it might be something that India really needed at this stage of its growth.
The Indian Economic Survey
Each year, the Government of India, along with other financial bodies like the Ministry of Finance and the Reserve Bank of India, puts out an assessment on the current state of the Indian economy, in context of a dynamic global setup. This becomes extremely crucial to understand, as we navigate our ever-evolving, dynamic yet intriguing financial markets.
In this article, we try to make sense the Indian Economy from the “National Economic Survey” published by the Government (with the Union Budget in hindsight), to get a sense of where the economy stands, and how it’s positioned as it moves into FY26 and beyond.
Amidst the deluge of information provided in the survey, we found a specific section particularly intriguing. And that is what we’re going to focus on in this article.
So, Let’s Begin!
As per the survey, India’s economic engine has continued to fire well, even amidst several global uncertainties. This statement is not a hollow remark, but rather a fact backed by solid data. Going a level lower, the survey breaks down the economy into its core sectors, and then maps their respective trajectories to get a sense of growth. How interesting! right?
The survey reiterated the fact that India’s GDP growth remained in line with its historical averages, especially its decadal average, as seen in the chart below:
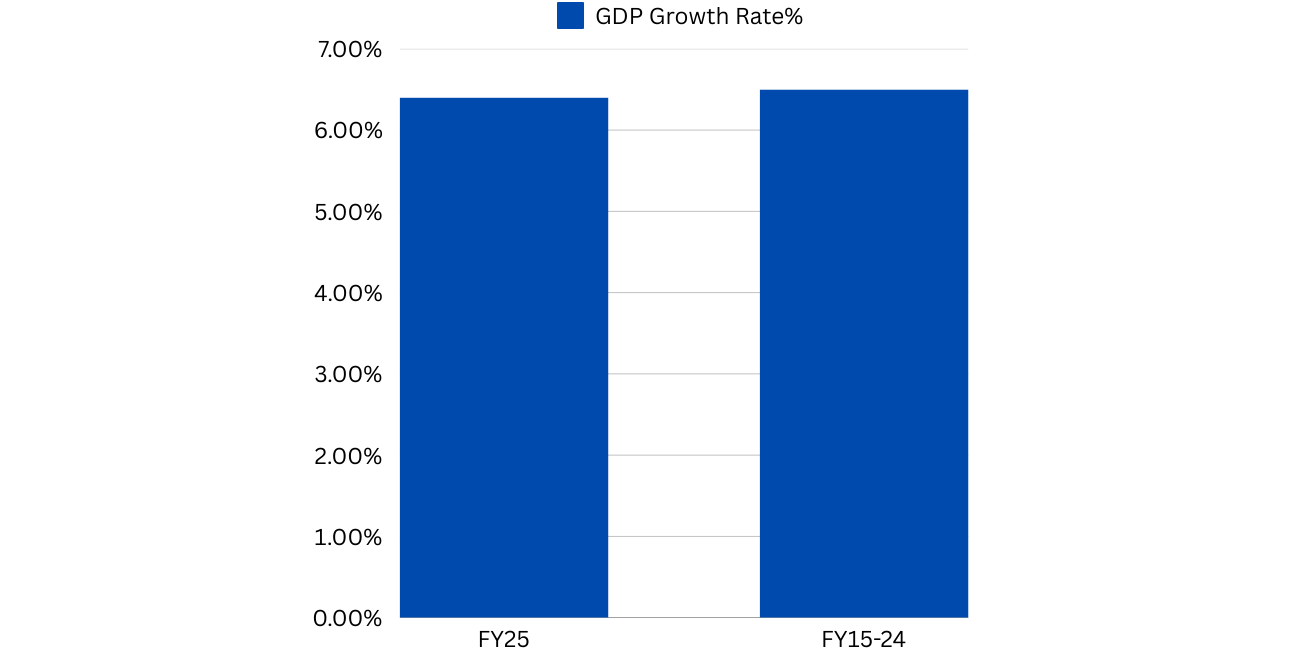
For FY25, real growth in GDP was officially estimated at 6.4%.
While everyone was focused on the recent GDP slowdown news, we forgot to notice the uptick in Consumption!!
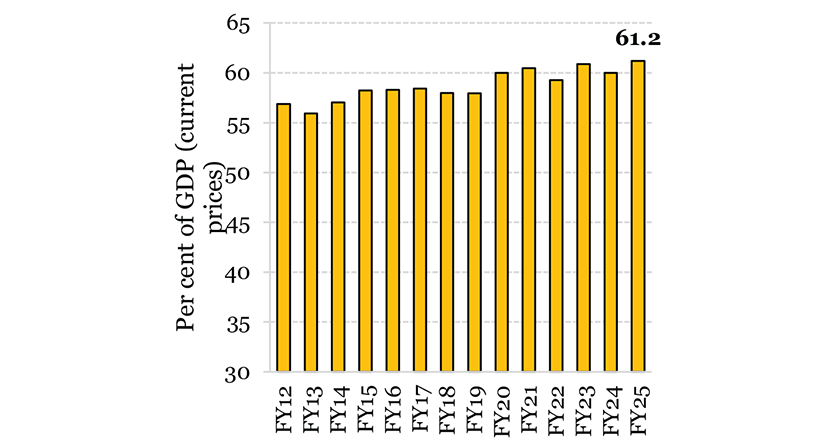
The share of GDP commanded by the Consumption Expenditure incurred by us Indians inched up to 61.8% in FY25e from 60.3% in FY24. This also marks a 14-year high in the metric.
Additionally, 2-wheeler, 3-wheeler, and tractor sales signalled that rural demand drove private consumption growth.
Coming to the sectoral breakdown, the survey analysed each of them with a single barometer:
“Gross Value Added” or GVA
To explain GVA simply, take this example:
Mr. Jamnalal, a local tailor from Surat, buys fabric for ₹100. He uses his skills to create a beautiful shirt, which he then sells for ₹250. The Gross Value Added (GVA) by Mr. Jamnalal is the difference between the selling price of the shirt and the cost of the fabric. So, Mr. Jamnalal's GVA is ₹250 - ₹100 = ₹150. This ₹150 represents the value he added by turning simple fabric into a wearable shirt.
The chart below shows the GVA growth trend for India over FY2019-FY2025e:
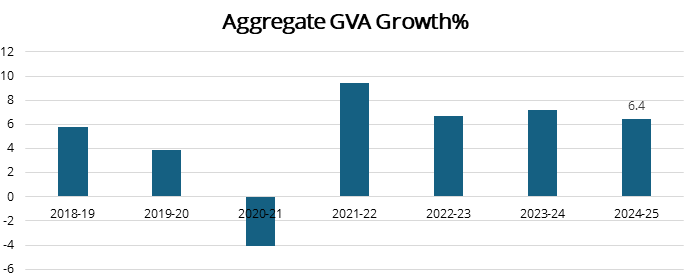
Here are the sector-wise GVA trends, mapped with their own historical trajectories:
- This may surprise you, but the GVA of the Agri sector is running well above its long-term trajectory, over the last several years!
- Industrial GVA growth is in line with its historical growth rates.
- The Service Sector GVA growth has recently caught up with its own historical growth rates.
- Manufacturing GVA runs below its long-term growth rates,
- The Construction GVA is displaying all-time-best growth rates.
Key Takeaways from the Sectoral Break Down
- Prospects for Agri have improved in FY25: For both output and overall farming conditions.
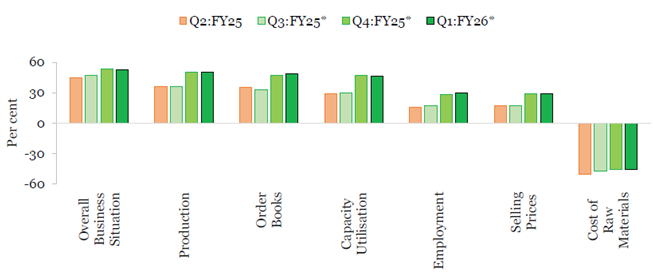
- Manufacturing sector growth has moderated but showed positive expectations:
Despite the moderation of growth in this sector in H1FY25, the business expectations data from the survey points to a recovery going into the 1st quarter of FY26:
Improvement in Business Expectations in the Coming 2 Quarters:
- Robust growth in the services sector: The services sector continues to perform well in FY25. This was witnessed by:
- H1FY25 occupancies in hotels being in line with the previous year,
- IT companies outperforming QoQ
- Air cargo activity grew in double digits
- Port Traffic growth remaining stable
On the export-import front, India exported more than it imported in H1FY25, generating a trade surplus during the period.
Conclusion
That’s it on the economic front for India in this section. As we navigate the markets in FY26 together, we hope that this article gives you a fair idea about India’s economic positioning with a new lens.
Analysis of Drawdowns in Nifty Indices
In the light of the recent market correction, we got to thinking:
How have the markets behaved historically, when similar corrections like the current one took place?
A presentation made on ET NOW caught out attention. This presentation drew parallels between periods of market correction and the maximum risk (or Drawdowns) that they entailed.
What are Drawdowns?
A drawdown in the stock market is when the value of an investment drops from its peak to a lower point, showing how much it loses during a decline. It helps measure the risk or loss a stock or portfolio might experience.
In this article, we present this analysis and its key findings.
The Analysis
The study analyzed all those instances in the past, where the Nifty 50 corrected more than 10%, thus indicating a serious correction in the markets. Then it simply measured how much the Nifty 50, the MidCap, and the SmallCap indices fell during those periods.
We tabulate the key findings of the analysis below:
The analysis covered the specific 8-9 instances in the past when the Nifty50 corrected by more than 10%.
- Performance in Big Bear Markets
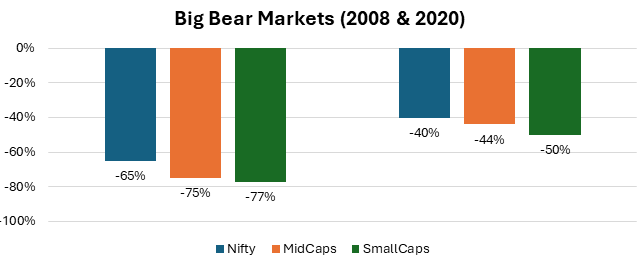
During 2008, the Nifty fell by 65% from its peak to the bottom. During this period, MidCaps fell by 75% and Smallcaps fell by 77%.
- Drawdowns during normal market corrections
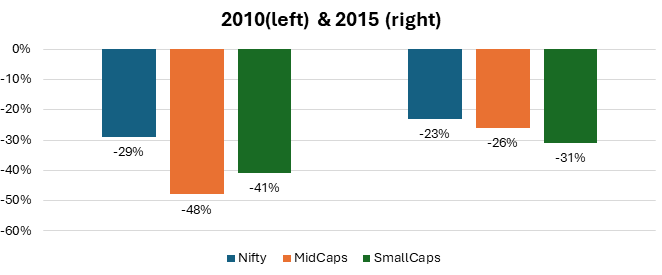
The chart above shows the average drawdown in the Large, Mid and Small Cap Indices during the intermediary corrections in an overall bull market. The corrections seen in 2010 and 2015 were intermediary bull market corrections.
- Summarizing Findings
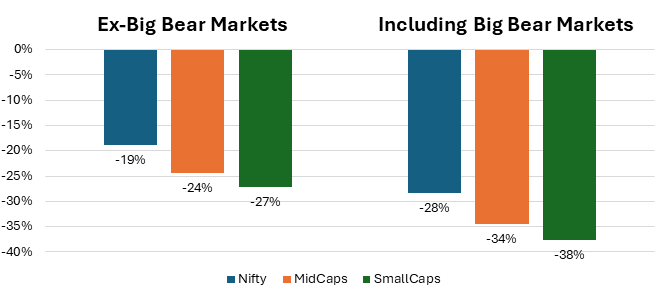
From the average 8-9 instances of market corrections, the average drawdown for each of the Large, Mid and SmallCap indices is illustrated in the chart above.
If we exclude big bear markets of 2008 and 2020, then we can reasonably conclude that:
“the average market correction for large-caps is 19%, mid-caps is 24% and small-caps is 27%”
-
Current Market Conditions
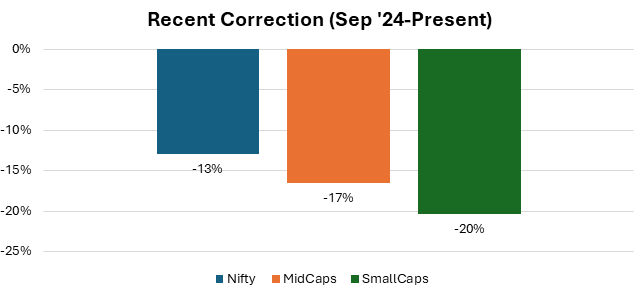
As seen in the chart above, the Nifty has corrected (peak to bottom) by 13% since September 2024, while the Mid and Small-cap indices have corrected by 17% and 20% respectively.
If we now refer to the findings in Point 3, we should get a fair sense of where we are in terms of the market corrections. (Caution! - Please refer to the pitfalls below)
Key Pitfalls in the Analysis
It is very important to note the key pitfalls in this analysis:
- The actual market correction may or may not revert to the average drawdowns mentioned in the ex-bear market illustration.
- The actual market correction can also exceed the given averages.
- In case of any unforeseen geopolitical or systemic risks, the market may go into a bear market correction mode as well.
However, the silver lining remains that certain market averages are nearing this required correction, and may soon enter the reversion zone (a-k-a buying zone)
Note:
This analysis is only meant to educate investors on the risks involved in investing in the stock markets. It is meant to be used as a risk management guide, rather than a guidepost for speculation.
Concluding Note
The recent fluctuations reflect short-term factors rather than fundamental issues. India’s growth trajectory is long-term, and the market is expected to stabilize, presenting discerning investors with opportunities to acquire high-quality companies at more favourable prices.


 Continue with Google