December 2024: Market Updates, Festive Trends, and Smart Economy
December 12, 2024
|
Monthly Update
Foreign Portfolio Investor (FPI) selling eased in the latter part of November, contributing positively to the market's recovery. Additionally, the BJP's unexpectedly robust performance in the Maharashtra elections bolstered market sentiment in the final week of the month, a momentum that has continued into December.
The GDP figures for the second quarter of this financial year were significantly lower than anticipated, registering at 5.4%. However, we are optimistic that the economy will improve moving forward as we anticipate an increase in Government spending in H2FY25 and a demand uptick due to the festive season. Management commentary suggests that rural demand remains robust, while urban demand, which suffered due to high inflation, is likely to recover.
The remarks made by the President-Elect of the United States, Donald Trump, suggest a strong commitment to fulfilling his campaign pledges. The ongoing depreciation of emerging market currencies raises significant concerns, as competitive devaluation could adversely affect all nations, even those not directly subjected to specific tariffs. The recent ceasefire in the Middle East between Israel and Hezbollah is a favorable development.
The recent years have witnessed remarkable wealth generation within our market, with valuations escalating to levels significantly above the average. Consequently, it is plausible that we may enter a phase of consolidation, during which the uncertainties stemming from changes in the policies of the world's leading nation could exert pressure on emerging markets. Nevertheless, we maintain the view that this phase for the Indian market will be temporary, as the ongoing transformations within the country are profound. Our market continues to exhibit a long-term upward trajectory, which is expected to persist for many years. It is advisable to remain invested and to utilize any market corrections as opportunities to enhance one's portfolio for the long term while keeping expectations realistic; one can accumulate wealth gradually and sustainably.
In this month’s newsletter, we discuss some topics that intrigue us and are worth a long read. We’ll be covering the following topics:
- MatriMoney - The Monetization of “The Great Indian Wedding”
- Smart Cities - How these efficient hubs are synonymous with “India 2.0”
So, let’s begin!
MatriMoney - The Monetization of “The Great Indian Wedding”
It becomes a matter of national pride when Indian businesses post record sales during the wedding season in India, which is usually around this time of the year. Understandably so, since these businesses generate as much as 30% of their annual revenues during this period alone!
The widely known “wedding season” begins in October and lasts until February of the upcoming calendar year.
In this article, we delve into the marvel of the “Great Indian Wedding”, its role in bolstering India’s GDP, key trends in the Indian wedding market, and the companies that stand to benefit from this monetization spree.
The Great Indian Wedding

An Indian wedding is an elaborate affair, with spending spanning across categories, right from food to finery. An average Indian wedding costs around ₹12 lakhs, which is five times India’s per capita GDP of $2,900 (over ₹2.4 lakh) and more than three times the average annual household income of around ₹4 lakh! These multiples are significantly higher than those of their global counterparts, like the US, China, Brazil, UK, Germany, Australia, and Japan for example.
We break down the spends of an average Indian wedding in the table below:
| Category | % of total exp | Expenditure (in ₹) |
|---|---|---|
| Jewelry | 50% | 6,00,000 |
| Food, Catering | 22% | 2,64,000 |
| Venue & Décor | 16% | 1,92,000 |
| Apparel | 6% | 72,000 |
| Others | 6% | 72,000 |
| Total | 100% | 12,00,000 |
Industry estimates, stockaxis research
As seen from the table, Jewelry accounts for almost 50% of the total wedding costs.
It must be noted that, in the case of jewelry, part of it was collected over the years.
Other sources claim that the average spend to be around ₹18 lakhs as well. For the more affluent individuals, the average spend goes up to 37 lakhs. In about 8-9% of the weddings, the average spend was >1 crore.
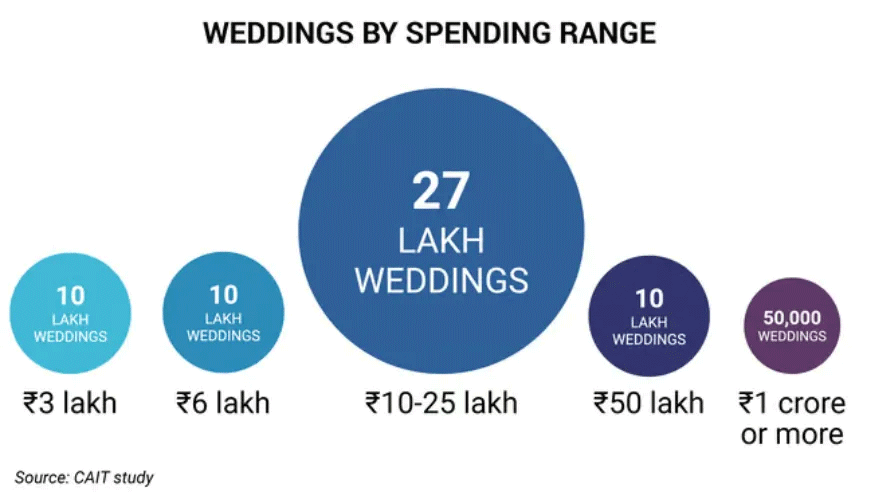
The chart above illustrates the breakdown of the number of weddings in India by the average spend.
The preparations for a wedding usually begin 6-12 months in advance, and thus certain expenditures are often backended or staggered in nature.
Newer kinds of expenses have also emerged, such as pre-wedding shoots, drone photography, social media schedulers, etc. These end up making weddings costlier as compared to a traditional wedding.
How much value do Weddings add to the Economy?
Weddings contribute as much as INR 10.7 lakh crore to India’s GDP each year, amounting to ~$130 billion in US $ terms. Delhi alone is expected to generate ₹1.5 lakh crores of revenue this year from over 4.5 lakh weddings in November & December this year, as per CAIT.
On top of it, weddings also generate massive employment by employing over 1 crore people including caterers, decorators, photographers and videographers, make-up artists, wedding planners, and musicians. (Source: Ministry of Commerce and Industry).
Weddings can be seen as a well-curated consumption basket, that is in huge demand in India. The chart below throws some light on the same:
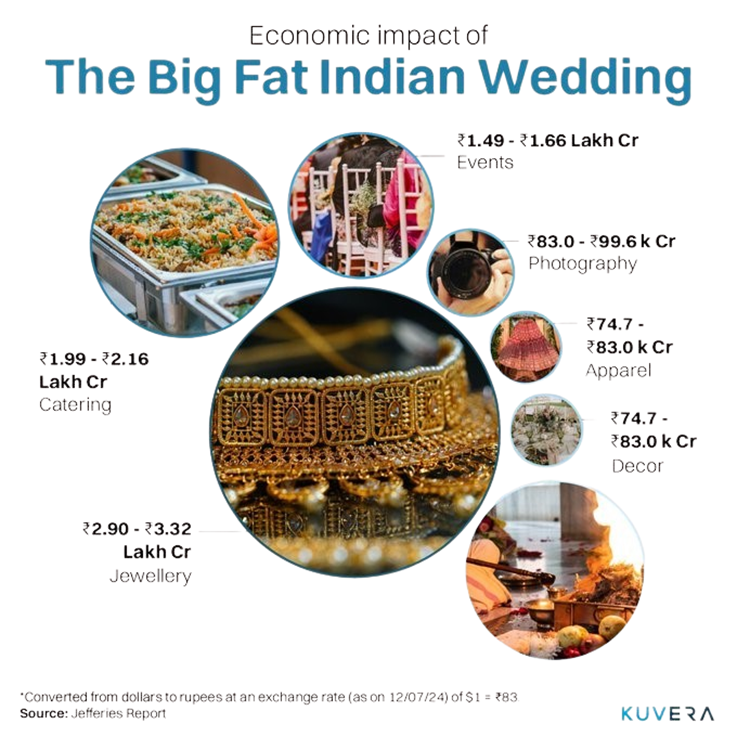
A simple illustration depicting the overall value generated for the economy by the goods/services availed in a wedding.
As many as 1.1 – 1.3 crore weddings happen each year in India. In 2024, the industry has already witnessed over 42 lakh weddings from 15 January to 15 July, generating an estimated expenditure of $66.4 billion (INR 5.5 lakh crore), according to a survey by CAIT (Confederation of All India Traders). With an estimated 48 lakh weddings expected to be held nationwide in November and December, the upcoming wedding season is poised to be a ‘significant’ economic milestone, according to a study conducted by the Confederation of All India Traders (CAIT).
Recently, the import duties on gold were reduced from 15% to 6%. This is expected to cause a significant increase in gold purchases across the country, particularly during the upcoming festive and wedding seasons.
India’s demographics are Ripe for Monetising Weddings
With a population of 1.44bn, India boasts of being the most populous country in the world, having overtaken China in April of 2023. With a median age of 26.7 years, and about 66% of the population below the age of 35, India is home to the world’s largest young population.
In any given year, India has an average of 100mn+ active seekers looking to get married. This is within the existing pool of 600 people who are of marriageable age, which is approximately ~40% of India’s entire population!
The data illustrates that there is no dearth of demand for weddings in India, and it is the supply side of things that needs to catch up with the rise in demand. This not only demonstrates the size of the opportunity, but also highlights the importance of the opportunity which is unique to India, and Indians.
What will drive growth?
There are multiple engines of growth for this industry, involving a combination of demographic, economic, and demand-supply factors:
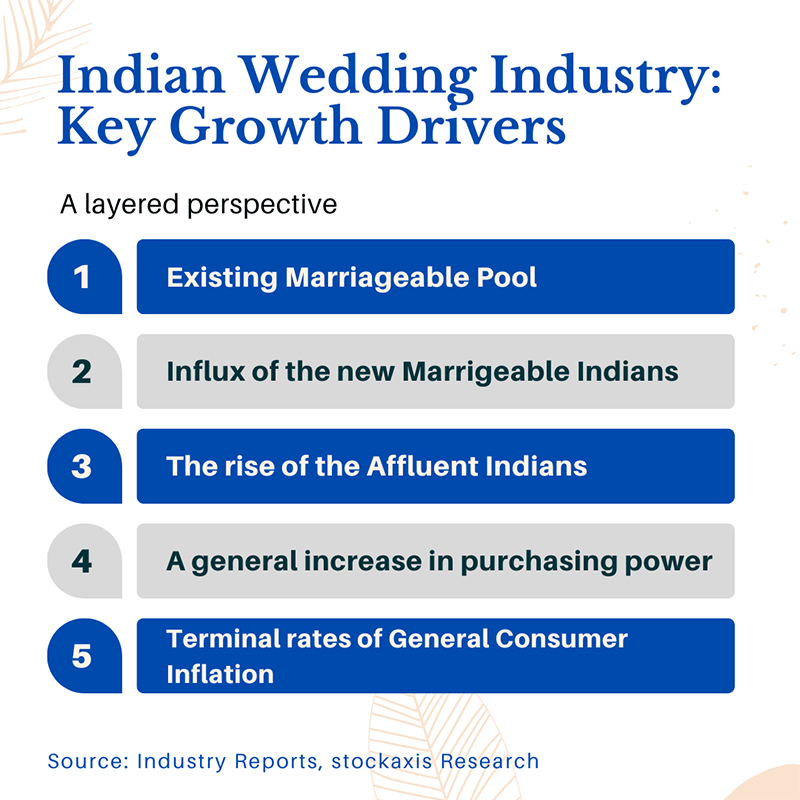
We explain each of the above growth layers here. If you wish to skip the explanation, you may scroll to the next section.:
- At the current rate of 1 crore weddings per year, and a marriageable population of 600, the pool is already as large as it can get!
- Each year, an increasing cohort of the population enters the marriageable age. India, being a young country has an inherent advantage.
- The general levels of consumer inflation will further help boost growth for businesses that earn from weddings.
- India’s purchasing power should rise in tandem with the GDP growth, which will help consumers avail better goods and/or services.
- The affluent Indians are at the forefront of the industry’s growth and should continue to spearhead the same for years to come, owing to greater affordability and disposable incomes.
A large youth demographic, rapid digital adoption, and changing attitudes toward marriage and relationships are expected to fuel the growth of the Indian Wedding Market in the coming years.
Consumption Trends in the Indian Wedding Market
1. Cultural Uniqueness of India
A wedding holds a lot of importance in an Indian household and is hence performed with a lot of pomp and excitement. Families do not hesitate to loosen their purse strings, as weddings are rare and special occasions. This aspect is subtle yet clearly evident in the behavior of us Indians.
Data reiterates this cultural difference between India and the world:
The Indian wedding market is 2x the size of the US market but smaller than China's.
On a comparable basis, India also spends significantly more on weddings compared to any other country in the world.
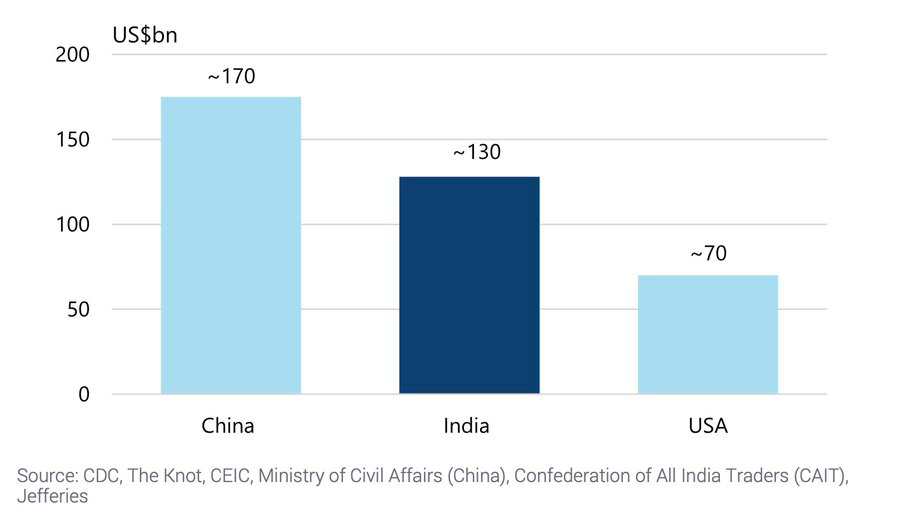
This cultural aspect is unique to India, and to Indian businesses who understand the Indian consumer, and can offer them the right goods and services that are needed in any Indian wedding.
2. Wedding expenses are being shared now:
Due to increasing levels of financial independence and the rising incomes of Indian women over men, the trend of brides and grooms sharing wedding expenses has come to the fore. An impressive 70% of brides and grooms contributed financially to their weddings in 2023 and 21.1% of couples shared half of the total wedding expenses.
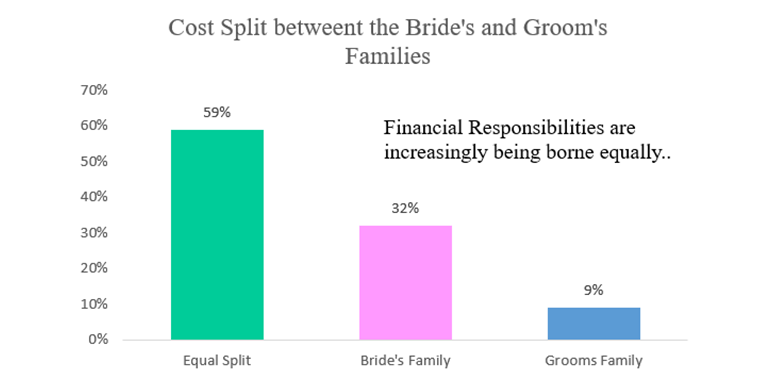
(Source: Industry Reports, stockaxis Research)
3. Affluent Indians are driving the growth in spending:
The premiumization trend in Indian weddings is rapidly gaining momentum and is worth a mention here. Luxury weddings, in particular, are carefully planned purchases, often made well in advance.
The demand for luxury wedding décor, apparel, and watches is growing rapidly, outpacing that of their standardized counterparts. Prestigious shopping destinations like DLF Emporio in Delhi, often referred to as North India’s premiere luxury retail hub, are already experiencing the influence of this trend. Top designers and international labels are showcasing their collections in grand style at such venues.
This growing preference for luxury has also attracted foreign brands like Bvlgari, Armani, and Cartier to enter the Indian market. Meanwhile, local companies such as Titan, Vedant Fashions, Eicher Motors (Royal Enfield), Safari, and Indian Hotels Company Ltd., and several others are seizing the opportunity to tap into the premiumization wave, reaping significant benefits.
4. Destination Weddings
An adjacency to luxury weddings, this variant of weddings again caters to the affluent class of customers. Destination weddings are reportedly growing at anywhere between mid-teens to high 20s rates in India each year. The affluent class of consumers is driving this growth, driven by their higher incomes.
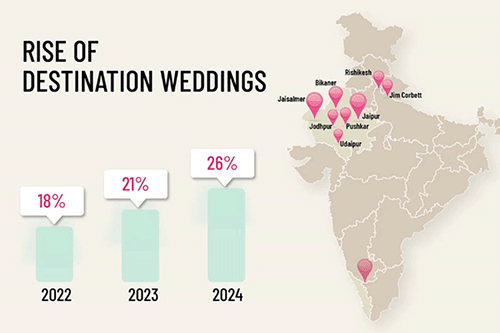
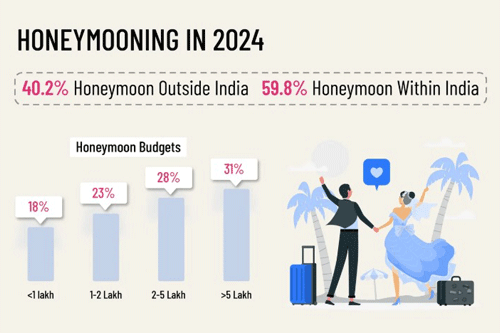
The pictures above illustrate the growth trend in the destination wedding business in India, and insights into honeymoons, including honeymoon budgets and preferences. Honeymoons are another by-product of weddings, and in turn drive growth for the travel, tourism, and aviation industries.
Indians spent approximately $12.1 bn was spent on destination weddings abroad last year, as per available market data.
Couples are known to spend anywhere between ₹50 lakhs to ₹5 crore for hosting weddings at overseas locations. The average cost of a destination wedding, at some of the most popular destinations in India, is as follows:
- Goa: between Rs 1 crore to 1.5 crore
- Jaipur between Rs 1 Crore to 2.0 crore
- Metropolitan cities: Between Rs 20 lakh to 70 lakhs.
5. A Shift Towards a More Experiential Wedding
Contrary to conventional weddings, today’s India is looking for superior experiences at a competitive cost. They are willing to pay just a little more if they can switch to a more premium offering.
Indian couples look for concepts like Pre-wedding photoshoots, bachelor/bachelorette parties, After-parties, Open Air Weddings among others to achieve a more memorable experience.
6. One out of three weddings in India are funded entirely by the parents of the couple & 4 out of 5 weddings in India are funded through loans.
Indians are known to spend as much as ten years of their annual incomes on weddings. This is significant since a large chunk of life savings flow out for this purpose.
With as many as 80% of weddings being funded through loans, the wedding industry is proving to be one of the essential demand drivers for consumer credit in India.
7. Other consumer preferences
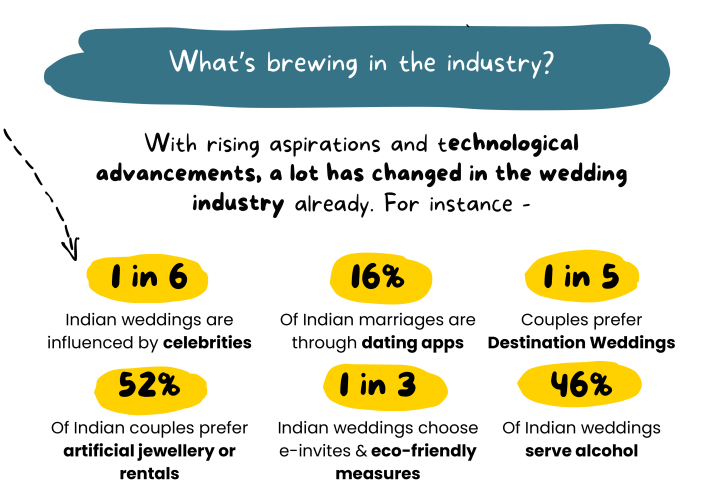
Nikhil Kamath - social media posts
This trend is allowing companies to price their goods and services at a higher mark-up, while the quality of offerings is also improving in tandem.
Which companies stand to benefit from this trend?
Although the kind of companies that stand to benefit may have become evident by now, we’d like to list down the key businesses that should benefit from the same:
- Gems & Jewelry companies
- Apparel companies
- Beauty and Personal Care Retailers
- Online Matrimony websites/apps/dating apps/Matrimony Services/Event vendor aggregation platforms
- FMCG/Beverages/alcohol/Caterer companies
- Décor companies
- Consumer Durable Companies (TV, Washing Machines, A/Cs, Refrigerators etc.)
- Photographers
- Event Planner businesses
- Hotels/Villas/Resorts
- Travel & Tourism, Aviation; Honeymoons
List of companies that can do well in Q3FY25
If we closely examine historical financial data, we can assess certain predictable patterns that may repeat in the future.
We analyzed the quarterly sales data of wedding-related companies to ascertain any patterns over the last 20 quarters, and to check if there were any such patterns.
From our list of wedding-related companies, we found out the following:
Companies for which Q3 is the best quarter (i.e highest quarterly sales) historically:
- Indian Hotels Company Ltd.
- Interglobe Aviation
- Easy Trip Planners
- Yatra Online
- Safari Industries
- Vedant Fashions Ltd.
- Aditya Birla Fashion & Retail Ltd.
- Arvind Fashions
- Shoppers Stop Ltd.
- FSN E-Commerce Ventures (Nykaa)
- Titan Company Ltd.
- Kalyan Jewellers
- Senco Gold
- Goldiam International
- Matrimony.com Ltd.
- Info Edge Ltd.
- United Spirits Ltd.
Companies that had either Q3 or Q4 as the best quarter historically:
- EIH Ltd.
- Chalet Hotels Ltd.
- Lemon Tree Hotels Ltd.
- Radico Khaitan Ltd.
- Tilaknagar Industries Ltd.
- Globus Spirits
The findings from our analysis are tabulated below:
| Particulars | Q4 | Q3 | Q2 | Q1 |
|---|---|---|---|---|
| FY24 | 26% | 28% | 23% | 23% |
| FY23 | 26% | 27% | 23% | 23% |
| FY22 | 27% | 32% | 25% | 16% |
| FY21 | 35% | 33% | 21% | 11% |
| FY20 | 32% | 24% | 22% | 22% |
| Median | 27% | 28% | 23% | 22% |
The table shows the quarterly breakdown of annual sales for our sample group of companies from FY20-24 It was found that Q3 was among the highest quarters of the year, over the last 5 years for all the 22 companies, barring the Covid year.
For a large section of companies within out sample, this Q3 effect is particularly stronger, while for others the demand uptick is reflected in Q4 sales as well.
We can thus conclude with a reasonable probability that (barring any company-specific, systemic (i.e India-specific), or geopolitical developments) the above-mentioned companies will have a strong Q3/Q4 this year.
Finally, we tabulated certain metrics for all the above-mentioned companies, to assess their size, efficiency, and valuations:
| Sr.No. | Company Name | FY24 Sales | H1FY25 Sales | Market Capitalization | Adjusted PE | Market Cap / Sales | ROE% | ROCE% |
|---|---|---|---|---|---|---|---|---|
| 1 | Aditya Birla Fashion and Retail Ltd. | 12351 | 6256 | 20858 | 0.00 | 1.69 | -4 | 8 |
| 2 | Arvind Fashions Ltd. | 609 | 360 | 6024 | 0.00 | 9.89 | 0 | 0 |
| 3 | Chalet Hotels Ltd. | 1392 | 708 | 18152 | 65.23 | 13.04 | 16 | 10 |
| 4 | Easy Trip Planners Ltd. | 482 | 209 | 7600 | 63.77 | 15.78 | 23 | 30 |
| 5 | EIH Ltd. | 2193 | 977 | 28066 | 53.88 | 12.80 | 16 | 21 |
| 6 | FSN E-Commerce Ventures Ltd. | 258 | 212 | 46238 | 394.88 | 179.25 | 8 | 6 |
| 7 | Globus Spirits Ltd. | 2415 | 1760 | 1916 | 19.81 | 0.79 | 10 | 10 |
| 8 | Goldiam International Ltd. | 374 | 247 | 1822 | 30.73 | 4.88 | 21 | 27 |
| 9 | Info Edge (India) Ltd. | 2381 | 1295 | 72216 | 86.69 | 30.33 | 5 | 6 |
| 10 | Interglobe Aviation Ltd. | 68904 | 36540 | 136810 | 16.75 | 1.99 | 0 | 0 |
| 11 | Kalyan Jewellers India Ltd. | 15783 | 9914 | 44086 | 79.57 | 2.79 | 14 | 16 |
| 12 | Lemon Tree Hotels Ltd. | 357 | 170 | 10353 | 106.80 | 28.97 | 9 | 13 |
| 13 | Matrimony.Com Ltd. | 473 | 232 | 1167 | 24.09 | 2.47 | 18 | 25 |
| 14 | Radico Khaitan Ltd. | 4119 | 8172 | 23085 | 90.26 | 5.61 | 11 | 13 |
| 15 | Safari Industries (India) Ltd. | 1549 | 907 | 8414 | 54.47 | 5.43 | 26 | 33 |
| 16 | Senco Gold Ltd. | 5230 | 2874 | 5994 | 31.75 | 1.15 | 16 | 15 |
| 17 | Shoppers Stop Ltd. | 4213 | 2102 | 8268 | 111.91 | 1.96 | 28 | 89 |
| 18 | The Indian Hotels Company Ltd. | 4406 | 1967 | 84173 | 76.87 | 19.11 | 12 | 16 |
| 19 | Tilaknagar Industries Ltd. | 1394 | 1488 | 4053 | 27.81 | 2.91 | 26 | 23 |
| 20 | Titan Company Ltd. | 47114 | 23373 | 338623 | 95.55 | 7.19 | 27 | 23 |
| 21 | United Spirits Ltd. | 10692 | 12500 | 82237 | 62.68 | 7.69 | 20 | 27 |
| 22 | Vedant Fashions Ltd. | 1365 | 507 | 22547 | 54.39 | 16.52 | 28 | 40 |
| 23 | Yatra Online Ltd | 297 | 239 | 2247 | 0.00 | 7.56 | -5 | -1 |
The above-mentioned stocks are for illustrative purposes only and are not investment recommendations.
Smart Cities – How these efficient hubs are synonymous with “India 2.0”
In an initiative to boost India’s manufacturing, the Government of India in partnership with think tanks like the National Industrial Corridor Development Corporation (NICDC) has recently fast-tracked the conceptualization and development of 12 industrial “Smart cities.”
So, what are these so-called “Smart Cities”? What is their economic significance? How will these powerful hubs shape the socio-economic future of India? What is India's progress in the Smart City Mission?
We discuss the answers to all these questions below. So, let's dive in.
What is a Smart City?
A Smart City is simply an urban area where the primary goal is to create an environment that yields a high quality of life to its residents while also generating overall economic growth. In these smart cities, technology and data collection are used in most or all of the city’s operations to help facilitate an increased delivery of services to citizens and businesses with less infrastructure and cost.
Smart cities are a great way to boost economic growth and achieve scale in manufacturing. What's better is that the idea of smart cities is built on the concept of “socio-economic” development. (Improving the society’s economic and social well-being together and not in isolation).

Smart cities are known for their plug-and-play infrastructure for several amenities required by residents and businesses, with the implementing agency taking care of land acquisition and environmental clearance, enabling businesses to set up manufacturing facilities easily.
What are the Features of a Smart City?
A smart city is unique and is known for its differentiated features as compared to the conventional city infrastructure.
In India, a smart city is characterized by:
- a potable recycled water supply,
- a reliable 24-hour power supply,
- effluent treatment plants,
- a gas pipeline,
- an online application process to approve building plans,
- integrated city planning,
- telecom, and optical fiber cable (OFC) network,
- single-window clearance, and
- e-land management system.
- enhanced connectivity to major highways, railways, airports, and ports, ensuring easy access to both domestic and international markets.
A smart city is a foundational model, and several pieces of technology and infrastructure can be embedded on top of it. This flexibility gives smart cities immense power and allows them to gain scale rapidly and sustainably.
In general, a smart city possesses some/ all of the below-mentioned features: (in addition to those mentioned above)
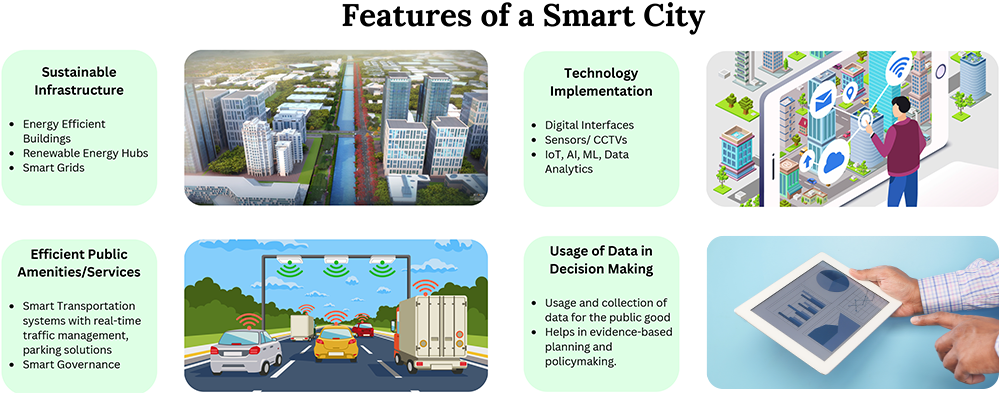
Why are Smart Cities Required?
There are two primary reasons why the government is so optimistic about smart cities:
1. India’s share of Manufacturing in GDP has stagnated for several years:
If India is to achieve the economic ambitions that it has planned for itself, then it needs to amp up its share of manufacturing in the overall GDP, which has stayed in the ~13-15% range for some years now.
2. The pace of urbanisation is going to pick up in the future:
In order to comfortably house the influx of rural population into the urban areas, India will need the requisite capacity, infrastructure, and economic scale, which will be achieved via smart cities.
Examples of Smart Cities around the World
Smart cities are being developed across the world. Several developed countries already have them, while emerging economies like India are fast catching up to this practice.
China’s Shanghai, South Korea’s Songdo, South Africa’s Cape Town, and Hong Kong (for its advanced tech adoption including 5G) are prime examples of socio-economic success via the Smart City model.
Example 1: Songdo, South Korea
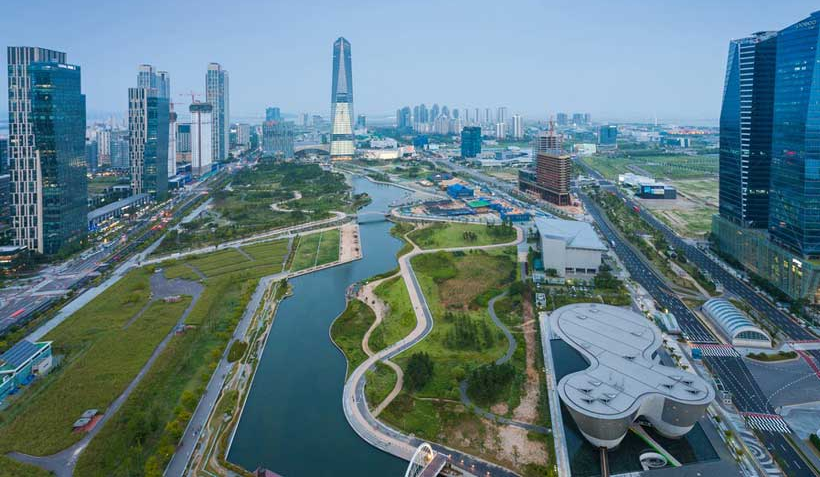
A bird’s eye view of Songdo, a city on the northwestern coast of South Korea. Songdo’s advanced infrastructure and strategic location have significantly increased foreign investment and urban development in the country, driven by its smart city initiatives.
Example 2: Shanghai, China
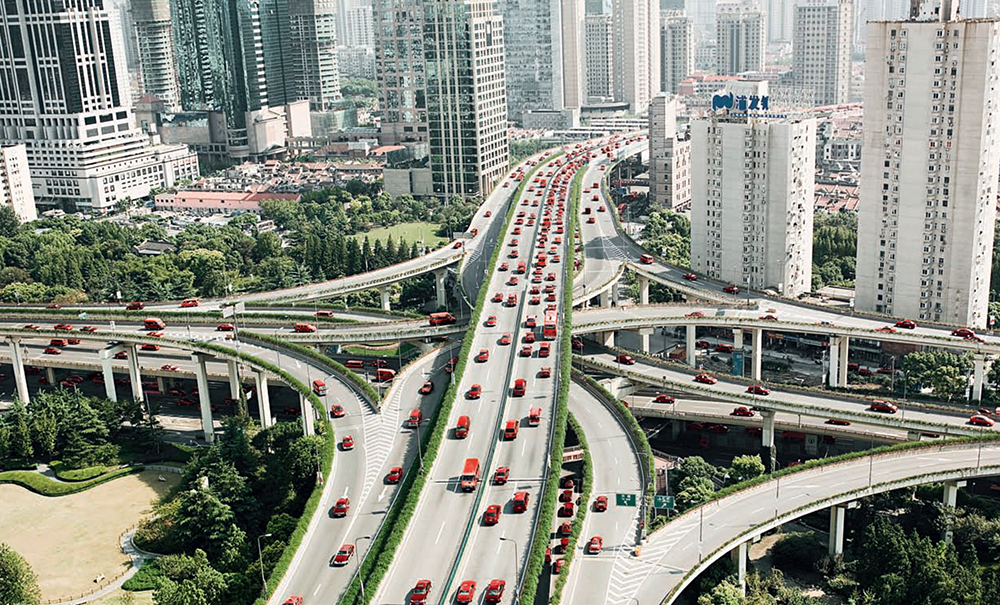
A glimpse of the Shanghai Smart City in China. What is unique is that the government’s investment in sustainable public utility infrastructure triggered a virtuous cycle of economic development for the city, which helped it become the financial hub of China.
Example 3: Hong Kong Smart City
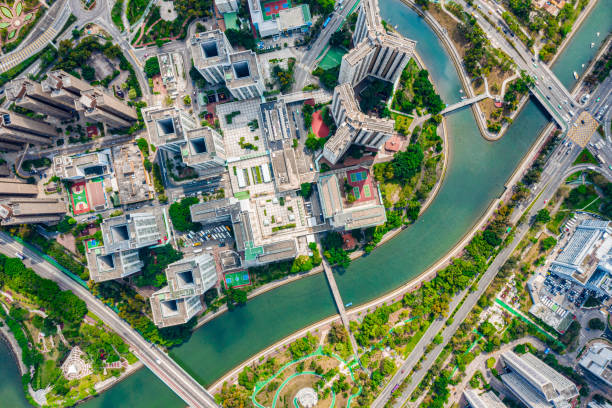
A bird’s eye view of an area in Hong Kong. The government of Hong Kong has adopted a mission to practice Smart living, Smart Government, Smart Economy, and Smart Environment as best practices in the country.
Other countries like the UAE and Nigeria are also investing heavily in smart cities.
Back to India – Key Developments
The idea of India’s first smart city was first born in the town of Dholera, in the Ahmedabad District of Gujarat, by our honorable PM Shri Narendra Modiji in 2013.
Fast forward to today, the base infrastructure of the planned smart city is ready, required approvals are in place, and large companies such as the Tatas have announced investments to set up facilities here. Dholera is also the first semiconductor city of India, wherein an entire ecosystem is taking shape. Micron Technology’s plant in Sanand is also close to Dholera.
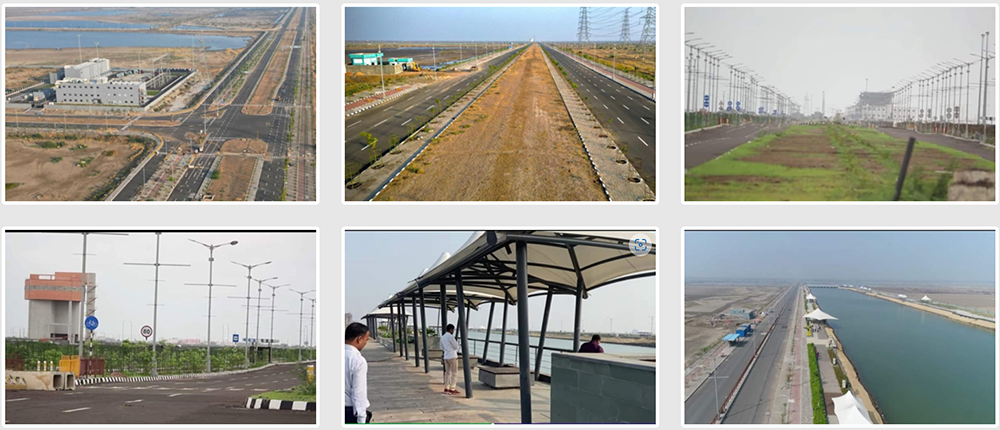
The current progress of the Dholera SIR (Special Investment Region)
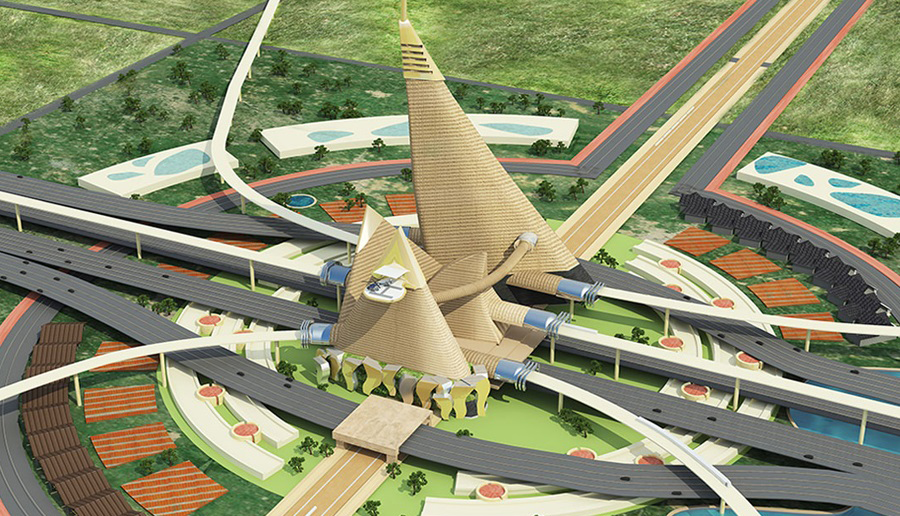
A render of the Dholera Smart City post-completion.
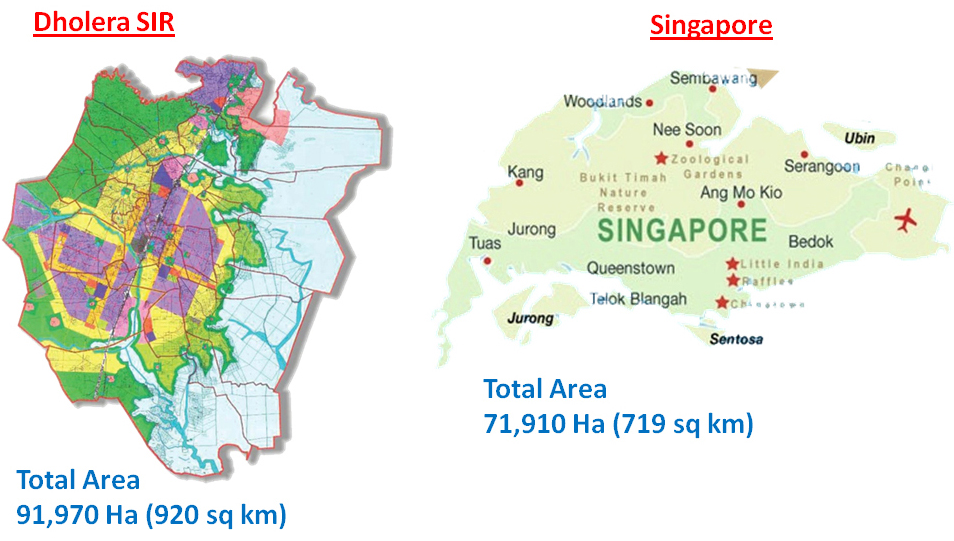
To get a sense of the project’s scale, the Dholera Smart City is 28% larger than the entire land area of Singapore, as seen in the picture below:
In 2015, PM Modi’s government announced a plan to create 100 smart cities in India, and rolled out a new five-year urban development mission for 500 cities, at an estimated cost of ₹1 trillion.
To date, 4 industrial smart cities have been completed across the country and are ready, while another four are under construction/development. Since 2015, work on the requisite land acquisition and approvals, along with associated infrastructure arrangements has been going on, and is now materializing meaningfully for India.
In August this year, another 12 smart cities were approved, after detailed discussions at the central and state government levels. The construction of the same is likely to be completed in the next 3 years.
The map below shows the current status of the India Smart City Mission:
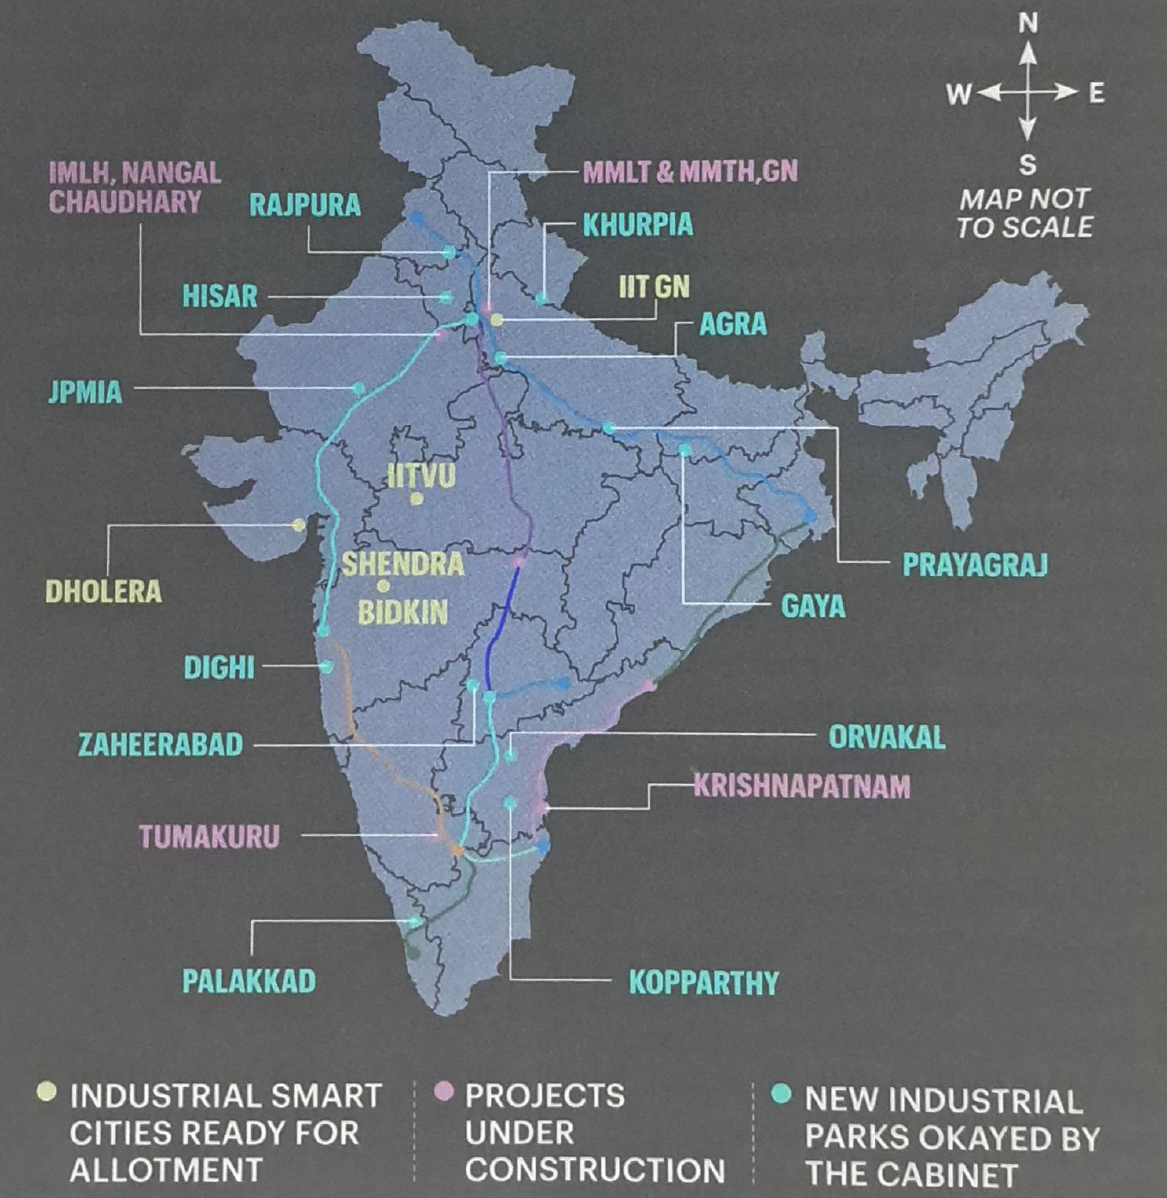
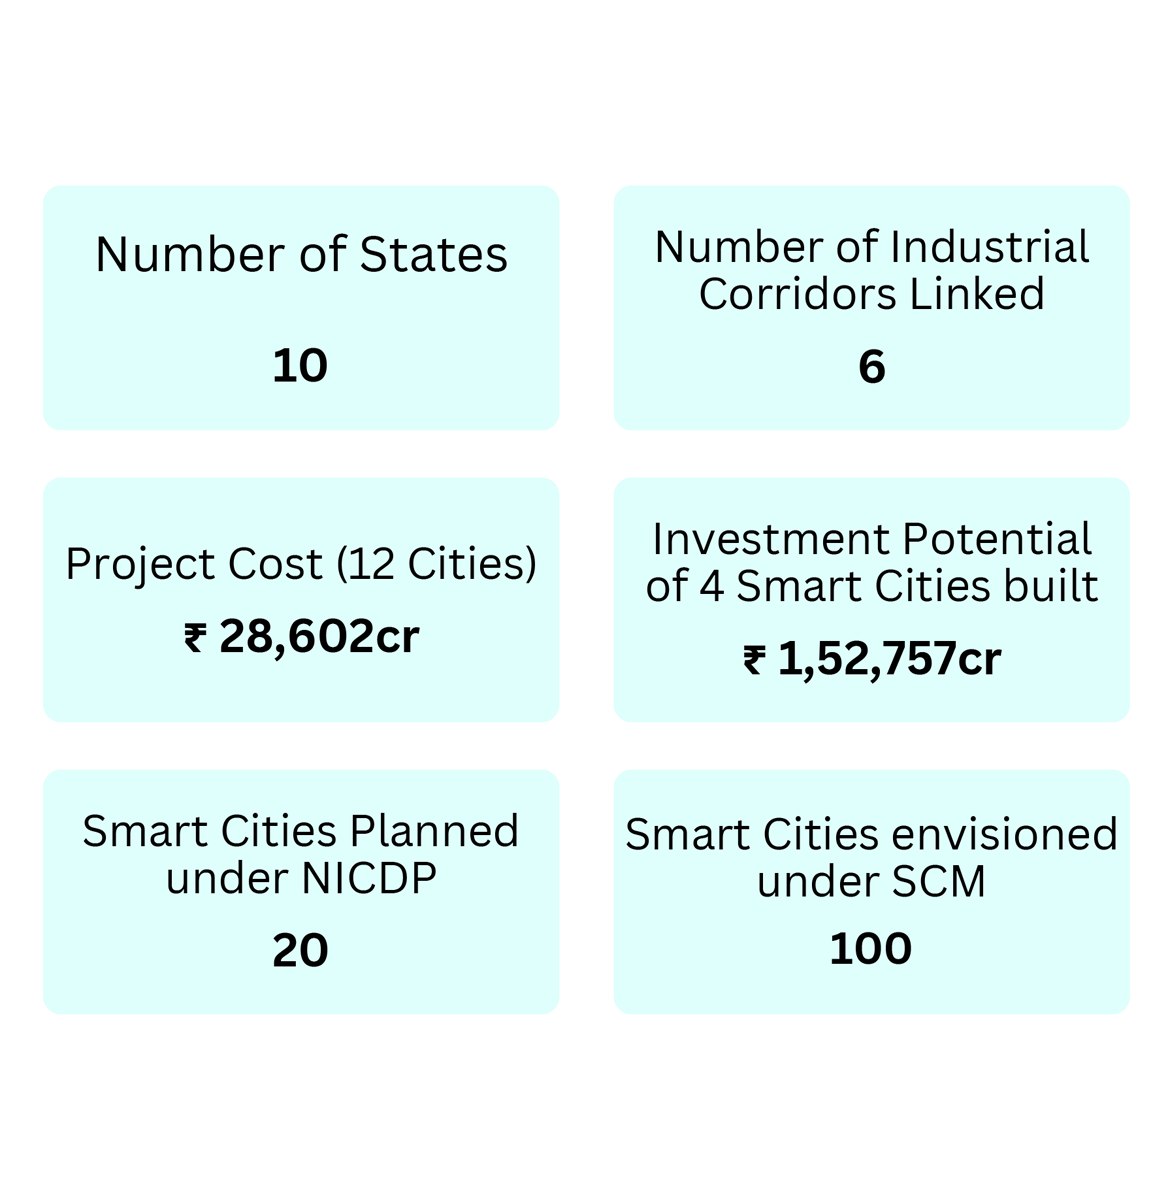
The India Smart City Mission: Key Facts and Figures at a glance. Source: Business Today, stockaxis research.
The core focus sectors of the established/ongoing smart cities will be Heavy Engineering, Auto & Auto Ancillaries, IT Services, Pharma & Biotech, Electronics & Semiconductors, Fabricated Metal Products, etc.
Use Cases of Industrial Smart Cities in India
- GIFT City’s Advanced Infrastructure: India’s first global financial hub in Gandhinagar, Gujarat features district cooling and automated waste collection systems, showcasing cutting-edge urban utilities. GIFT City is renowned for its fiscal initiatives, such as the bullion exchange, facilitating foreign currency borrowings for companies, making it easier for companies to list their shares and raise capital from abroad, lucrative norms for asset management companies, etc.
- Pune City’s “Open Data” Initiative: Akin to the “Citizen Cloud” implemented in many Chinese cities including Shanghai, India has started its own such initiative in the form of the “Open Data” initiative, where public data is used for the public good.
-
Public Utility Works Across India:
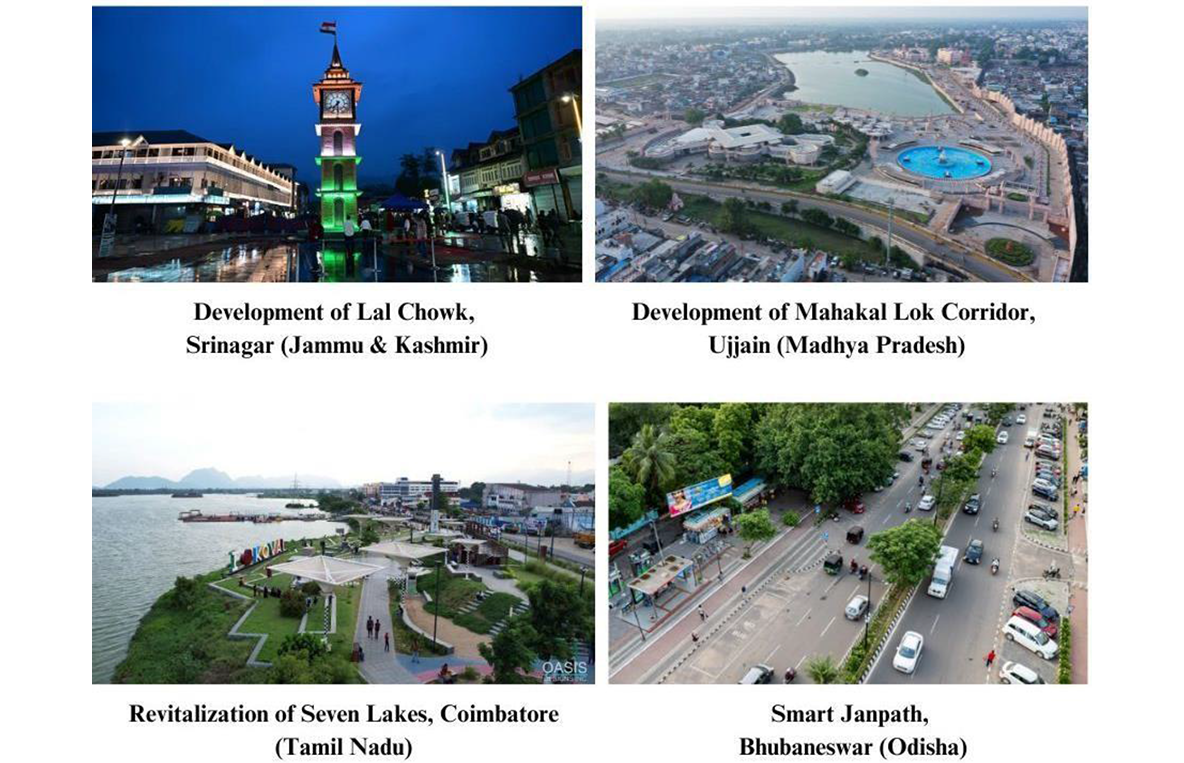
- Digital Transformation in Surat: Microsoft is helping Surat with urban planning, water management, e-governance, and a city dashboard to track key performance indicators, enhancing its status as a diamond and textile hub.
The Response of the Private Sector is Overwhelming
Akin to the response that smart cities like the GIFT City at Gandhinagar saw, the emerging industrial smart cities are also seeing the same demand, with several companies committing investments and joining in as strategic partners.
For example, Toyota Kirloskar is setting up a manufacturing plant at AURIC (Aurangabad Industrial City) in Maharashtra, while Hyundai Motors India has agreed to set up an automobile hub on 450 acres at the Zaheerabad industrial smart city in Telangana.
The four developed emerging economies have secured investments from companies like ReNew Power, Tata Electronics, and Kohler, with inquiries underway for upcoming projects, officials say.
Vedanta Group’s Chairman Mr. Anil Agarwal has announced that the company would set up two industrial parks, one for aluminum and another for zinc and silver, on a not-for-profit basis.
The image belows shows the strategic partners at the Dholera SIC:
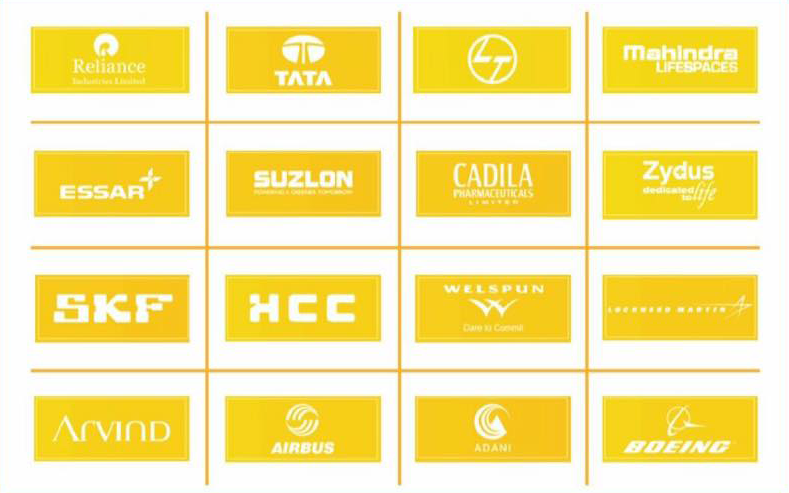
Key Companies in and around AURIC: (Aurangabad Industrial City)

Conclusion
The smart cities initiative is one of the longer-term projects of the Government of India. The silver lining here remains that the “India 2.0” that is envisioned will be one where the focus is not solely on industrial growth and profits, but also on the overall well-being of the population. With the smart city initiatives, India’s Ease of Doing Business rankings are poised to improve, along with an increase in the prosperity of businesses and people. The project may not appear to give instant results, but almost all industry experts agree that smart cities are a surefire way to achieve India’s long-term manufacturing ambitions.


