Where is the market heading? What’s in it for you? Is more downside possible?
March 01, 2016
|
After a short consolidation in the last 10 days of January, the bears have again taken control of the market. This has been majorly attributed to the mounting NPAs or bad loans that many leading PSU banks, including Bank of Baroda, Bank of India, IDBI Bank and UCO Bank have reported. In December 2015 alone, nine state-owned banks have reported a combined loss of Rs. 11,251 crores. Surprisingly, HDFC Bank, who is India's second largest private lender, now has a market capitalization equal to that of all the PSU banks put together. Yes, the post-budget session has shown some respite, but will it continue?
Markets will yo-yo further, but we as investors always have to understand that good times are inevitably followed by bad and bad by good. Before we prove this claim, we need to understand a few concepts including the P/E Ratio, P/B Value and Dividend Yield of the popular Nifty50 index. As of 29th February 2016 , those values are:
- P/E ratio: 18.90
- P/B ratio: 2.81
- Dividend Yield: 1.66%
These concepts are so helpful that you’ll want to reread this article several times until you’ve understood them and could use their applications for the rest of your investment life.
So, what does the P/E ratio of an index mean? What are the indicators?
Similar to that of a company, Nifty50 P/E ratio measures the weighted average P/E Ratio of the companies covered by the Nifty index and is broadly used to identify how cheap or expensive the index is. It is calculated by dividing the sum of market capitalization by the sum of consolidated earnings of all companies which constitute the index.
It is interpreted for the Nifty50 as follows:
- BUY Signal: Once the P/E ratio goes below 18 (UnderValued Range).
- SELL Signal: Once the P/E ratio goes above 24 (OverValued Range).
Also, according to our research on the past 15 years’ data, it is inappreciable to invest in Nifty50 when its P/E ratio starts to exceed the 20-22 range. Everytime the value surpasses 22, the average returns given by the index in 3 years is way lesser than that given by Fixed Deposits (25%). Here’s the corroboration:
| P/E ratio | P/B ratio | Avg. Div Yield | Av. 3Y Nifty50 Returns% |
|---|---|---|---|
| <14 | 2.61 | 2.29 | 149.05% |
| 14-16 | 2.99 | 1.8 | 116.00% |
| 16-18 | 3.3 | 1.51 | 53.47% |
| (Range on 29th Feb, 2016) 18-20 | 3.65 | 1.39 | 35.95% |
| 20-22 | 4.04 | 1.24 | 15.48% |
| 22-24 | 3.89 | 1.15 | -1.84% |
| 24-26 | 4.81 | 1.02 | -1.41% |
| 26-28 | 6.33 | 0.86 | -2.23% |
| 28-30 | 6.54 | 0.82 | -4.94% |
And what does the P/B ratio of an index mean? What are the indicators?
Applying the same analogy as above, P/B ratio of an index is the weighted average P/B ratio of all the stocks covered by the index, Nifty50 in our case. Formulawise, dividing the current closing level of the index by the latest quarter's book value per share (average of all companies) gives you the Price-To-Book ratio of Nifty50. In simpler terms, the stock price of an entity always has two values - one that assigned by the accountant which is called the book value and the other assigned by the market which is the traded stock price. The former does not take into consideration the value of intangible assets like patents, brand value, intellectual property, etc and hence is comparatively lower in most cases.
Talking numbers, a P/B ratio of around 2.75 to 3.50 is usually considered fair valuation for the index. Its interpretation is as follows:
- BUY Signal: Once the P/B ratio goes below 2.75 (UnderValued Range).
- SELL Signal: Once the P/B ratio goes above 3.50 (OverValued Range).
Lastly, what is the Nifty50 Dividend Yield and how to interpret it?
Like the above two ratios, it is basically the weighted average dividend yield of all the Nifty50 companies. Dividends are one way of distributing the profits to the shareholders. The Dividend Yield of a company can be calculated by dividing its annual dividend per share by the traded price of the share.
It is expressed in the form of percentage and a fair value for the index bounces between 1-1.5%. They are read as:
- BUY Signal: Once the Div Yield goes above 1.4% (UnderValued Range).
- SELL Signal: Once the Div Yield goes close to 1% (OverValued Range).
Further, we’ll show more proof on how useful it is to analyze these ratios and make informed decisions.
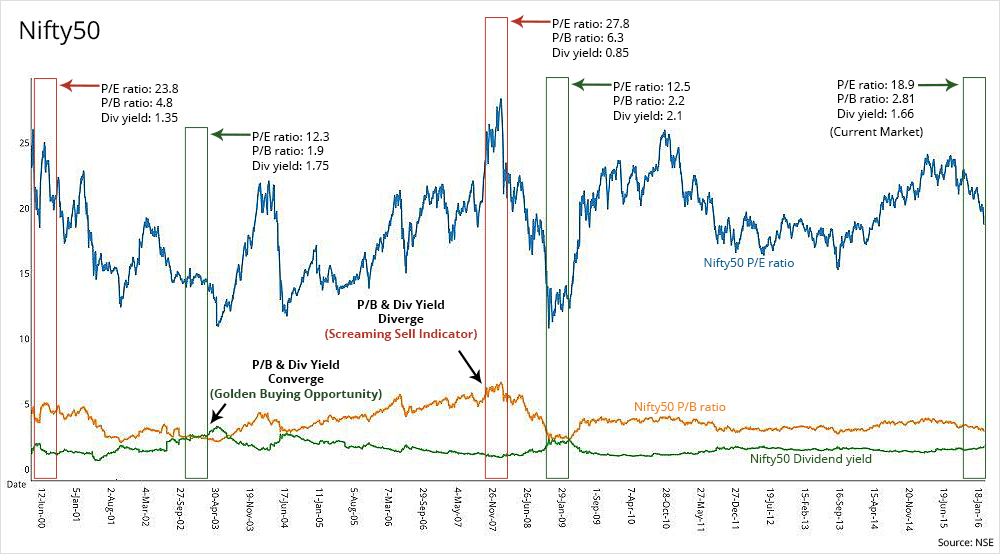
Below given is the P/E ratio, P/B ratio and Dividend Yield of the Nifty50 index over the past 15 years. Let us analyze and prove whatever that has been claimed in the article till now:

Observation 1- All bull markets are followed by phases of undervaluation and vice versa. In other words, all good times are inevitably followed by bad and bad by good.
Example: Nifty was enjoying its dream run during the period from January 1999 to December 1999 which was fueled by the global dot-com bubble. This was followed by an evident dot-com burst in 2001 leading to an elongated undervaluation phase during 2002 to 2004. The Nifty P/E was range bound around 12-13, with a P/B value of around 1.9-2.2 and a Dividend Yield of 1.5-1.65%.
By mid 2004, ultra cheap credit and mortgages caused the then ongoing bull run in the housing sector to soar in a parabolic fashion, creating an explosion in demand for construction workers, mortgage brokers and realtors. People started spending freely and it was perceived to be as a recovery from the previous bear market. But what economists, business leaders and politicians did not realize that it was built on the back of an unsustainable bubble which eventually burst in 2008 and led the world into a recession. Although India did not contribute much to this sub-prime mortgage crisis, it was and has always been affected heavily by global turbulences, like the recent China slowdown. The Nifty P/E at the start of the burst was around a whooping 28.57 with a P/B value of around 6.5 and a Dividend Yield of 0.85%. All these indicators were enough for it to show that a fall was imminent and that is exactly what happened.
The markets were battered till the mid 2009 period post which we witnessed another bull run.
Observation 2- As per the chart, everytime the P/B ratio and Dividend Yield seemed converge, the market presented golden BUYING opportunities to the investors and eventually gave handsome returns to those who grabbed that opportunity.
Example: One can see them converging between August 2001 to December 2002, and again between February 2008 to February 2009 which were basically periods of undervaluation. These were the two occasions when Nifty presented its investors with a great chance of making money.
Also, as expected, Nifty P/E was close to 12.5 with the P/B value of around 2 and the Dividend Yield of around 1.55 during the time. These indicators were screaming for Nifty to be bought as it is rare for all three of them to be in such an ideal BUY range.
Remember, we have to learn to deal with these bad or good phases without damaging our long term prospects. It is best to be patient as well as aware about these things. Smart investors BUY at correct times in a bear market when no one is interested in going long and SELL when there is a massive euphoria where everyone, I mean everyone tries to become a stock market guru. You can be right on every other stock selection criterion that we’ve discussed till now, but if you’re wrong about the timing, you will most likely erode a huge chunk of your wealth.
Now that we’ve understood the ratios and their indicators, let us see when Nifty50 showed similar values for these ratios as it is showing now and what happened next:
| Date | P/E ratio | P/B ratio | Div Yield | Nifty50 Level | Nifty50 Returns% |
|---|---|---|---|---|---|
| 15-Dec-03 | 19.01 | 3.71 | 1.60 | 1723.95 | 14.98% (High of 1982.15 in 1 month) |
| 26-Sep-12 | 19.02 | 3.09 | 1.46 | 5663.45 | 09.25% (High of 6187.3 in 8 months) |
| 01-Apr-14 | 18.91 | 3.24 | 1.37 | 6721.05 | 35.68% (High of 9119.20 in 11 months) |
| 29-Feb-16 | 18.90 | 2.81 | 1.66 | 6987.05 | ???? |
As you can see, Nifty50 showed similar signs in Dec 2003, Sept 2012 as well as Apr 2014 as it is showing now and grew by delightful margins in a short span of time. Hence, do all the calculations you want, but history indicates that this is a bottomed out market now and a good time to allocate your money. So make sure you don’t miss this potential rally!
I’m sure that you can now decide for yourself where the market is heading with its current values. Also, you do not have to put much effort in calculating the Nifty P/E, P/B Ratios and Dividend Yield. Data for all the sectors is available on NSE’s website. Go on and try it for yourself! But again, keep in mind that optimism is always ahead of reality; and for uniformed investors, nothing ever indicates a crash other than hindsight.


