Law Of Supply & Demand – An Analyst’s Point Of View!
January 22, 2016
|
I’m sure everyone is aware of the relentless decline in oil prices that 2015 has witnessed. Brent crude and WTI have plunged from around $60/barrel last Christmas to below $30/barrel a year later. What analysts are now looking at is whether the commodity is set to rebound in 2016 or is there worse to come? Note that, the prices did recover to some extent a few times last year, but they think that it will be years before it returns to the $90-100/barrel price band, which has pretty much been the norm over the last decade. Well, one can easily say that the oil industry, which has had its share of booms and busts, is in its deepest downturn since the 90s, if not earlier and is crushing some of the very well known petrostates including Russia and Brazil. But, as retail investors in the equity market, what can we learn from it?
First, we’ll have to understand what caused these prices to collapse. Though, it appears to be a very complicated question, finding the answer boils down to apprehending the simple economics of supply and demand. The domestic production in the US has nearly doubled over the last 6 years i.e. up by 4 Mn barrels/day. This has caused the imports to plummet forcing them to find another home and the Saudi, Nigerian and Algerian oil that once was sold in the US was suddenly competing for Asian markets. So naturally, the supply increased and the producers’ strategy of not to curb the production and keep the price up failed to a great extent. Also, Europe and other developing economies are becoming more and more energy efficient thereby reducing the demand for fuel.
This is decreasing the desirability of using fuel and the over-supply in the market is decreasing its price.
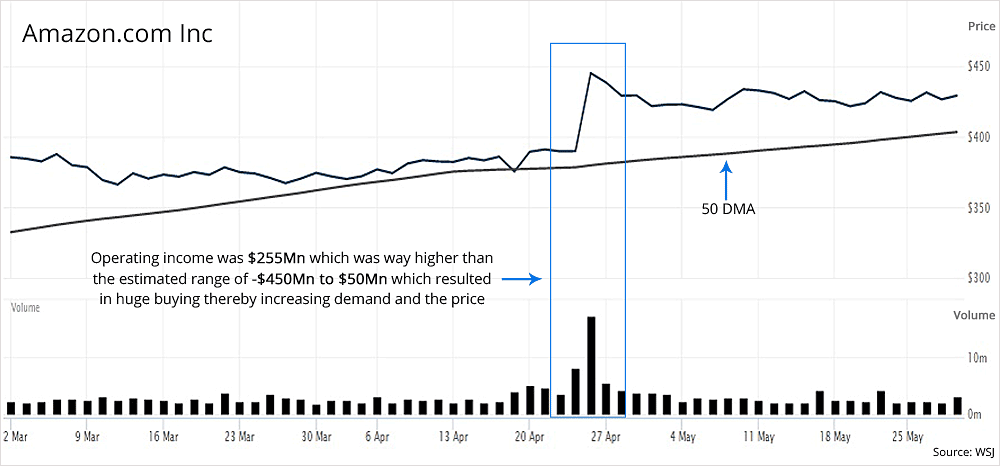
Applying the analogy to our stock market, influences like profit, revenues, debt and so on affect the desirability of owning or selling a stock, but their prices are a direct result of supply and demand. If a company happens to surprise the investors with better than expected results, like Amazon.com Inc. did in Q1-2015, the demand for the stock increases. And as it does, the equilibrium between buyers and sellers is changed. In terms of both, revenues and operating income, Amazon came out beating its own average estimates by a huge margin.
Keep in mind that, it is very difficult to stir the price of a stock, say ONGC Ltd. which has more than 8.5 Bn outstanding shares simply because the supply is just too large. Generating a rally in such scrips requires huge buying which retail investors cannot provide. Institutions like mutual funds, pension funds and banks trade in sufficient volumes to drive stock prices up or down depending on the number and speed with which they buy or sell. For example, on 1st March 2012, Life Insurance Corporation (LIC) acquired 37.71 Cr shares or 4.41% of ONGC worth Rs. 11,426 Cr. In spite of this huge buying, ONGC rose just 0.9% to Rs. 283.35, and that too below LIC's buying price of Rs. 303.67. One can imagine how difficult it is to bring a rousing rally in such stocks.
On the other hand, it only takes a reasonable amount of buying to pump up the price of a stock having a fewer number of outstanding shares, say 50 Mn. So, if you were to put your money, the stock with a smaller outstanding number would be a good bet, considering that the other factors are equal. But, keep in mind that since they are less liquid, they might come down even faster. So this advantage comes with a risk. We have discussed ways of minimizing this risk in our previous articles and will continue do so in the future.
But, the small-caps outperforming large-caps was not the case in the 90s, and mutual funds had a huge role to play in this. Ideally, the large caps are much older and sluggish as compared to the small-caps and the funds prefer the latter which have and had a dynamic entrepreneurial management. Talking numbers, in March 1987, the mutual fund industry had assets worth Rs. 4,564 Cr under management. The numbers jumped to Rs. 47,733 Cr in the next 6 years and were Rs. 1,082,757 Cr as of March 2015.
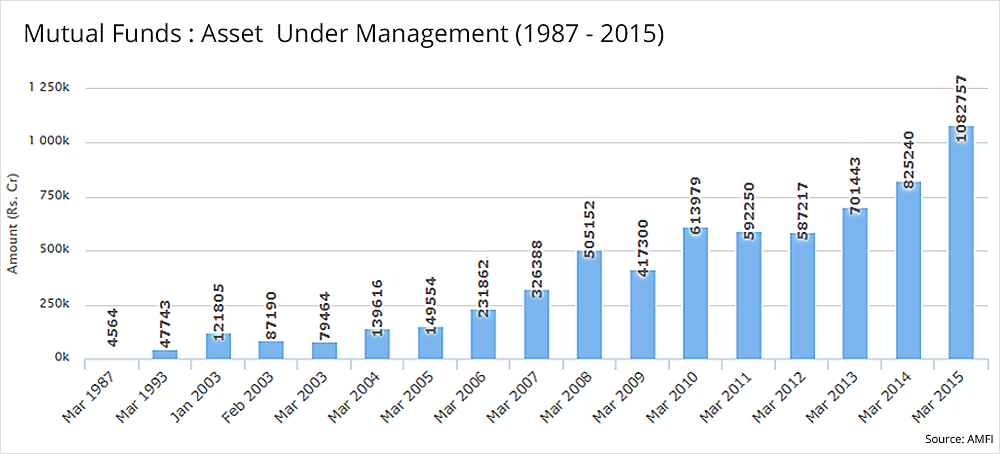
You can see that the size of the mutual funds increased by more than 10X in just 6 years from 1987 to 1993 and the industry suddenly found itself inundated in new cash which had to be parked somewhere. During 1993-94, the BSE had just 3,585 listed companies with a market capitalization of Rs. 3.68 Lakh Cr (we have not considered NSE as it had just got recognition as a stock exchange during the time) and with limited options to invest in, they were forced to buy more and more companies which were then large-caps. One of the other reasons to buy the larger issues was that the amount of cash available with the mutual funds was way higher than the ideal amount needed to invest in the then small-caps.
Therefore, this need to park their money into the large-caps made it appear to the retail investors that they favored them and everyone started investing in those companies (either individually or through the funds). So as mentioned earlier, this can be attributed to one of many the reasons why large-caps outperformed small-caps during the 90s. But as time passed by and the economy grew, more companies got listed giving the funds a larger pool of options i.e. small-caps and-mid-caps to invest in, thereby reducing their investment in the sluggish old large-caps. As of March 2015, the market cap of BSE was 10X of that of the mutual fund industry with more than 5500 companies listed increasing the list of options for them to invest in.
Another circumstance that disturbs the equilibrium of supply and demand is companies repurchasing their own shares from the market. In most cases, this is considered to be a good sign because companies usually perform this when they fancy their earnings to grow. As a result, the net income will be divided by a lesser-than-earlier quantity of shares thereby increasing the EPS. And as we have discussed in our articles on Quarterly and Annual earnings growth, EPS is one of the most important factors which drives stock prices. Let us look at an example of a well known company, Crompton Greaves Ltd. which purchased its own shares over a period from March 2002 to September 2002 from the public as well as institutional investors.
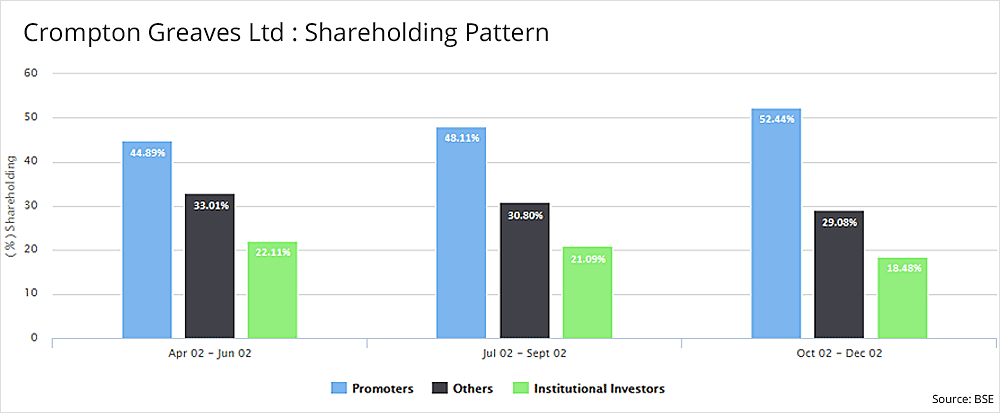
In Q1 2002, the mutual funds had increased their stake in Crompton Greaves Ltd. by 1.44%, taking their holdings from 20.66% to 22.11%. This was followed by a 3.22% increase in the promoters’ holdings in the very next quarter i.e. from 44.89% to 48.11% and another 4.33% increase in Q3 2003. What this did to Crompton’s stock is, it eventually reduced the outstanding shares in the market which was complemented by a strong increase in the EPS, from 0.01 to 0.12 to 4.45 in the respective quarters. This jacked the stock price from Rs. 2 to Rs. 4.35 i.e. a rise of more than 117% by the mid of July 2002 itself.
Now we’ll learn how to evaluate supply and demand like a technical analyst
Ideally, when there is a correction, investors prefer to see the volume dry up at some point to ensure that there is no more selling pressure. Thus, when the price is falling down and if you see increasing volumes, it indicates that the stock has not bottomed out yet and there is further downside possible. This can be seen in the example mentioned below of India’s biggest lender, State Bank of India Ltd. during the period from 2008-09:
- The first correction is complemented by a slight increase in the volume which takes the price from Rs. 257 to Rs. 158 i.e. a 39% decline in less than 4 months.
- This is followed by a couple of weeks of consolidation before the second correction.
- As earlier, the second correction was also accompanied by increasing volumes which took the price to close to Rs. 96 i.e. 40% fall in just 2 months.
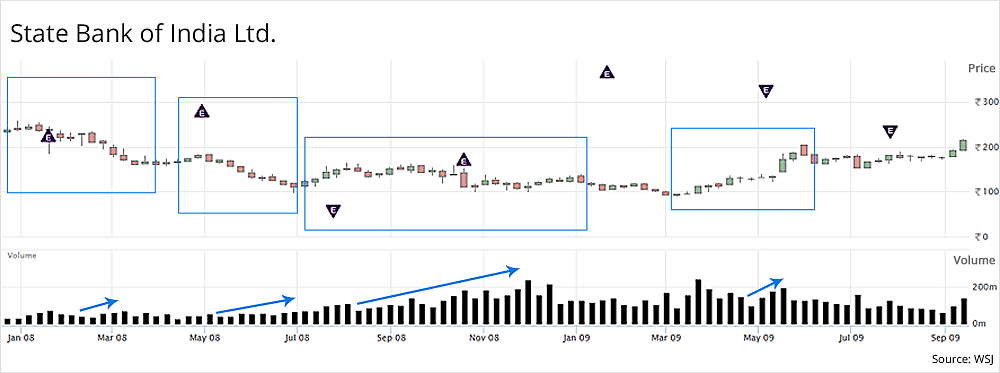
- Now, again the correction is followed by a consolidation, but this time is different from the previous one. You can clearly see the increasing volumes during this relatively long basing period and the stock is trading near its recent lows. This indicates an increasing accumulation going on in this spread of 5-6 months of which we can assume that the stock has nearly bottomed out with a possibility of some undercut lows.
- We can now expect the stock to rally in price which is exactly what happens (even though it is a small rally) with a continued increase in buying volume.
Remember, every time a stock breaks out of a price consolidation, one can expect a 40-50% and sometimes a 100% increase in trading volumes which can be seen in our example. Finally, in the last part that we’ll be discussing about is the excessive stock splits that many companies declare.
Stock split is ideally performed to attract more buyers who were earlier reluctant to buy at the previous price. What the spilt actually does is, it exponentially increases the supply of that stock in the market which may produce an opposite result. Seasoned investors and some perceptive traders use the opportunity of an extravagant split to clear their positions and book profits. Sometimes, large investors also offload their stakes thinking that it is easier to sell their, 5Cr shares before a 3-1 split than to sell 15Cr shares afterwards.
All you need to do is follow some simple rules and keep an eye on those events and who knows, even you can become the next big investor… Till then, Happy Investing!


