High Priced And Super High Priced Stocks – Don't Just Ignore Them...
November 21, 2015
|
Like most investors, you probably would have familiarized yourself with the importance of the P/E ratio of a stock. You would have also learnt that it is one of the most important factors to skim that list of companies you have in your hand. Well, prepare yourself for a surprise because it’s not…
But before that, let’s understand in short what P/E ratio is all about. In the simplest terms, it shows the amount of money you are ready to pay for each rupee worth of the earnings of the company. Formula wise, it is calculated by dividing the current market price of the stock by its earnings per share (EPS). We’ll apply the logic to a day-to-day example. Suppose you went to the market and brought 1kg of onions for Rs. 100 only to realize that they were available for Rs. 80 somewhere else and that too, of the same quality. Obviously you would be disappointed as you had to pay 25% more for the same quality. Applying the analogy to stocks, if you buy a share of company 'A' for Rs 100 and find later that the share of company 'B' is available for Rs 80 and that too with same/better prospects, it is bound to disappoint you. To avoid this mistake, analysts use P/E ratios to determine whether the stock prices make sense or not!
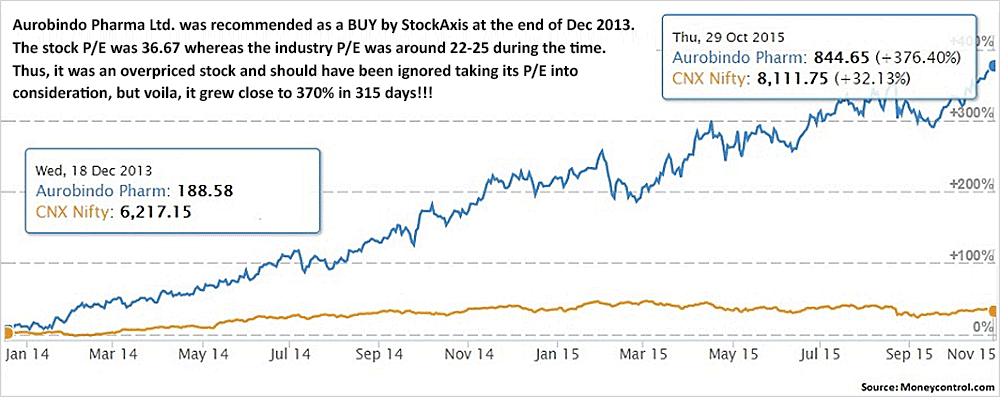
Now coming back to that surprise part, It is a common myth that a stock is undervalued if it has a low P/E multiple and vice versa. But our analysis and track record has shown that contrary to this belief, P/Es are not that relevant as they appear and have very little to do with major stock rallies. We’ll understand this with an example of Aurobindo Pharma Ltd.

Remember, P/E ratios are not a cause of excellent performance. They are in fact an end effect of accelerated earnings which attract big institutional buyers resulting in strong price rallies. Sometimes, high P/Es occur due to roaring bull markets, so make sure you don’t overlook a stock just by that number; it could be the next great winner. Also, the same applies for a bear market; never buy a stock just because the P/E ratio makes it look like a bargain. There is a reason why it is low, so do your research thoroughly.
Coming back to our example of Aurobindo Pharma Ltd., here are some of the reasons why it was given as a BUY by us:
- The company had broadened its scope from just antibiotics and antiretroviral therapies (ARV) to high-value growth segments such as controlled substances, injectables and life style segments.
- In the US, ARBP had 157 DMF filings pending approval then, the highest by any Indian company.
- The company was one of the largest generic suppliers under ARV contracts, with a 35% market share.
- ARBP had largely under-utilized capacities (45-50% average utilization for formulations) which had a potential of a ramp-up, driven by new launches in the US, aiding operating leverage. This was expected to help the company boost its margins in the next two years.
- It was believed that as the revenue would scale up, the high fixed costs, which were a drag on profitability, will provide operating leverage and that is exactly what happened.
So how did we look at the P/E of Aurobindo Pharma? Let us understand and implement this the way an analyst does…
STEP 1 - During the time it was recommended by us, the stock was trading at Rs. 370 (split unadj) and had an EPS (unadj) of 10.09 as per its FY13 results thereby quoting a P/E ratio of 36.67. So, firstly, an analyst assigns a P/E ratio to the stock as per her/his long term view; which is 2 years in this case. So we had assigned a P/E ratio of 17x on FY15-E, based on our analysis which includes macro and micro economic factors.
STEP 2 - Analyze the growth expected in the EPS for the next 2 years or any duration you want to consider. In our case, we had expected the EPS to grow from 10.09 in FY 13 to 29.54 in FY14E and 36.45 in FY15E.
STEP 3 - Since we concluded that the EPS will grow slightly more than 260% two years down the line, the target price set for Aurobindo Pharma is deduced by the formula (Expected EPS * Expected P/E ratio) i.e. (36.45*17) which is roughly in the range of Rs. 620-630.
Eventually, as expected by us, Aurobindo Pharma delivered the projected growth, infact it outperformed all the expectations and gave an EPS of more than 52 as per its FY15 results and achieved our projected price of Rs. 620-630 in the start of April 2015 itself; almost 9 months ahead of the projected time.
I hope you have now understood how to look at the P/E ratio from an analyst’s point of view and not just ignore the scrip just because it is trading at a ratio higher than the industry standard. Remember, institutional and long term investors invest in a company considering long term durations. Future earnings is what matters to them rather than short term gains.
Another ghastly mistake done by a lot of retail investors is to compare P/Es of two dissimilar companies. Firstly, let us know what the word ‘similar’ means in our context… Consider the two pharmaceutical majors, Aurobindo Pharma Ltd. and Sun Pharmaceutical Industries Ltd.; one of the many reasons that these companies can be compared is that they belong to the same sector (Pharmaceuticals) apart from having similar product portfolios (Formulations, Active Pharmaceutical Ingredients, etc) and a ‘massive’ P/E difference. Now coming to the dissimilarity part, you cannot simply compare Sun Pharmaceutical Industries Ltd. with say Tata Motors Ltd. at all. You also cannot compare it with Godavari Drugs Ltd. even though they are in the same sector as the latter deals exclusively in Antibacterials and Antihistamines whereas Sun Pharmaceutical Industries Ltd. has a huge product portfolio excluding these.
So long story short, the interpretation of P/E ratio revolves around the comparison of a company with its ‘appropriate’ peers. Also, the P/E ratio should never be the only metric used when trying to determine whether a company is currently overvalued or undervalued.
Let’s take a look at some high P/E stocks that were great bargains:
-
Gillette India Ltd. had announced its Q3 2015 results on 3rd February, 2015 which showed a P/E of 95. It went on to make an all time high of Rs. 5546.9 thereby gaining close to 170% during the time.
A very important observation that one can make in Gillette is that in its 2015 annual results, one can see that the spend on marketing has decreased by 2.52% to Rs. 556.12 Cr but the sales have increased by additional 12.5%. Hence, this surplus gets linearly added to the PAT and eventually increases the EPS of the company. As a matter of fact, Gillette’s PAT increased by more than 200% to Rs. 158.13 Cr.
Now, if Gillette puts a cap on the amount to be spent in marketing, say around Rs. 530 Cr and successfully maintains its growth in sales with a stabilized expenditure, it will be able to increase its PAT margins non-linearly and will show a phenomenal increase in its EPS. The earnings were hidden in the marketing costs and therefore one needs to dig deeper and understand every line of the financial statements. - Bosch Ltd. after its Q3 2015 results was trading at Rs. 9366.3 with a P/E ratio of 66.33 and made an all time high of Rs. 27989.25. It thus fetched returns close to 200%.
- Cement major Shree Cements Ltd. rallied more than 200% post its Q3 2015 announcements. It had a P/E ratio of more than 40 during the time.
- Similarly, 3M India Ltd. was trading at Rs. 3700 after it announced its Q3 2015 results. It had a P/E ratio of close to 40 then. It also managed to clock its all time high of Rs. 12899 at the end of October 2015 thereby giving an incredible 250% gain!
Buy stocks with proven records of significant sales and earnings growth in the last three to five years plus strong recent quarterly improvements. Don’t accept anything less if you are looking out for the best!!!


