Are The Indian Public Sector Banks Finally Entering Calmer Waters?
January 18, 2019
|
2018 has been one of the most glamourous years for the Indian banking sector, especially for entities with ties to the government. And this glamour, mind you, was not at all pleasant. Yes, people have now become reluctant to even simply deposit their savings in these PSUs, leave aside investors buying shares of these banks. I mean why would they buy these shares? Have a look at the stock performances of the top 5 public sector banks barring heavyweights like SBI:
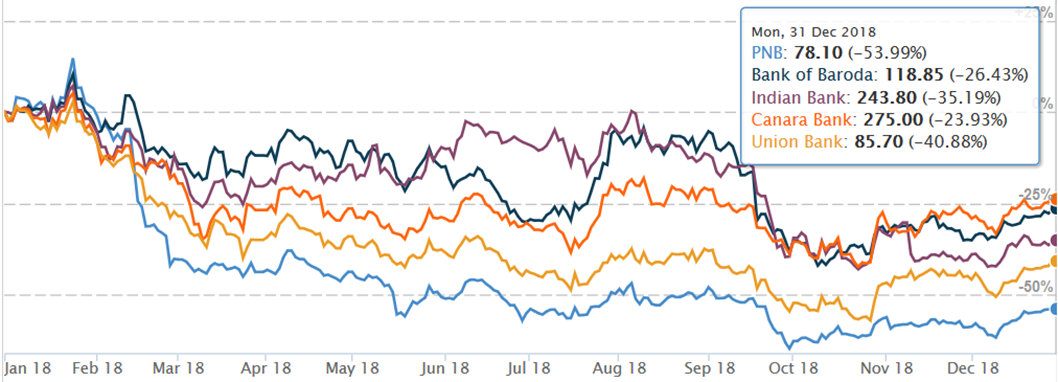
Not at all attractive right? And why not; the benchmark Nifty50 gave at least 4% returns in the same period. So what incentive does anyone have to invest in these apparently toxic stocks? We have seen quite a few big ticket defaults borne by these banks; We have seen quite a few coming under RBI’s dreaded Prompt Corrective Action (PCA) framework; We have seen them report cumulative losses worth Rs. 85,000+ crores in the last fiscal with trends improving only slightly this year.
So, now, the golden question: Is The Worst Finally Over? Well, let’s find out…
Starting with the basics, we hear a lot of terms like stressed assets, slippages, asset quality, credit growth, provisions, etc. Everything, at least today, boils down to the infamous Non-Performing-Asset (NPA) scenario. Once and for, let us get this concept of NPA cleared including how exactly is it formed?

Statistically speaking, the total banking stressed assets in India is around Rs. 9.6 lakh crores = ~15% of the entire loans given by banks. That is huge right? And most of this belongs to our PSUs here. This shows the condition that they are in right now. But is this condition there to stay? Or are these PSU entering calmer waters?
Let us take the example of the posterboy bank Punjab National Bank, which had to bear much of the negative limelight last year and see if it is still worth investing? Does Albert Einstien’s golden rule of “In the middle of adversity, lies opportunity”
After the Nirav Modi fiasco in which the bank was robbed of ~Rs. 14,000, crores PNB had to again face pressure due to the fall of IL&FS in which it has a significant exposure of ~Rs. 1900 crores. This was complimented by MTM treasury losses and simultaneous decline of market share to private banks. Everything that could go wrong for PNB, did go wrong and yes, the bank’s stock did take a beating, eroding more than half of its value in the previous 12 months. But the question that should ideally pop up to informed investors is, was the market over-cautious when it came to PNB or are the current dirt-cheap valuations justified? Have a look at some of the key ratios of PNB for the last 5 quarters, as well as of ICICI Bank to compare with, another Indian Bank that came to limelight for all the wrong reasons.
| PNB | Q2FY18 | Q3FY18 | Q4FY18 | Q1FY19 | Q2FY19 |
|---|---|---|---|---|---|
| GNPA % | 13.3 | 12.1 | 18.4 | 18.3 | 17.2 |
| NNPA % | 8.4 | 7.6 | 11.2 | 10.6 | 8.9 |
| Slippages % | 3.4 | 2.8 | 28.6 | 7.1 | 5.2 |
| Writeoffs % | 0.9 | 0.8 | 0.7 | 5.3 | 2.2 |
| PCR % | 40.0 | 40.8 | 43.8 | 47.1 | 52.9 |
| Loan Growth % | 4.2 | 17.2 | 3.4 | 3.9 | 5.0 |
| CASA Ratio % | 44.4 | 45.5 | 43.9 | 42.6 | 43.0 |
| NIM % | 2.6 | 2.5 | 1.9 | 3.0 | 2.5 |
| Cost of Funds % | 5.0 | 5.0 | 4.8 | 5.0 | 5.1 |
| ICICI Bank | Q2FY18 | Q3FY18 | Q4FY18 | Q1FY19 | Q2FY19 |
|---|---|---|---|---|---|
| GNPA % | 7.9 | 7.8 | 8.8 | 8.8 | 8.5 |
| NNPA % | 5.0 | 4.7 | 5.4 | 4.7 | 4.1 |
| Slippages % | 3.9 | 3.5 | 12.3 | 3.1 | 2.3 |
| Writeoffs % | 1.9 | 1.4 | 2.7 | 2.0 | 0.8 |
| PCR % | 45.8 | 48.3 | 48.4 | 54.8 | 59.5 |
| Loan Growth % | 6.3 | 10.5 | 10.4 | 11.3 | 12.8 |
| CASA Ratio % | 49.5 | 50.4 | 51.7 | 49.5 | 49.2 |
| NIM % | 3.3 | 3.1 | 3.2 | 3.2 | 3.3 |
| Cost of Funds % | 4.9 | 4.8 | 4.6 | 4.7 | 4.8 |
- As you can see, the Gross Non-Performing Assets (GNPA) and Net Non-Performing Assets (NNPA) for Punjab National Bank are ~2x of that for ICICI Bank, but are now showing signs of decline i.e. improvement. Hence one can say that ICICI Bank is ~2x better here in this case.
- When it comes to Slippages, Loan Growth and Writeoffs, ICICI Bank is ~2.25x, ~2.5x and ~2.75x better than PNB.
- The Net Interest Margin is catching up for PNB and is now en route to converge with ICICI Bank at ~3-3.3%, which shows that PNB is maintaining its Yields and Costs fairly in line with that of its private peers.
- The Provision Coverage Ratio (PCR), one of the most important ratios in times like these, when the ambiguity has been at its peak in terms of loans going sour. The PCR gives an indication of the provision made against stressed assets. Higher the PCR, lower is the unexposed part of the stressed assets. Ratios for both banks have been en route to converge where PNB has made significant efforts to hedge its sour advances over the past 5 quarters. The PSU has now covered more than half of its stressed assets and is continuing on the same path.
Therefore, when we take a look at these numbers with a microscope, we can very safely say that ICICI Bank is ~3 times better than PNB. And why? Simply because it better manages its loans! So, what does their market valuations have to say about this better management by ICICI Bank? What premium does ICICI Bank enjoy for this better management?
Let us understand that with this very interesting ratio called Market Capitalization/Total Loans or Total Advances. This ratio shows much the market values the banks for every rupee of the loan that they have provided. Here are the numbers:
| PNB | Ratio | |
|---|---|---|
| Market Cap (Rs. Crs) | 29650 | 6.88% |
| Advances (Rs. Crs) | 4.31L |
| ICICI Bank | Ratio | |
|---|---|---|
| Market Cap (Rs. Crs) | 235250 | 43.17% |
| Advances (Rs. Crs) | 5.45L |
From the numbers in the ‘ratio’ column, we can infer that the market values the loans provided ICICI Bank, more than, way more than that of PNB. And how more? Almost 6.5 times more!!! Based on the metrices that we just referred to earlier, we had safely said that ICICI Bank is ~3 times better than PNB.
Now emulating the logic to the TOP 5 PSU banks and their TOP 5 private peers:
| Market Cap (Rs. Crs) | Advances (Rs. Crs) | Ratio (MC/Adv) | ||
|---|---|---|---|---|
| HDFC Bank | 5.76L | 7.51L | 76.79% | Average: 55.93% |
| ICICI Bank | 2.35L | 5.45L | 43.20% | |
| Axis Bank | 1.61L | 4.56L | 35.23% | |
| Yes Bank | 41.9k | 2.40L | 17.50% | |
| Kotak Mahindra Bank | 2.40L | 2.24L | 106.92% | |
| BoB | 32.01k | 4.34L | 7.38% | Average: Just 8% |
| PNB | 29.65k | 4.31L | 6.88% | |
| Canara Bank | 20.21k | 4.09L | 4.93% | |
| SBI | 2.71L | 19.57L | 13.81% | |
| Indian Bank | 11.7k | 1.67L | 7.01% | |
The average of the Market Capitalization/Total Loans or Total Advances for private banks is almost 7 times more than their public peers. This shows clear undervaluation from the market’s perspective and a classic example of a stock over-correction! BUT IS THIS JUSTIFIED? According to us, NO, NOT AT ALL!
Let us take another perspective to corroborate this analysis. Banks in India have not witnessed a worse year than the current one. But RBI’s taking-the-bull-by-its-horns approach for the cleanup of NPAs by forcing banks to recognize them and provide for them has taken a toll on profitability. Hence, PAT is not a true measure for gauging the operational efficiency of banks vs how the market values them. We can form another ratio using the PPOP (Pre-Provision Operating Profit) which reflects the true current functioning of the banks, and the market capitalization.
| PPOP- H1FY19 (Rs. Crs) | Market Cap (Rs. Crs) | Ratio (PPOP/MC) (Half Year of FY19) | ||
|---|---|---|---|---|
| HDFC Bank | 12.13k | 5.76L | 3.14% | Average (H1FY19): Just 5.27% |
| ICICI Bank | 11.06k | 10.52% | 4.70% | |
| Axis Bank | 8.47k | 9.71% | 5.27% | |
| Yes Bank | 4.82k | 18.48% | 11.50% | |
| Kotak Mahindra Bank | 4.12k | 2.98% | 1.72% | |
| BoB | 6.09k | 32.01k | 19.03% | Average (H1FY19): 19.93% |
| PNB | 7.03k | 34.72% | 23.72% | |
| Canara Bank | 5.26k | 47.45% | 26.04% | |
| SBI | 25.88k | 22.02% | 9.58% | |
| Indian Bank | 2.49 | 42.74% | 21.27% | |
This table shows how undervalued the profits of PSU banks are before they provide for their stressed assets. End of the day, it is the profits and nothing else that matters to the shareholders and those profits are exactly what drive the market capitalization of any company including a bank. The ratio given in the aforementioned table shows that the market values the PPOP of private banks almost 4 times more than the PSU banks!!!
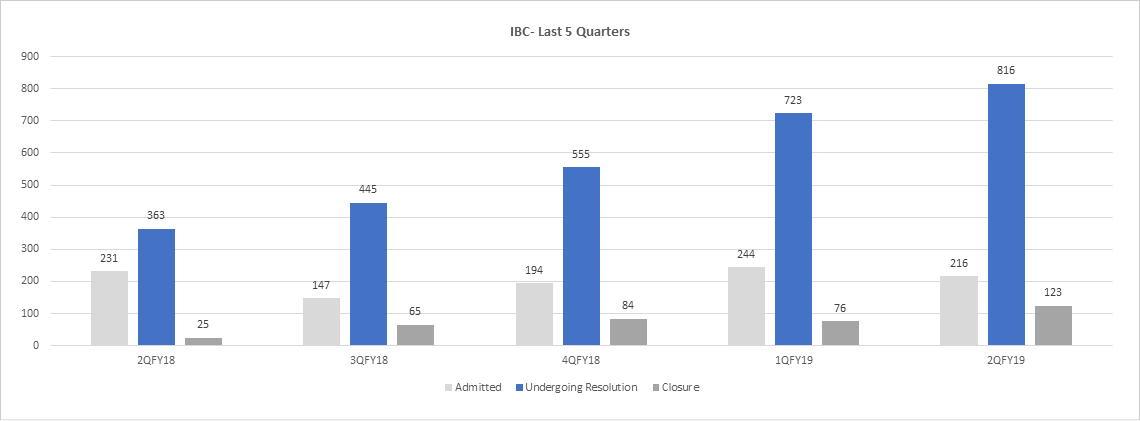
The RBI and the Finance Ministry have taken a lot of measures to address the issue of NPAs. The Insolvency and Bankruptcy code (IBC) which subsumed the loophole ridden Strategic Debt Restructuring (SDR) is finally seeing, at least some success. From January 2017 to September 2018, almost 1200 cases have been registered with the IBC of which, 52 have an approved Resolution Plan, 212 underwent liquidation and 816 undergoing the Resolution Planning.
Of the 18 cases yielding resolution in the July-September 2018 quarter via IBC, the Financial Creditors have realized ~27% of the claims that they had admitted. The IBC enabled recovery helped PSU banks get back ~Rs. 60,800 in in H1FY19, which is simply huge, i.e. ~7% of total stressed asset value of ~Rs. 9.6 lakh crores. The RBI’s FSR released at the end of December 2018 clearly indicated that the banking sector is on course to recovery and the worst of the NPA crisis is now over and bettering of the IBC on a frequent basis is setting the field for a favourable long run oversight for the battered Indian PSU banking stocks. This will give banks more breathing space for lending and improve their ability to raise more capital. Have a look at the performance of the IBC in the last 5 quarters till 2QFY19.
And this is now slowly reflected in the GNPA ratio of PSU banks which are improving way better than their private peers (although one can argue that PSU banks have a better base to work on, but the key takeaway is that the former are working to getting better). As we can see in the table given below PNB, Canara Bank, SBI and Axis Bank have had the best performance improvement in the 2 quarters post FY18.
| GNPA% FY18 | GNPA% H1FY19 | Change (bps) | |
|---|---|---|---|
| HDFC Bank | 1.3% | 1.3% | 0 |
| ICICI Bank | 8.8% | 8.5% | -30 |
| Axis Bank | 7.0% | 6.0% | -100 |
| Yes Bank | 1.3% | 1.6% | 30 |
| Kotak Mahindra Bank | 2.0% | 1.9% | -10 |
| BoB | 12.3% | 11.8% | -50 |
| PNB | 18.4% | 17.2% | -120 |
| Canara Bank | 11.8% | 10.6% | -120 |
| SBI | 10.9% | 10.0% | -90 |
| Indian Bank | 7.8% | 7.2% | -60 |
The government injected Rs. 1.23 lakh crores in the past 3 years, but more than 70% of that was absorbed into losses. It therefore raised its infusion plan for FY19 to Rs. 1.06 lakh crores from Rs. 65,000 crores. This may still fall short, but it is better than leaving them high and dry. Hence, firstly, the PSU banks would have to get over with the provision baggage for fraud loan accounts and thereafter adequately capitalize themselves (by the way of equity capital infusion by Govt or through QIP route or by selling stakes in non-core assets like they are doing right now). This is also complemented by the increase in flow of deposits in the banks relative to the pace of growth in the advances. We have compiled the Deposits vs Advances of all Non-PCA PSU Banks (those banks not under RBI’s Prompt Corrective Action avoided, as their advances have been restricted to an extent and have seen a massive decline in deposits’ growth)
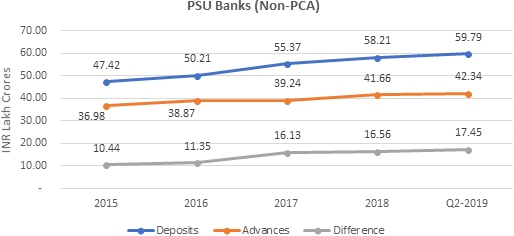
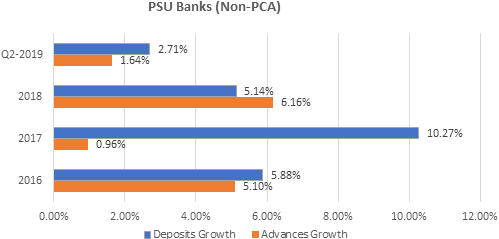
As you can see from the charts above, the growth in deposits have almost every time surpassed the growth in advances, at least in the 4 years. The banks were reluctant to lend due to loans going sour. But with proper risk management mechanisms in place now, NPA formation slowing, alongside RBI’s chip over their shoulders, the PSU banks are relatively plush with liquidity and all set to regain the market share back from their private peers.
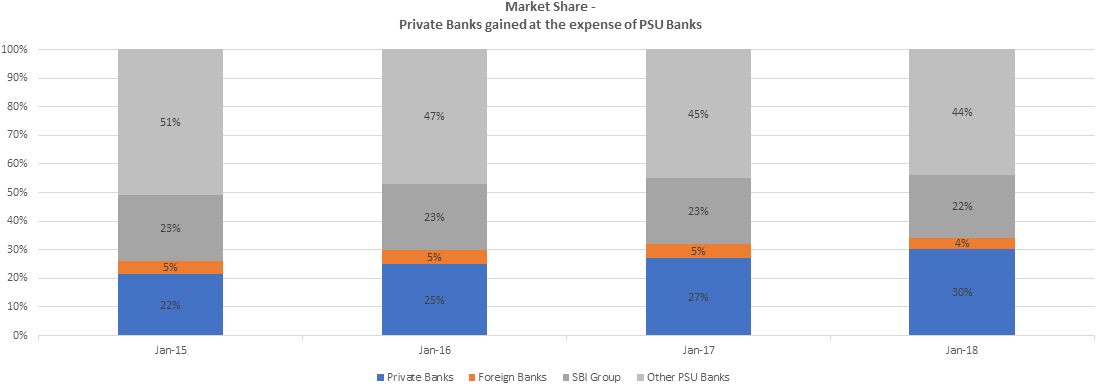
Summarizing the entire analysis, yes, private banks are better than their PSU peers at almost every efficiency parameter. Be it GNPA %, be it market share, be it advances growth, be it slippages or be it, simply the image of the bank itself. But is the market overdoing it by being this cautious with them or is this battering justified. With the improving NPA scenario and a well-positioned balance sheet with healthy PCRs and deposits growth, we think that these are dirt cheap valuations for them.
We at StockAxis are always on the lookout for value stocks enabling our investor clients to build sustainable long-term wealth and not push them into the disasters of day trading or derivatives. And the former is exactly what the Indian PSU banks are offering to long term investors. Like Phillip Fisher wisely said, "The stock market is filled with individuals who know the price of everything, but the value of nothing." Which side of the table do you want to be at? Do let us know your views on this in the comments section.
Happy Investing!


