Vijaya Diagnostic Centre Ltd
Quarterly Result - Q2FY25
Vijaya Diagnostic Centre Ltd
Hospital & Healthcare Services
Current
Previous
Stock Info
Shareholding Pattern
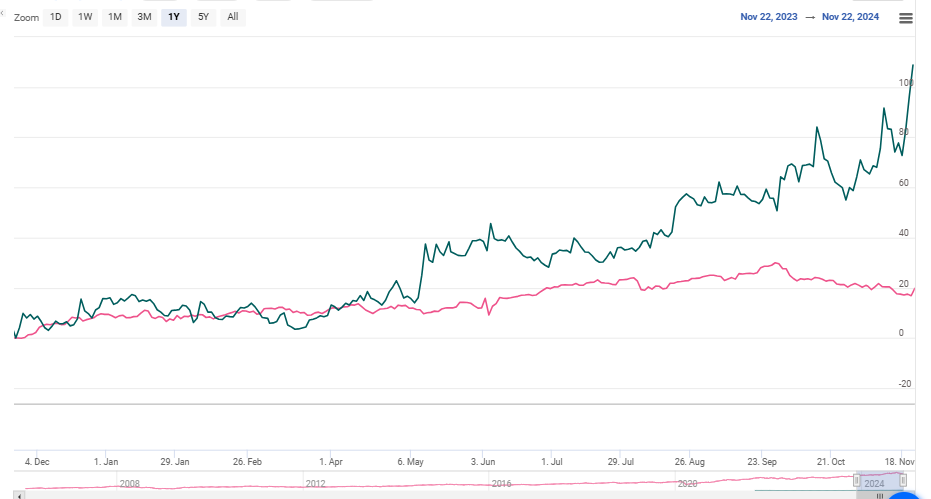
Price performance
Indexed Stock Performance

Financial Highlights:
| Particulars (Rs. in cr) | Q2FY25 | Q2FY24 | YoY (%) | Q1FY25 | QoQ (%) |
|---|---|---|---|---|---|
| Revenue from operations | 183.00 | 139.00 | 32.00% | 156.00 | 17.00% |
| EBITDA | 76.00 | 57.00 | 32.00% | 61.00 | 24.00% |
| EBITDA Margin (%) | 41.50% | 41.30% | 22 bps | 39.20% | 234 bps |
| PAT | 42.00 | 34.00 | 26.00% | 32.00 | 34.00% |
| EPS (Rs.) | 4.08 | 3.25 | 26.00% | 3.05 | 34.00% |
Source: Company Filings; stockaxis Research
Q2FY25 Result Highlights
Vijaya Diagnostics Centre Ltd. delivered another impressive quarter with strong
growth across its key metrics. Consolidate revenue from operations grew 32% YoY,
primarily driven by volume growth of 30% YoY and footfall growth of 24% YoY, with
contributions coming from both the existing and newly launched centres. Gross margins
saw a decline of 80 bps YoY and 56 bps QoQ, due to elevated raw material costs that
rose 40% YoY and 23% QoQ. Consolidated EBITDA came in at 76cr, up 32% YoY and 24%
QoQ, mainly driven by higher revenue growth. Consequently, the EBITDA margins expanded
by 22 bps YoY and 234 bps QoQ. Profit after tax stood at 42.14cr, up 26% YoY and
34% QoQ, (Q2FY24: 33.57cr, Q1FY25: 31.51cr).
Vijaya Diagnostic Centre Limited (VDCL) reported a strong operational performance in Q2 FY25. The growth was primarily volume driven, with contributions coming both from existing and newly launched centres, which are breaking even more quickly while maintaining a strong B2C shift. On the operational front:
- The company conducted 3.95 million tests, a 30.5% YoY and 16.9% QoQ increase.
- Total footfall reached 1.13 million, up 24.3% YoY and 17.5% QoQ.
- Tests per footfall rose 5.0% YoY to 3.49, though slightly declined 0.5% QoQ.
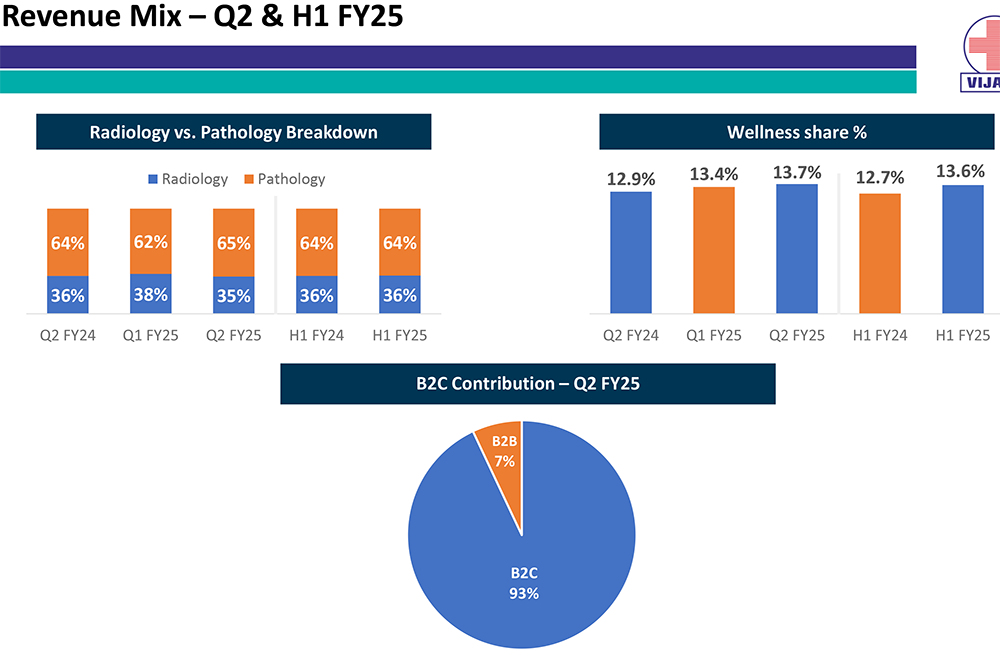
- The average realization per test was Rs.463, which is up 1.0% YoY, and revenue per patient footfall was Rs.1616, which is a 6.0% YoY increase. The wellness segment contributed 13.7% to revenue, growing 6.2% YoY. B2C revenue accounted for 93-96% of earnings, with radiology at 35%. Outsourced tests were under 0.5% of total tests.
Segment Performance
- In Q2Y25, the Radiology revenues accounted for 35% of the total revenues, while pathology accounted for the balance 65%.
- The Wellness segment generated revenues of 22.5cr, accounting for 13.7% of the total revenue, while B2C revenues accounted for 93-96% of total revenue.

Key Conference call takeaways
Guidance:
i) Capex: Guidance to open 10 new hub centres in FY25 and
FY26, with an estimated capex outlay of Rs 200cr (40cr was spent in
H1FY25), (ii) Management targets 15-16% growth while maintaining 40% EBITDA margins,
(iii) Test per footfall should stay in the range of 3.4-3.5 going forward, (iv)
The mix of wellness should remain in the same 13-14% range.
Key Takeaways
PH Pune revenue:
Q2FY25 revenues stood at Rs. 12.2cr, with 40% EBITDA margins.
Wellness Revenues
Q2FY25 revenues 22.5cr
Flagship centres
The flagship centres generate about per 60cr of revenue per year (~5cr month). This
is less than 10% of the consolidated revenues of the company.
Capex
- 4 or more hubs to be opened till Q1FY26.
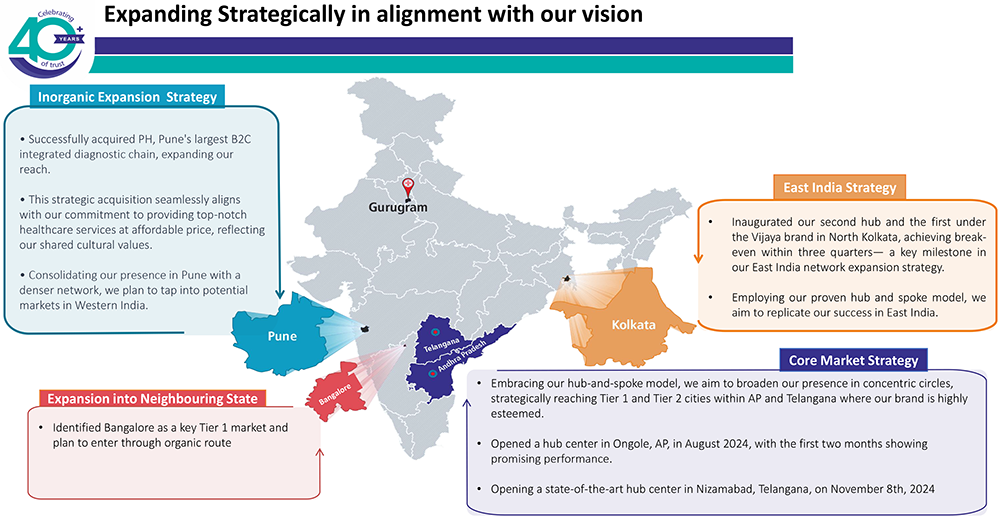
- The expansion includes entering Bangalore organically, upgrading a Gurgaon spoke center to a hub (with the addition of MRI and CT machines), and opening new centres in Pune and Kolkata in the next 2-3 quarters.
- Considering the growing demand for oncology testing and advanced radiology, PET/CT facilities were introduced in Tirupati and a second MRI at Kurnool.
- 75% of the capex announced (Rs. 200cr) will be towards purchase of radiology equipment, while the rest will be towards, infrastructure, software, computers etc.
Near-term challenges
- The gross margins have seen a slight decline due to changes in test mix and higher focus on wellness.
- The Kolkata centres were affected by strikes and regional disruptions which led to a loss of revenue worth 20-25 days.
- Any issues in execution of the proposed expansion plans.
Technological Initiatives
- The AI power pack is implemented across the entire network, where the doctors get a specialized expertise report, by integrating datapoints like doctor skillset and science cases. This is a web-based platform with AI capabilities.
Debt
- Debt-Free: Company remains debt-free with a Rs. 2250 million cash surpluses.
Medinova Diagnostic services integration
- The Medinova acquisition is expected to be completed by May or June 2025 and awaits regulatory approval.
Future Strategies
- Execution of the hub and spoke model within Tier 1 and 2 cities in AP and Telangana. A state-of-the-art hub center was opened in Telangana on November 8th, while another center was opened in Nizamabad (8000-9000sqft) on the 13th.
- Expanding into the adjacent market of Karnataka via Bengaluru.
- Integration of MDSL (Medinova Diagnostice Services Ltd) and PH Pune into the core business.
- Expansion of the spokes in core strategic regions of Hyderabad, Pune, Bengaluru, Kolkata & Gurgaon.
- Focus on driving organic growth from existing centres
Other Key Points
- The Gurgaon centre is a large 12000 sqft center with diagnostics cum wellness facilities.
Break Even
- The break-even period outside the core geography is 3-4 quarters.

Outlook & valuation
Vijaya Diagnostic Centre reported strong earnings growth in Q2FY25. Vijaya’s integrated model providing both radiology and pathology coupled with high B2C mix and adoption of the latest confidence instills greater confidence in its growth potential. Its confidence to grow in double digits in its core Hyderabad market is comforting while its expansion in high growth potential geographies such as Pune and Kolkata should accelerate its growth. We believe it is poised to win in new markets given strong B/S, integrated play, high B2C mix and latest technologies. Moreover, receding pricing pressures bodes well for the overall sector.
Considering improving growth visibility, expansion in fast growing geographies, management’s execution track record, receding pricing pressures, the confidence of double-digit volume growth, high brand recall, robust technical capabilities, and leading position in India’s high growth diagnostics market, the stock is poised for rerating. At a CMP of Rs.1040, the stock is trading at 48x FY26E EV/EBITDA. We maintain HOLD rating on the stock.
Consolidated Financial statements
Profit & Loss statement
| Particulars (Rs. in cr) | Q2FY25 | Q2FY24 | YoY (%) | Q1FY25 | QoQ (%) |
|---|---|---|---|---|---|
| Revenue from operations | 183.00 | 139.00 | 32.00% | 156.00 | 17.00% |
| Cost of raw materials consumed | 23.00 | 16.00 | 41.00% | 19.00 | 23.00% |
| Gross Profit | 160.00 | 123.00 | 31.00% | 137.00 | 16.00% |
| Gross Margin (%) | 87.43% | 88.23% | (80) bps | 88.00% | (56) bps |
| Employee Benefit expense | 28.00 | 22.00 | 28.00% | 27.00 | 2.00% |
| Other expenses | 56.00 | 43.00 | 30.00% | 49.00 | 15.00% |
| EBITDA | 76.00 | 57.00 | 32.00% | 61.00 | 24.00% |
| EBITDA Margin (%) | 41.50% | 41.30% | 22 bps | 39.20% | 234 bps |
| Depreciation and amortisation expenses | 17.00 | 14.00 | 23.00% | 17.00 | 1.00% |
| EBIT | 59.00 | 44.00 | 35.00% | 45.00 | 33.00% |
| Finance cost | 6.00 | 6.00 | 11.00% | 6.00 | 3.00% |
| Other Income | 5.00 | 7.00 | -33.00% | 4.00 | 27.00% |
| PBT | 57.00 | 45.00 | 28.00% | 42.00 | 37.00% |
| Tax expenses | 15.00 | 11.00 | 37.00% | 10.00 | 45.00% |
| PAT | 42.00 | 34.00 | 26.00% | 32.00 | 34.00% |
| EPS (Rs.) | 4.08 | 3.25 | 26.00% | 3.05 | 34.00% |