Shyam Metalics And Energy Ltd
Quarterly Result - Q3FY25
Shyam Metalics And Energy Ltd
Steel & Iron Products
Current
Previous
Stock Info
Shareholding Pattern
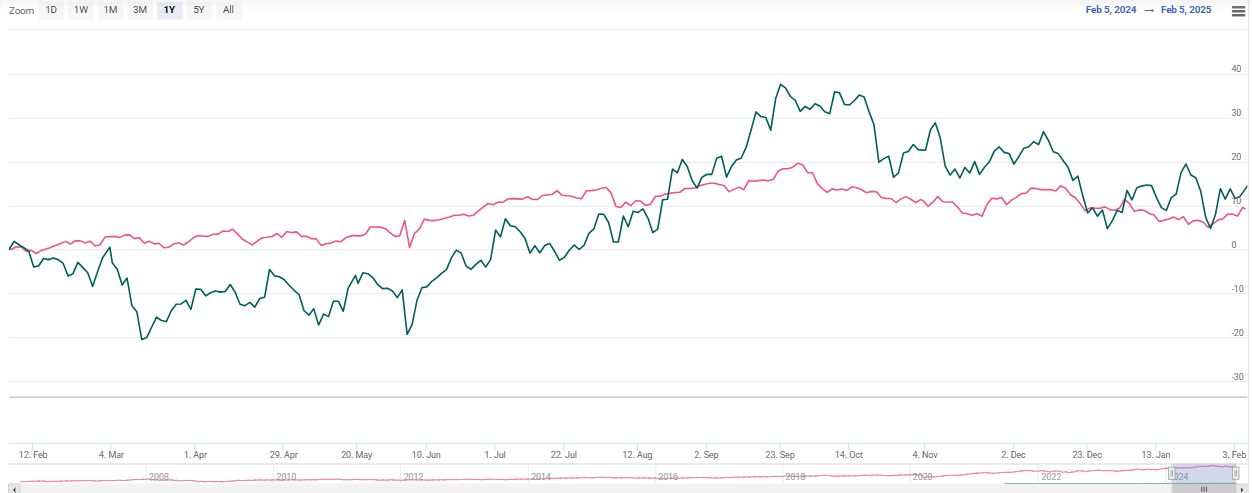
Price performance
Indexed Stock Performance

Financial Highlights:
| Particulars (Rs. in cr) | Q3FY25 | Q3FY24 | YoY (%) | Q2FY25 | QoQ (%) |
|---|---|---|---|---|---|
| Revenue from operations | 3753.00 | 3315.00 | 13.00% | 3634.00 | 3.00% |
| EBITDA | 456.00 | 407.00 | 12.00% | 407.00 | 12.00% |
| EBITDA Margin (%) | 12.15% | 12.28% | (13 bps) | 11.20% | 95 bps |
| PAT | 197.00 | 126.00 | 56.00% | 216.00 | -9.00% |
| EPS (Rs.) | 7.10 | 4.95 | 43.00% | 7.76 | -9.00% |
Source: Company Filings; stockaxis Research
Q3FY25 Result Highlights
Shyam Metalics delivered robust financial performance for the quarter ended Q3FY25
despite macroeconomic challenges. Consolidated revenue grew 13% YoY and 3% sequentially
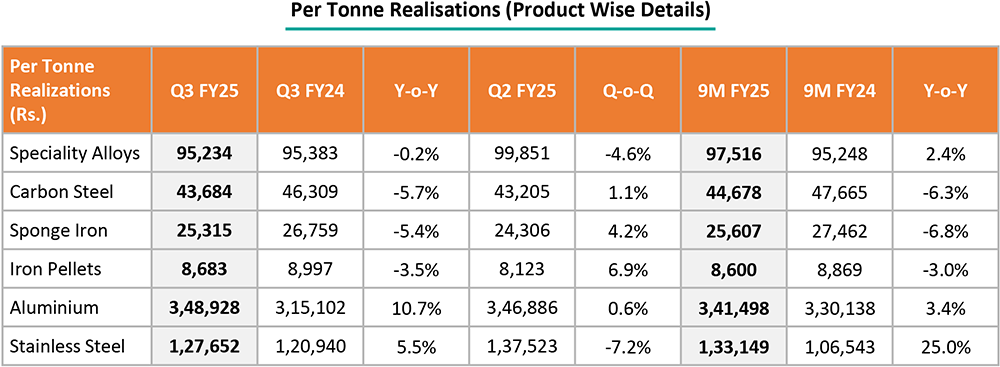
to Rs.3753 cr. Higher blended steel and sponge iron prices (up Rs.800/t QoQ to Rs.37,669)
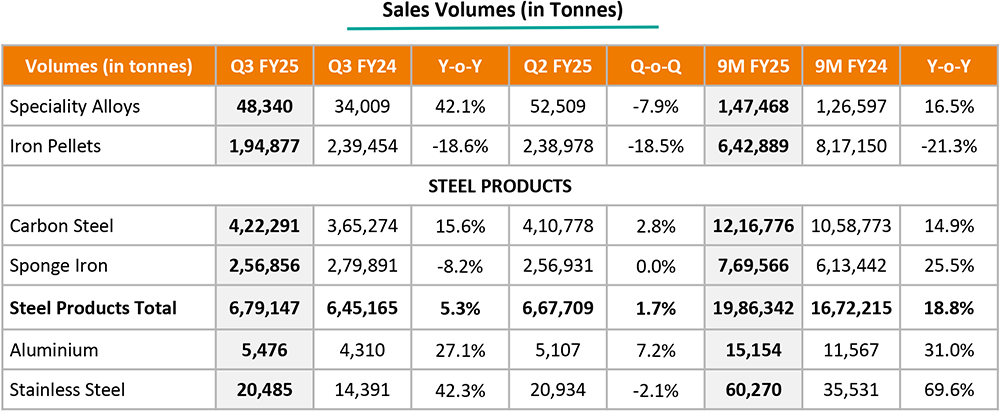
were supported by 6% QoQ volume growth to 706kt (pig iron started contributing from
Q3FY25). The carbon steel volume (finished steel + billets) increased 2.8% QoQ to
422kt. Pellets, ferro alloys and stainless steel recorded a decline in revenue QoQ
amid lower volume. Consolidated EBITDA grew 12% QoQ to Rs.456 cr. Besides higher
revenue, lower coal cost (down by Rs.550/t QoQ) also aided EBITDA expansion. It
reported an improvement in EBITDA/t in metalics (up 37% QoQ to Rs.1,897/tn) as well
as carbon steel (up 20% QoQ to Rs.5,815/t) and aluminium segment (up 25% QoQ to
Rs.36,415/t). Lower prices of ferro alloys and stainless steel pulled its profitability
down QoQ. SMEL recorded EBITDA/tn of Rs.6658 (down 5% QoQ) in stainless steel and
Rs.17,331 in ferro alloys (down 17% QoQ). PAT surged 56% YoY to Rs.197 cr.


Key Conference call takeaways
Capex and Operational update
- Capex incurred till 9M FY25: Rs. 5,873 crores which accounts for 59% of the total CAPEX Envisaged i.e., Rs. 10,025 crores out of which Rs. 4,347 crores have been capitalized.
- Procured 17 rakes under Own your wagon scheme from Indian Railways with an investment of Rs. 431 crores, gaining 10% rebate on railway freight.
Key Highlights
- In Q3FY25, average steel prices have increased by ~Rs.480/t QoQ. Till today, prices are flat from Q3FY25 average. However, steel demand is improving on the back of a seasonal pickup.
- Exports stood at 11% of total sales.
- In Q3FY25, it sourced 82% of required power through captive capacity at a cost of Rs.2.46/kwh. Average cost including grid power stood at Rs.3.03/kwh.
- SMEL has commissioned 0.77mtpa blast furnace at the Jamuria plant. It has achieved 34% capacity utilization with sales volume of 27.4kt of pig iron during Q3FY25 at an average realization/t of Rs.33,794/t. The pig iron segment can deliver EBITDA/t of Rs.2,500—3,000/t in FY26.
- It is planning to set up a green aluminium plant with caster in Odisha, fostering backward integration and enhancing special grade of aluminium foil. SMEL is the largest exporter of specialty foils in India.
- It has started capex on setting 0.5mtpa stainless steel flat product capacity. Currently, it is setting up a plant to produce stainless steel coil and has further plans to set up a downstream pipe manufacturing capacity.
- Post commissioning of 0.25mtpa CRM mill in Q3FY25, SMEL is ramping up and recorded CR Coil/Sheet sales volume of 3.7kt at an average realization of Rs.63,346/t in Q3FY25.
Outlook & valuation
Shyam Metalics reported strong financial performance for the quarter ended Q3FY25. The Indian steel industry is poised for robust growth, driven by large scale infrastructure projects, urbanization, and increasing demand from sectors like automotive, capital goods, and defence. With continued government support, technological advancements, and a strong focus on sustainability, the industry is well-equipped to meet global challenges, enhance its competitiveness, and play a central role in India’s economic expansion. Despite global uncertainties, the industry’s focus on securing raw material access, R&D, and innovation ensures that it remains resilient and competitive on the global stage. We believe SMEL's strength lies in identifying efficiencies through both vertical and horizontal integration. It is moving up the value chain from semi-finished to finished products like aluminium foil, color-coated sheets, stainless steel, and ductile pipe in its core segment. This is improving profitability, diversifying the customer base, and lowering margin volatility. At the same time, its backward integration, eg, setting up power plants, blast furnaces, and railway sidings are improving the efficiency of its operations. SMEL is a diversified metals company with a varied product range. Given this, the company can better navigate commodity cycles than its peers. SMEL has strong earnings acceleration visibility against the backdrop of a large capex plan, which will be funded through internal accruals and existing cash.
Shyam Metalics and Energy (SMEL) management's pragmatic approach to moving up the value chain, diversifying products/metals, and backward integration to capture efficiencies make it stand out. The successful foray into new businesses (aluminium and stainless steel products) showcases its execution capabilities; multiple new projects commencing operations in FY25/26 provide strong earnings visibility, while it mitigates profitability risk through diversification. Shyam Metalics offers a unique play in the Indian metals space, with a combination of a) increasing contribution from finished steel and valued added segments and b) diversified business across the steel value chain. The company has executed capacity expansion plans with precision over the past few years. Capital allocation towards niche business segments augurs well for the company. At CMP of Rs.760, the stock is trading at 7x EV/EBITDA of FY26E. We maintain HOLD rating on the stock.
Consolidated Financial statements
Profit & Loss statement
| Particulars (Rs. in cr) | Q3FY25 | Q3FY24 | YoY (%) | Q2FY25 | QoQ (%) |
|---|---|---|---|---|---|
| Revenue from operations | 3753.00 | 3315.00 | 13.00% | 3634.00 | 3.00% |
| COGS | 2716.00 | 2388.00 | 14.00% | 2655.00 | 2.00% |
| Gross Profit | 1037.00 | 927.00 | 12.00% | 979.00 | 6.00% |
| Gross Margin (%) | 27.63% | 27.96% | (33 bps) | 26.94% | 69 bps |
| Employee Benefit expense | 110.00 | 92.00 | 20.00% | 107.00 | 3.00% |
| Other expenses | 470.00 | 428.00 | 10.00% | 466.00 | 1.00% |
| EBITDA | 456.00 | 407.00 | 12.00% | 407.00 | 12.00% |
| EBITDA Margin (%) | 12.15% | 12.28% | (13 bps) | 11.20% | 95 bps |
| Depreciation and amortization expenses | 203.00 | 182.00 | 12.00% | 144.00 | 41.00% |
| EBIT | 253.00 | 225.00 | 12.00% | 263.00 | -4.00% |
| Finance cost | 41.00 | 40.00 | 2.00% | 30.00 | 37.00% |
| Other Income | 51.00 | 40.00 | 28.00% | 75.00 | -32.00% |
| PBT | 263.00 | 226.00 | 16.00% | 307.00 | -14.00% |
| Tax expenses | 66.00 | 100.00 | -34.00% | 91.00 | -27.00% |
| PAT | 197.00 | 126.00 | 56.00% | 216.00 | -9.00% |
| EPS (Rs.) | 7.10 | 4.95 | 43.00% | 7.76 | -9.00% |