PTC Industries Ltd
Quarterly Result - Q1FY25
PTC Industries Ltd
Castings / Forgings
Current
Previous
Stock Info
Shareholding Pattern
Price performance
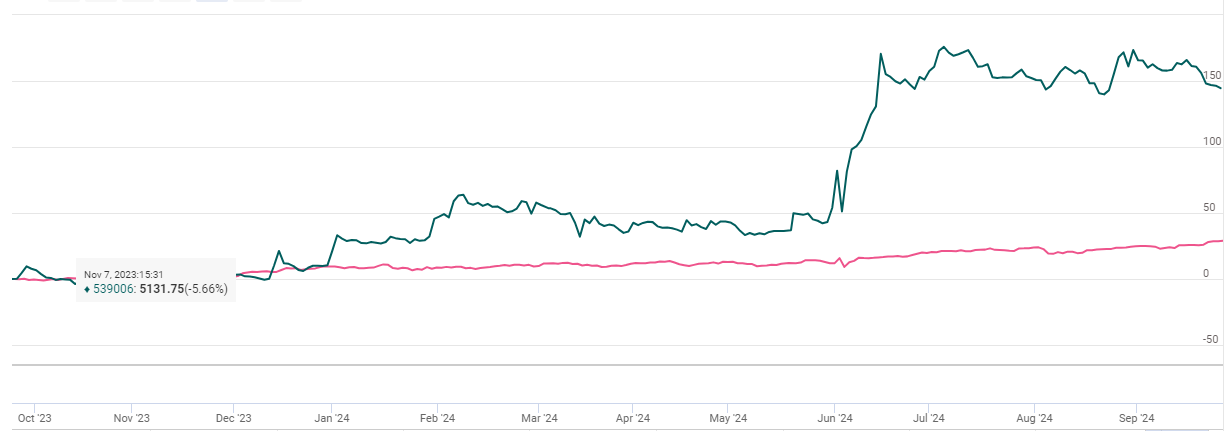
Indexed Stock Performance

Financial Highlights:
| Particulars (in Rs.Cr) | Q1FY25 | Q1FY24 | YoY (%) | Q4FY24 | QoQ (%) |
|---|---|---|---|---|---|
| Revenue from operations | 47.00 | 72.00 | -35.00% | 72.00 | -35.00% |
| EBITDA | 10.00 | 20.00 | -50.00% | 22.00 | -55.00% |
| EBITDA Margin (%) | 21.28% | 27.78% | (650 bps) | 30.56% | (928 bps) |
| PAT | 5.00 | 11.00 | -55.00% | 15.00 | -67.00% |
| EPS (Rs.) | 3.39 | 8.43 | -60.00% | 10.29 | -67.00% |
Source: Company Filings; stockaxis Research
Q1FY25 Result Highlights
PTC Industries (PTCIL) reported a weak quarter in Q1FY25. Consolidated revenue from
operations declined 35% YoY and 35% sequentially to Rs.47 cr, on account of a modest
decline in sales during the quarter, mainly due to near-term volatility in demand,
and other supply chain adjustments. Raw materials as a % of sales increased to 41.4%
vs just 22% in Q1 last year, and 23.8% in Q4FY24. Despite this, the gross margins
saw an improvement of 1362 bps YoY and 928 bps QoQ. EBITDA stood at just Rs.10 cr,
down 50% YoY and 54% QoQ. Profit after tax for the quarter came in at Rs.5
cr vs Rs.11.3cr YoY and Rs.14.7cr QoQ, reporting a decline of 57% YoY and 67% QoQ.
Key Highlights for the Quarter
Ongoing Capex
- A Strategic Materials Technology Complex is being set up at Lucknow, UP Defence Industrial Corridor. The key materials required for such Aero-defence components have already been acquired and are under various stages of installation.
- The site at Lucknow will also house the world’s “largest single-site Titanium recycling and re-melting facility”. The site can produce Nickel/Cobalt Super Alloys for Aerospace and Defence applications.
Defense Testing
The company set up the Advanced Materials (Defence) Testing Foundation
in the Defence Industrial Corridor at UP, in collaboration with top defence companies
like Hindustan Aeronautics Limited, Bharat Dynamics Limited, Mishra Dhatu Nigam,
Yantra India Limited, Uttar Pradesh Expressways Industrial Development Authority
and the Government of India, to ensure the highest standards of quality production
for the defense sector by PTCIL.
R&D and Innovation
Casting technology for Single Crystal and Directionally Solidified materials, for
aerospace components, is a recent breakthrough for the company, thereby placing
it on a global stage in the field of aerospace castings.
Outlook & valuation
PTC industries reported weak earnings growth for the quarter ended Q1FY25. Despite the near-term headwinds, we believe that company is well poised for exponential growth. The medium and long-term outlook corroborate to a substantial surge in titanium metal procurement. This uptick is primarily attributed to the robust expansion in the commercial aerospace sector, driven by increased production rates and a favorable composition of titanium-intensive components. Aerospace original equipment manufacturers (OEMs) grapple with intricate supply-chain management, complex design implementations, and extended product lead times. Consequently, they often seek supply chain stability through long-term agreements (LTAs), ensuring extended visibility for significant players like PTC Industries. Currently, the titanium market is poised for the next stage of an upcycle expansion, and the demand for this metal is anticipated to persistently grow throughout the coming decade. PTC Industries stands to benefit significantly from the industry's promising outlook in the medium to long term, as validated by a comprehensive analysis of the prevailing competitive landscape focusing on supply and demand dynamics. The recent Russia-Ukraine crisis, OEMs looking to exercise the China+1 strategy, and India's increasing defence sector indigenization push, all bode well for PTC Industries, which is at an inflection point. We maintain HOLD rating on the stock.
Consolidated Financial statements
Profit & Loss statement
| Particulars (in Rs.Cr) | Q1FY25 | Q1FY24 | YoY (%) | Q4FY24 | QoQ (%) |
|---|---|---|---|---|---|
| Revenue from operations | 47.00 | 72.00 | -35.00% | 72.00 | -35.00% |
| COGS | 6.00 | 19.00 | -68.00% | 16.00 | -63.00% |
| Gross Profit | 41.00 | 53.00 | -23.00% | 56.00 | -27.00% |
| Gross Margin (%) | 87.23% | 73.61% | 1362 bps | 78.00% | 923 bps |
| Employee Benefit Expenses | 8.00 | 8.00 | 0.00% | 9.00 | -11.00% |
| Other expenses | 23.00 | 25.00 | -8.00% | 25.00 | -8.00% |
| EBITDA | 10.00 | 20.00 | -50.00% | 22.00 | -55.00% |
| EBITDA Margin (%) | 21.28% | 27.78% | (650 bps) | 30.56% | (928 bps) |
| Depreciation and amortization expenses | 4.00 | 4.00 | 0.00% | 4.00 | 0.00% |
| EBIT | 6.00 | 16.00 | -63.00% | 18.00 | -67.00% |
| Finance cost | 3.00 | 4.00 | -25.00% | 3.00 | 0.00% |
| Other Income | 4.00 | 3.00 | 33.00% | 4.00 | 0.00% |
| PBT | 6.00 | 15.00 | -60.00% | 19.00 | -68.00% |
| Tax expenses | 1.00 | 4.00 | -75.00% | 4.00 | -75.00% |
| PAT | 5.00 | 11.00 | -55.00% | 15.00 | -67.00% |
| EPS (Rs.) | 3.39 | 8.43 | -60.00% | 10.29 | -67.00% |