PI Industries Ltd
Quarterly Result - Q1FY25
PI Industries Ltd
Pesticides & Agrochemicals
Current
Previous
Stock Info
Shareholding Pattern
Price performance
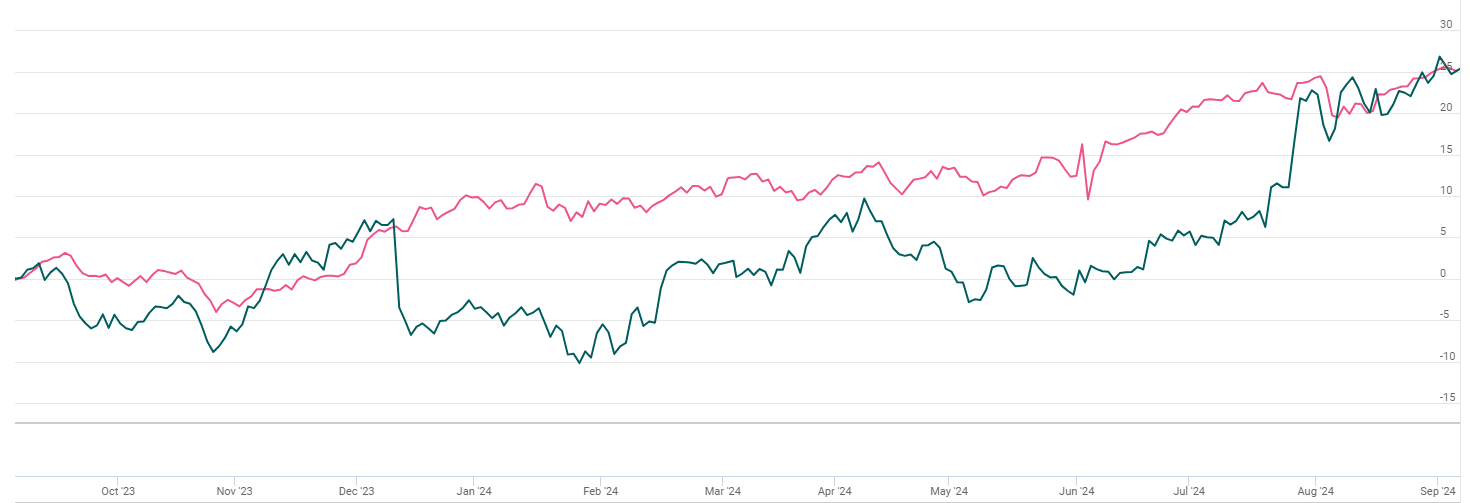
Indexed Stock Performance

Financial Highlights:
| Particulars (Rs. in cr) | Q1FY25 | Q1FY24 | YoY (%) | Q4FY24 | QoQ (%) |
|---|---|---|---|---|---|
| Revenue from operations | 2069.00 | 1910.00 | 8.00% | 1741.00 | 19.00% |
| EBITDA | 583.00 | 467.00 | 25.00% | 442.00 | 32.00% |
| EBITDA Margin (%) | 28.18% | 24.45% | 373 bps | 25.39% | 279 bps |
| PAT | 448.00 | 382.00 | 17.00% | 369.00 | 21.00% |
| EPS (Rs.) | 29.59 | 25.24 | 17.00% | 24.36 | 21.00% |
Source: Company Filings; stockaxis Research
Q1FY25 Result Highlights
PI Industries (PIIND) delivered better than expected earnings growth for the quarter
ended Q1FY25. Consolidated revenue for the quarter increased by 8% YoY to Rs.2069
cr and saw a notable improvement of 19% sequentially. Growth was primarily driven
by biological products, which saw a ~39% y-o-y increase in revenue. EBITDA for the
quarter was Rs. 583 crore, reflecting a 25% y-o-y increase and a 32% q-o-q rise.
Margin expansion is fuelled by CSM products, especially new offerings, as well as
product mix in the domestic market, which is also supported by biologicals. EBITDA
margin stood at 28%, up 370 bps y-o-y and 281 bps q-o-q, due to a favourable product
mix and improved operating leverage. PAT for the quarter stood at Rs. 449 crore,
marking a 17% y-o-y increase and a 21% q-o-q rise
The company reported 14% growth in Agchem Exports mainly driven by volumes and growth of new products. New products growth was ~24% Y-o-Y. Domestic revenues were subdued mainly due to delayed sowing and erratic spread of monsoon although favourable products mix and improved working capital management helped in containing the financial impact. Biologicals products’ driving growth and revenue increased by ~39% Y-o-Y.
Pharma contributed Exports revenue of Rs. 253 million. Dipped due to supply deferment of a few products.
Key Conference call takeaways
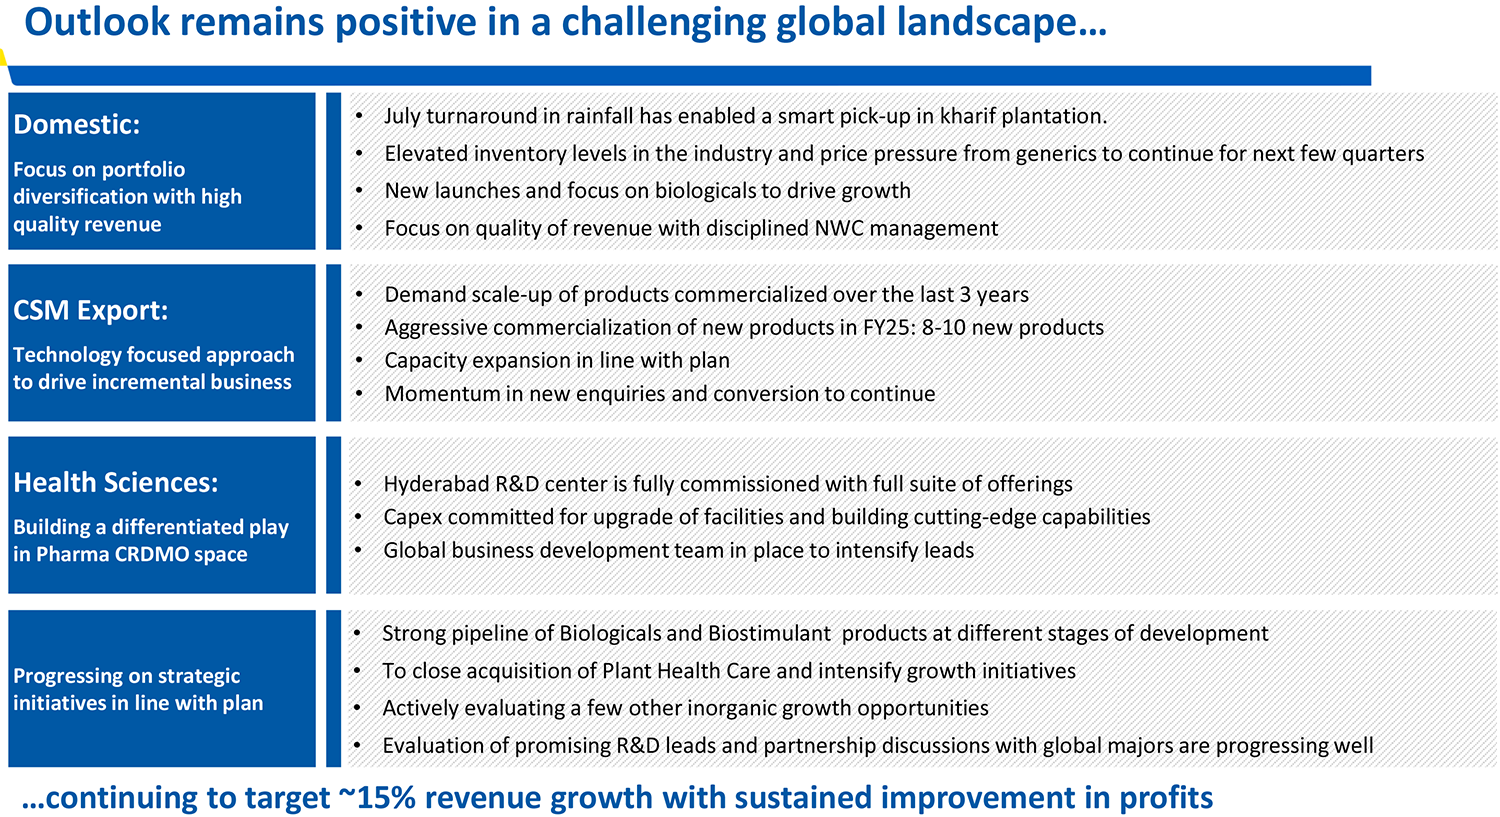
Guidance - Revenue growth to be 15.0%, gross margins to be 50%-51%
with EBITDA margins of 25%-26.0% for FY25E.
Domestic - Domestic biological revenue grew at 39.0% Y-o-Y in Q1FY25 (~15% of domestic revenue in FY24). This is also driven by horticulture, Jivagro, delivering a good performance.
Agrochemicals demand is good over long-term as it is supported by Central government, advanced mechanization and technology used on the fields.
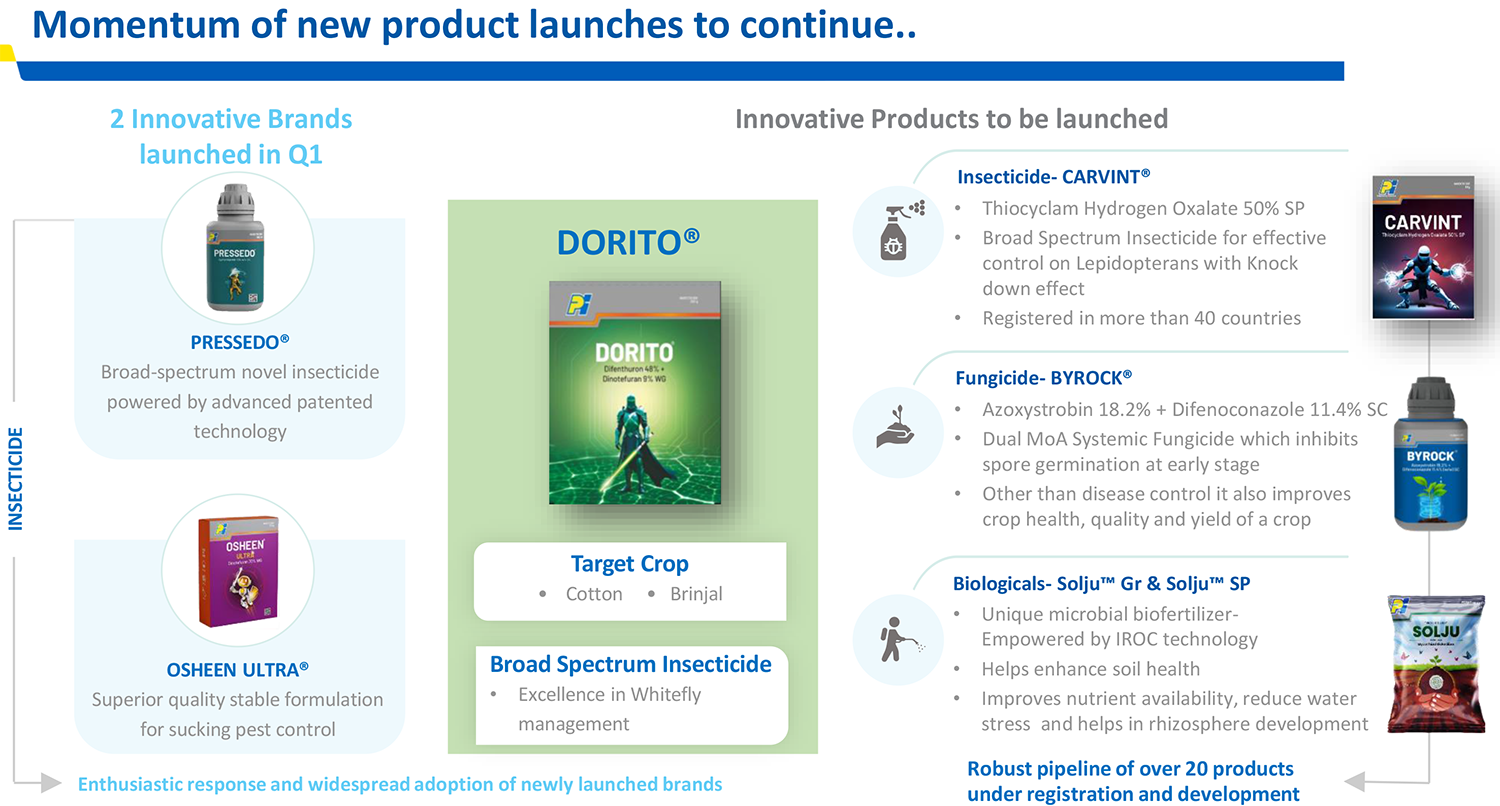
PIIND has launched PRESSEDO, a patented broad spectrum novel insecticide and OSHEEN ULTRA, a pesticide in Q1FY25, to give visibility in the coming years.
Acquisition of Plant Health Care (PHC) is expected to provide the peptide technology platform by which it can introduce biological products, globally. The acquisition is likely to get over in Q2FY25E.
Exports
The company continues to see strong traction in new products in exports market.
New products contributed over 20% of exports revenue in Q1FY25.
Order book is around USD 1.50-1.55 Bn, as of Q1FY25.
Progressing well in the R&D pipeline for the early stage molecules in CSM which is expected to get commercialized.
In Q1FY25, the company has commercialized 2 new molecules and to commercialize another 6-7 products for the sustained growth trend in the rest of FY25E. The new products will be a mix of AgChem, electronic chemicals, and other specialty chemicals.
Out of the new enquiries nearly 50% belongs to non Ag-Chem, which should help it to diversify revenue streams.
Non-agrochemicals revenue share could be 5% and has a significant potential to scale up over a period of time.
Pharma
PIIND is creating a CRDMO in order to cater to a global innovator client’s
need to augment infrastructure as well to cater to the business development. The
momentum for the same is expected to scale up gradually over the next couple of
years.
In Q1FY25, the company faced inventory overstocking at client’s end leading to muted performance, which may continue until Q2FY25E.
The company has operationalized Hyderabad Research facility while its GMP Kilo Lab in Lodi is nearing completion and then will move to certification.
Other Key Takeaways
The company has outlined a capex plan of Rs. 800-900 crore for the year, as previously
indicated. This investment will be allocated towards new projects, expanding capacities,
and enhancing capacity utilisation and throughput through technological advancements.
The effective tax rate (ETR) for FY2025 is projected to be approximately 22-23%.
The acquisition of Plant Healthcare was highlighted, granting access to an advanced peptide technology platform that enables the introduction of new biological products on a global scale.
The company introduced two innovative brands: Placero, a patented broad-spectrum insecticide, and Shinalpha, a highquality stable formulation designed for controlling sucking pests.
Cromper and Paramide are promising new products, signalling strong growth potential in the coming years.


Outlook & valuation
Industries reported a beat in earnings for the quarter ended Q1FY25. We believe that PI Industries is poised to deliver strong growth in the coming quarters driven by a robust CSM order book, the ramp-up of nine products commercialised over the past year, and the introduction of new products in FY2025. PI’s pharma foray would diversify its earnings stream and drive medium to long-term growth for the company. Demand remains encouraging in both domestic (strong Rabi season outlook) and export markets (order book of USD1.8 billion) and the company has guided for 20% revenue growth.
Looking ahead, PIIND expects to capitalize on its diverse product portfolio and strong order book to drive future growth. Additionally, PIIND’s prudent cost management and focus on enhancing operational efficiencies bode well for its profitability. The company’s strategic focus on expanding its presence in the CSM business and the pharmaceutical segment, along with its commitment to sustainable business practices, further strengthens its long-term growth prospects. At CMP of Rs.4535, the stock is trading at 34x FY26E. We maintain HOLD rating on the stock.
Consolidated Financial statements
Profit & Loss statement
| Particulars (Rs. in cr) | Q1FY25 | Q1FY24 | YoY (%) | Q4FY24 | QoQ (%) |
|---|---|---|---|---|---|
| Revenue from operations | 2069.00 | 1910.00 | 8.00% | 1741.00 | 19.00% |
| COGS | 998.00 | 1022.00 | -2.00% | 804.00 | 24.00% |
| Gross Profit | 1071.00 | 888.00 | 21.00% | 937.00 | 14.00% |
| Gross Margin (%) | 51.76% | 46.49% | 527 bps | 53.82% | (206 bps) |
| Employee Benefit expenses | 200.00 | 174.00 | 15.00% | 178.00 | 12.00% |
| Other expenses | 288.00 | 247.00 | 17.00% | 317.00 | -9.00% |
| EBITDA | 583.00 | 467.00 | 25.00% | 442.00 | 32.00% |
| EBITDA Margin (%) | 28.18% | 24.45% | 373 bps | 25.39% | 279 bps |
| Depreciation and amortisation expenses | 83.00 | 70.00 | 19.00% | 80.00 | 4.00% |
| EBIT | 500.00 | 397.00 | 26.00% | 362.00 | 38.00% |
| Finance cost | 8.00 | 4.00 | 100.00% | 11.00 | -27.00% |
| Other Income | 73.00 | 47.00 | 55.00% | 58.00 | 26.00% |
| Profit before share of associates | 565.00 | 440.00 | 28.00% | 409.00 | 38.00% |
| Share of profit of associates | - | 5.00 | - | 2.00 | - |
| Tax expenses | 118.00 | 63.00 | 87.00% | 42.00 | 181.00% |
| PAT | 448.00 | 382.00 | 17.00% | 369.00 | 21.00% |
| EPS (Rs.) | 29.59 | 25.24 | 17.00% | 24.36 | 21.00% |