PG Electroplast Ltd
Quarterly Result - Q2FY25
PG Electroplast Ltd
Consumer Durables - Domestic Appliances
Current
Previous
Stock Info
Shareholding Pattern
Price performance
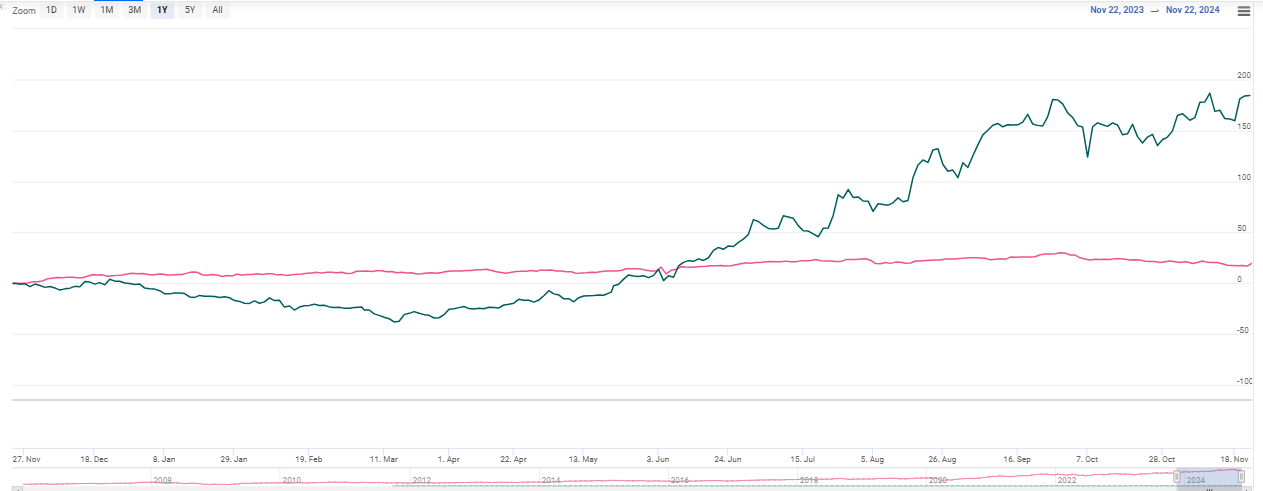
Indexed Stock Performance

Financial Highlights:
| Particulars (Rs. in cr) | Q2FY25 | Q2FY24 | YoY (%) | Q1FY25 | QoQ (%) |
|---|---|---|---|---|---|
| Revenue from operations | 671.00 | 460.00 | 46.00% | 1321.00 | -49.00% |
| EBITDA | 60.00 | 41.00 | 45.00% | 135.00 | -58.00% |
| EBITDA Margin (%) | 8.94% | 8.91% | 3 bps | 10.22% | (128 bps) |
| PAT | 19.00 | 12.00 | 58.00% | 85.00 | -78.00% |
| EPS (Rs.) | 0.74 | 0.50 | 48.00% | 3.21 | -77.00% |
Source: Company Filings; stockaxis Research
Q2FY25 Result Highlights
PG Electroplast (PGEL) continues to deliver strong earnings growth quarter after
quarter. Consolidated revenues in Q2FY25 surged 46% YoY to Rs.671 cr in a seasonally
lean period. Consolidated EBITDA witnessed a solid growth of 45% YoY to Rs.55 cr
while operating margins stood firm at 9% on account of cost efficiencies and operating
leverage. The business continues to exhibit strength on most fronts on the back
of secular tailwinds in the electronics manufacturing industry.
During Q2, the company reported strong growth across its product business, which comprises ACs, washing machines, and air coolers. The product segment contributed 54% of the total revenues in the quarter gone by. While volumes in ACs and air coolers surged 2x, washing machines grew in the range of 15-20%. However, average sales declined on account of lower commodity prices. Meanwhile, the plastics and mould business also grew at a rapid pace in Q2 due to new client addition. Also, the electronics business recorded a 7 fold jump in revenues to Rs.80 cr on a low base.
Key Conference call takeaways
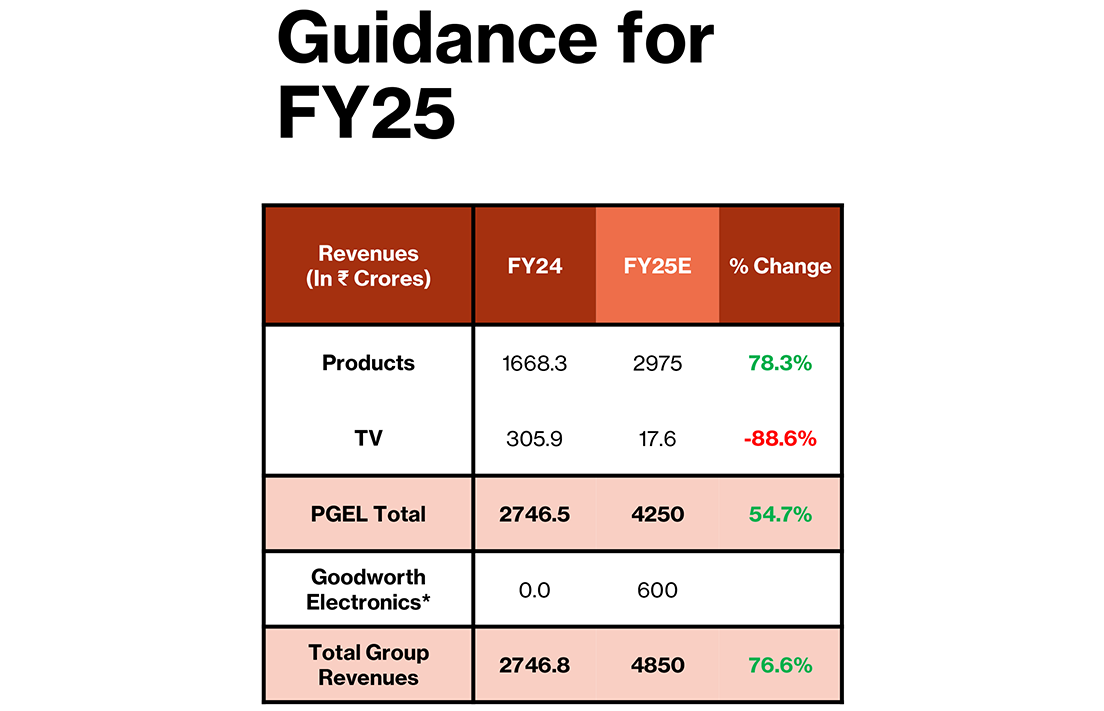
- For PGEL Consolidated Revenue guidance is of at least Rs.4250 crores which is a growth of 54.7% over FY2024 Revenues of Rs.2746.5 crores. This is despite TV business revenues shifting to JV company Goodworth Electronics Ltd.
- For Goodworth, Revenues we expect at Rs.600 crores.
- Implying Group Revenues to be around Rs.4850 crores.
- PGEL’s Net profit guidance of Rs. 250 crores which is a growth of 82.5% over FY2024 Net profit of Rs.137 crores.
- In FY2025, Management expects EBITDA margins to have slight upward bias.
- The growth in product business i.e., WM, RAC and Coolers is expected to be around 78.3% to over Rs.2975 crores from Rs.1668 crores in FY2024.
- Capex for FY2025 will be in the range of 350-380 crores. New Integrated Unit for Manufacturing RAC in Rajasthan, New Building in Greater Noida and new building along with further AC capacity expansion in Supa is being planned.
- Order book for product business remains robust and the company hopes to scale product business significantly in FY2025.
- For FY25, creating building blocks for the next level of growth and improving capital efficiency will be the major priorities. R&D, New Product Development, and Capacity Enhancement are the focus areas for future across product businesses. The company plans to strengthen its product offerings further in both AC and WMs.
- The company is seeing increased opportunities for business from new and existing clients, and we remain very confident about the future growth prospects of the business.

Outlook & valuation
PG Electroplast (PGEL) demonstrated robust earnings growth for the quarter ended Q2FY25 driven by strong growth across all its business segments. We believe that the company is uniquely positioned in the consumer durable & plastics space in India and would derive higher revenue growth by growing its market share in the customer outsourcing wallet. Management foresees large opportunities in plastic moulding in consumer durables in appliances like a) Washing machines b) Room Air Conditioners c) Refrigerators d) Ceiling Fans and e) Sanitaryware products and opportunities in the ODM space for products like a) Air coolers, b) Washing Machines and Room Air conditioners. PGEL will sustain its growth momentum aided by the emerging opportunities in the EMS space like Strong industry tailwinds, Capital expenditure, strong execution capabilities, new product launches, encouraging guidance from the management, improving operational efficiencies leading to better profitability & higher cash flows, established client relationships, Robust order book for product business and diversified product profile.
Government reforms such as Digital India, Make in India, Power for all and Jan Dhan-AadharMobile Trinity are providing fresh impetus to the Consumer appliance and durable Industry. The Rapid rate of urbanization, growth of young population with rising income levels is leading to large emerging middle class in India, implying huge potential demand for the consumer appliance and durable market in coming years. Low penetration levels, falling prices of durables and electronics and changing lifestyle of the Indian consumer are expected to remain big demand drivers for the consumer durable and electronics Industry in India in near future.Further the Government’s initiatives of promoting electronic manufacturing and treating the industry as one of the key pillars of the Digital India Program, opens new and exciting opportunities for the Industry. The Management is enthused about the overall opportunity size and anticipates high growth rates in the industry segments where, company has presence.
Over the long run, PGEL’s business has multiple tailwinds in the form of low penetration of electronics (RACs, WMs) in the country. The company is pursuing an organic growth strategy by ramping up its existing capacity and capabilities in each of its product verticals to achieve higher value addition, and better economies of scale on the back of backward integration. At CMP of Rs.630, the stock is trading at 19x FY26E. We maintain a HOLD rating on the stock.
Consolidated Financial statements
Profit & Loss statement
| Particulars (Rs. in cr) | Q2FY25 | Q2FY24 | YoY (%) | Q1FY25 | QoQ (%) |
|---|---|---|---|---|---|
| Revenue from operations | 671.00 | 460.00 | 46.00% | 1321.00 | -49.00% |
| COGS | 524.00 | 365.00 | 44.00% | 1082.00 | -52.00% |
| Gross Profit | 147.00 | 95.00 | 55.00% | 239.00 | -38.00% |
| Gross Margin (%) | 21.91% | 20.65% | 126 bps | 18.09% | 382 bps |
| Employee Benefit exps | 50.00 | 36.00 | 42.00% | 62.00 | -18.00% |
| Other expenses | 41.00 | 21.00 | 95.00% | 46.00 | -11.00% |
| Other Income | 4.00 | 3.00 | 33.00% | 4.00 | 0.00% |
| EBITDA | 60.00 | 41.00 | 45.00% | 135.00 | -58.00% |
| EBITDA Margin (%) | 8.94% | 8.91% | 3 bps | 10.22% | (128 bps) |
| Depreciation and amortisation | 15.00 | 11.00 | 36.00% | 15.00 | 0.00 |
| EBIT | 45.00 | 30.00 | 48.00% | 120.00 | -66.00% |
| EBIT Margin (%) | 7.00% | 6.52% | 48 bps | 9.08% | (208 bps) |
| Finance cost | 15.00 | 12.00 | 25.00% | 18.00 | -17.00% |
| PBT | 30.00 | 18.00 | 67.00% | 102.00 | -70.00% |
| Tax expenses | 11.00 | 5.00 | 120.00% | 16.00 | -31.00% |
| PAT | 19.00 | 12.00 | 58.00% | 85.00 | -78.00% |
| EPS (Rs.) | 0.74 | 0.50 | 48.00% | 3.21 | -77.00% |