Newgen Software Technologies Ltd
Quarterly Result - Q2FY25
Newgen Software Technologies Ltd
IT - Software Services
Current
Previous
Stock Info
Shareholding Pattern
Price performance
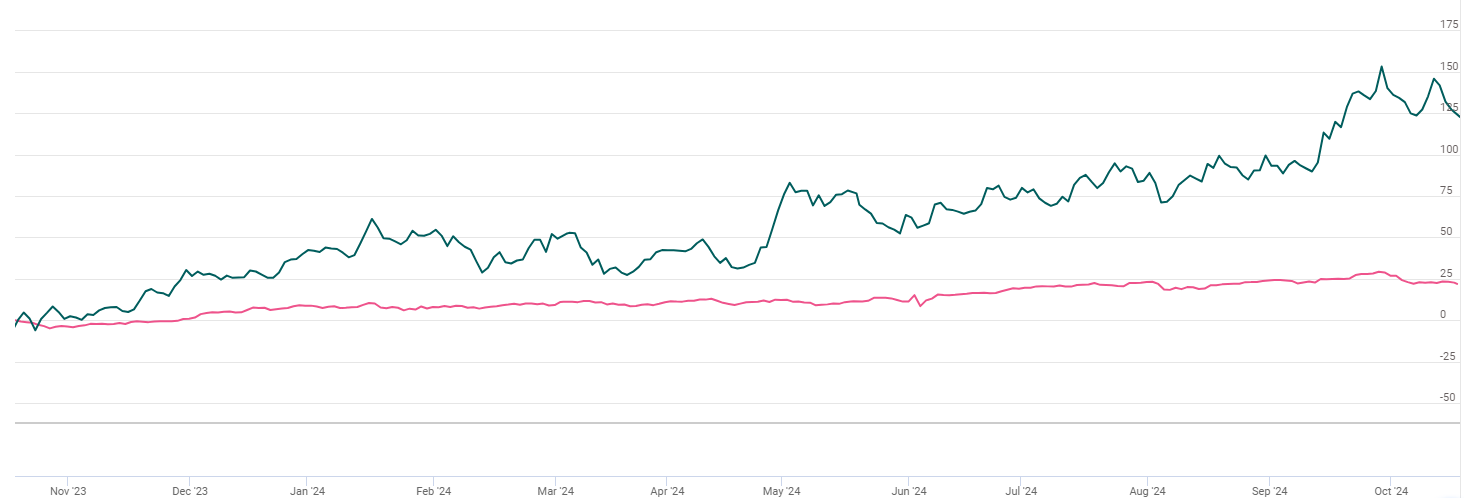
Indexed Stock Performance

Financial Highlights:
| Particulars (Rs. In cr) | Q2FY25 | Q2FY24 | YoY (%) | Q1FY25 | QoQ (%) |
|---|---|---|---|---|---|
| Revenue from operations | 361.00 | 293.00 | 23.00% | 315.00 | 15.00% |
| EBITDA | 83.00 | 57.00 | 46.00% | 48.00 | 73.00% |
| EBITDA Margin (%) | 22.99% | 19.45% | 354 bps | 15.24% | 776 bps |
| PAT | 70.00 | 48.00 | 46.00% | 47.00 | 49.00% |
| EPS (Rs) | 5.03 | 3.43 | 47.00% | 3.40 | 48.00% |
Source: Company Filings; stockaxis Research
Q2FY25 Result Highlights
Newgen Software displayed remarkable earnings growth driven by growth across all
geographies EMEA (21.3% YoY), India (18.9% YoY), and US (16.7% YoY) and license
sales (56% YoY) predominantly in APAC (53% YoY). Annuity revenue growth slowed down
to 14% YoY due to a slowdown in ATS revenue on account of longer implementation
cycles of recently won large deals. ATS revenue could pick up once the execution
of these deals is complete. SaaS revenue growth (12.4% YoY) is lower due to a softer
new logo addition in the US. On the operating front, consolidated EBITDA surged
to Rs.83 cr, a growth of 46% YoY while margins expanded by 354 bps at 23% driven
by a higher proportion of high-margin product license revenue. R&D expense was
9% and sales and marketing was 22% of sales. The company aims to maintain an EBITDA
margin of 23%+ and invest in marketing activities to create a larger sales funnel.
PAT registered a strong growth of 47% YoY To Rs.70 cr. The bottom line was bolstered
by strong growth in the financial services segment, license sales, and a significant
rise in margins.
Annuity revenue streams (ATS/AMC, support, and cloud/SaaS and Subscription license were at Rs 205 crores. Revenue from the sale of products/licenses were at Rs 77 crores. Revenue from Implementation and others were at Rs 79 crores.

Key Business Highlights during the quarter
- Strong growth across all key markets: EMEA (21% YoY), India (19% YoY), APAC (53% YoY) and US (17% YoY).
- Recognized in Forrester’s The Task-Centric Automation Software Landscape, Q3 2024.
- Recognized in Forrester’s The Content Platforms Landscape, 2024.
- Released NewgenONE Marvin: APEX Edition to further streamline complex workflows, enhance customer engagement, and ensure secure AI integration. Also released new versions of Enterprise Content Management products – Omnidocs and OmniXtract and enhanced Video KYC, an essential part of all Digital onboarding processes.
- New Customer Additions: 8 new logos acquired during the quarter.
- Annuities: Annuity revenues account for 74% of total revenue.
- Investment in new verticals: Expanding focus beyond core banking into insurance and government.
Significant deal closures
- Bagged a project of Rs.25 crores from a large insurance company in India for building their system of engagement.
- Providing Enterprise Content Management Solution to one of the Top financial institutions in the US with an aggregate order value is USD $1.5mn.
- Received an order from a leading financial leasing company in Saudi Arabia with an order value of USD 1.5mn for loan origination and collection system.
- In India, received an order from a large infrastructure financing services company with a value of Rs.16.9 crores.
- In APAC region, entered into a contract with Singapore’s leading financial institution.
Key Conference call takeaways
- Newgen Software aims to capture market share in the mature markets of US and Europe as it targets $500 million in revenue over the next 3-4 years.
- Management is confident of maintaining a historical growth rate of around 20% in FY25.
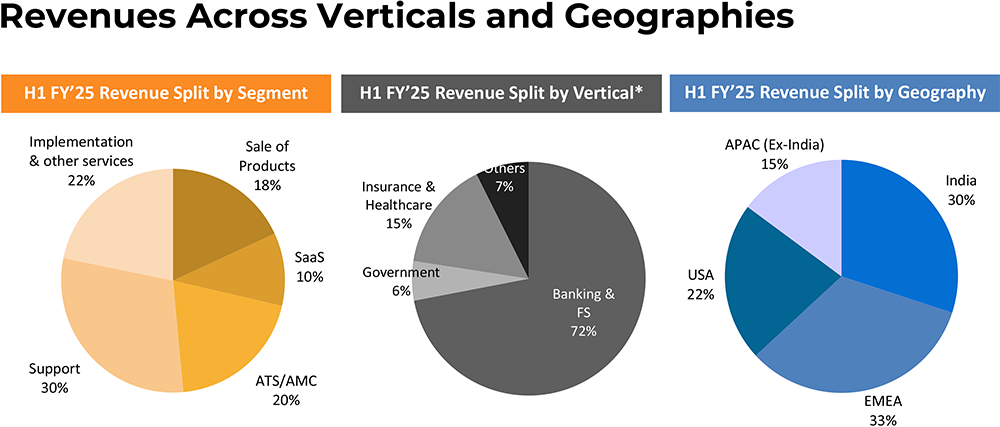
- The company is also focusing on scaling up its health insurance and government segments, which together account for 20% of revenue. Banking and financial services contribute 72% of total business.
- India and the Middle East have grown well at 19%, and EMEA at 21%. APAC (excluding India) grew by 53%, though from a small base. It is a strong market, representing 15% of the business, with continued momentum, especially in Singapore and Phillipines. India and EMEA currently account for 30% and 33% of revenue, respectively. The US market, with a 22% share, grew by 17%.
- Newgen has registered a 20%+ growth rate for 10 quarters. H2 should maintain momentum.
- Insurance and government contribute 20% of revenue, management aspires to reach 30-40% in 2-3 years.
- The company anticipates that its focus on expanding services in financial sectors, including banking, insurance, and health insurance will contribute to sustained revenue growth.
- Orderbook has grown strongly at 22% YoY in H1FY25. Pipeline in the traditional market is growing at a healthy pace; financial services revenues are getting diversified across solutions. A pipeline is also building up in health-insurance and government segments (across markets) and in the US market.
- Management expects deal velocity to improve in the US in H2FY25. It won a large deal of TCV USD 1.5mn to provide Enterprise Content Management Solutions to one of the top financial institutions in the US in Q2FY25.
- Management has said that its twin strategy of 1) going deeper into verticals, and 2) expanding to new logos, would enhance the existing deal pipeline. Newgen expects 50% of incremental revenue in FY26E to arise from the upsell of accelerators (trade finance, supply chain) and balance from new logos additions.
Outlook & valuation
Newgen Software posted robust earnings growth for the quarter ended Q2FY25 driven by license sales predominantly in APAC and healthy growth across other markets. The company is keenly focusing on the innovation of its products which will contribute to more accurate and deep analysis of data. It has launched the Newgen ONE platform which is backed with a cloud-native, AI-based platform which facilitates better real-time extraction of data. Overall growth in customer base and diversity in revenue model will help the company to grow faster and more efficiently. With growing use and dependence on data in sectors like banking & financial services, insurance, etc, the company’s growth trajectory looks promising. We expect traction in the traditional market to continue. We believe that the growth momentum is likely to be sustained given its strong deal bookings and pipeline, reinvestments in sales and marketing, product launches, traction in Gen AI, healthy annuity growth, partnership with insurance platform companies, and progress in establishing a GSI ecosystem.
We continue to remain bullish on the growth prospects of Newgen on the back of 1) improved growth visibility on continued traction in banking in India and EMEA markets, focus on building scale in health insurance and government segments, healthy orderbook (22% YoY in H1FY25), with growing deal sizes, 2) strong client-mining ability – INR 50mn+ client bucket grew 2.5x to 65 in 3 years, 3) potential revenue upside when US engine fires up and 4) steady EBITDA margin above 23%.
At CMP of Rs.1250, the stock is trading at 45x FY26E. We maintain a HOLD rating on the stock .
Consolidated Financial statements
Profit & Loss statement
| Particulars (Rs. In cr) | Q2FY25 | Q2FY24 | YoY (%) | Q1FY25 | QoQ (%) |
|---|---|---|---|---|---|
| Revenue from operations | 361.00 | 293.00 | 23.00% | 315.00 | 15.00% |
| Employee benefit expenses | 185.00 | 157.00 | 18.00% | 174.00 | 6.00% |
| Other expenses | 93.00 | 79.00 | 18.00% | 93.00 | 0.00% |
| EBITDA | 83.00 | 57.00 | 46.00% | 48.00 | 73.00% |
| EBITDA Margin (%) | 22.99% | 19.45% | 354 bps | 15.24% | 776 bps |
| Depreciation expenses | 8.00 | 7.00 | 14.00% | 8.00 | 0.00% |
| EBIT | 75.00 | 50.00 | 50.00% | 40.00 | 88.00% |
| Finance cost | 1.00 | 1.00 | -5.00% | 1.00 | -5.00% |
| Other Income | 19.00 | 9.00 | 106.00% | 23.00 | -20.00% |
| PBT | 93.00 | 59.00 | 57.00% | 61.00 | 52.00% |
| Tax expenses | 22.00 | 11.00 | 100.00% | 14.00 | 57.00% |
| PAT | 70.00 | 48.00 | 46.00% | 47.00 | 49.00% |
| EPS (Rs) | 5.03 | 3.43 | 47.00% | 3.40 | 48.00% |