Natco Pharma Ltd
Quarterly Result - Q2FY25
Natco Pharma Ltd
Pharmaceuticals & Drugs - Global
Current
Previous
Stock Info
Shareholding Pattern
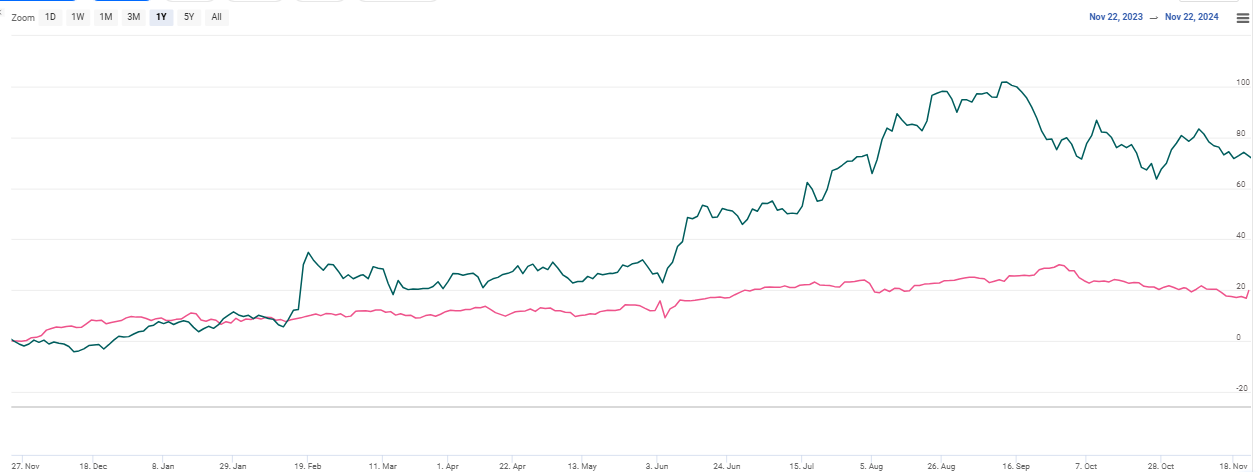
Price performance
Indexed Stock Performance

Financial Highlights:
| Particulars (Rs. In cr) | Q2FY25 | Q2FY24 | YoY (%) | Q1FY25 | QoQ (%) |
|---|---|---|---|---|---|
| Revenue from operations | 1371.00 | 1031.00 | 33.00% | 1363.00 | 1.00% |
| EBITDA | 868.00 | 488.00 | 78.00% | 853.00 | 2.00% |
| EBITDA Margin (%) | 60.49% | 45.99% | 1450 bps | 60.45% | 4 bps |
| PAT | 676.00 | 369.00 | 83.00% | 669.00 | 1.00% |
| EPS (Rs.) | 37.81 | 20.60 | 84.00% | 37.32 | 1.00% |
Source: Company Filings; stockaxis Research
Q2FY25 Result Highlights
Natco Pharma delivered robust financial performance for the quarter ended Q2FY25.
Consolidated net sales rose 33% YoY to Rs.1371 cr led by sustained momentum in the
export business. Gross Margin expanded 796 bps to 87.6% due to the profit share
of gRevlimid. Consolidated EBITDA surged 78% YoY to Rs.868cr while EBITDA Margins
expanded significantly by 1450 bps YoY and stood at 60.49%. PAT soared 83% YoY to
Rs. 677 cr boosted by higher other income (+117% YoY).
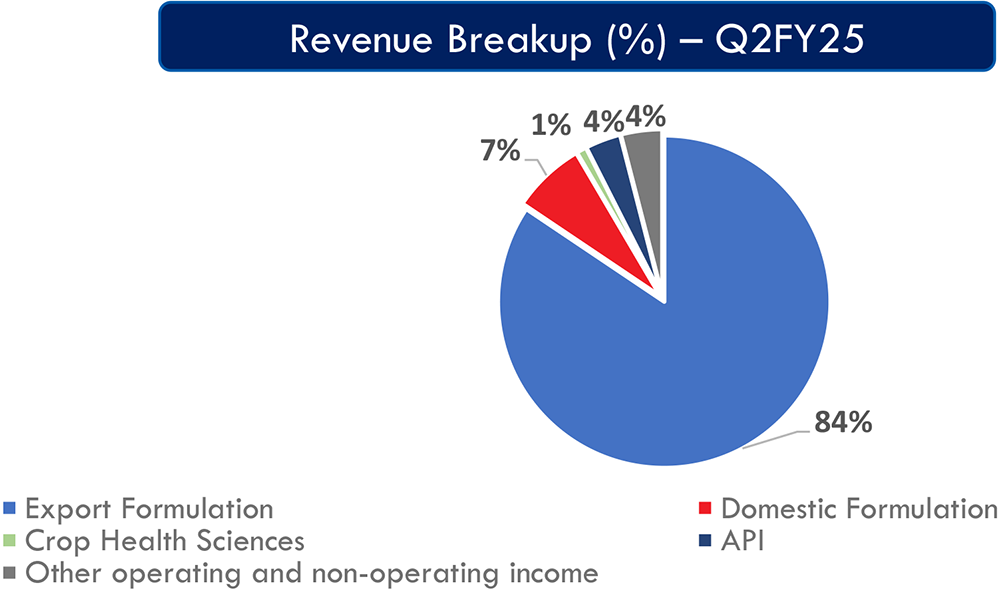
Domestic formulations revenues growth remained flat YoY to Rs.102 cr. Export formulations revenue was up 53% YoY (flat QoQ) to Rs.1211 cr driven by higher sales and profit share of gRevlimid and traction in subsidiaries. The Crop Sciences business declined 75% YoY to Rs. 14.1cr in Q2FY25 due to provisions for sales returns and discounts. The API business declined 36% YoY (-+27% QoQ) to Rs.49.6 cr impacted by higher captive consumption.

Key Conference call takeaways
Guidance: (i) Management has pegged FY25 revenue growth guidance at 15–20%,
(ii) PAT growth is expected to be 20% for FY25.
Key Takeaways:
Product Updates
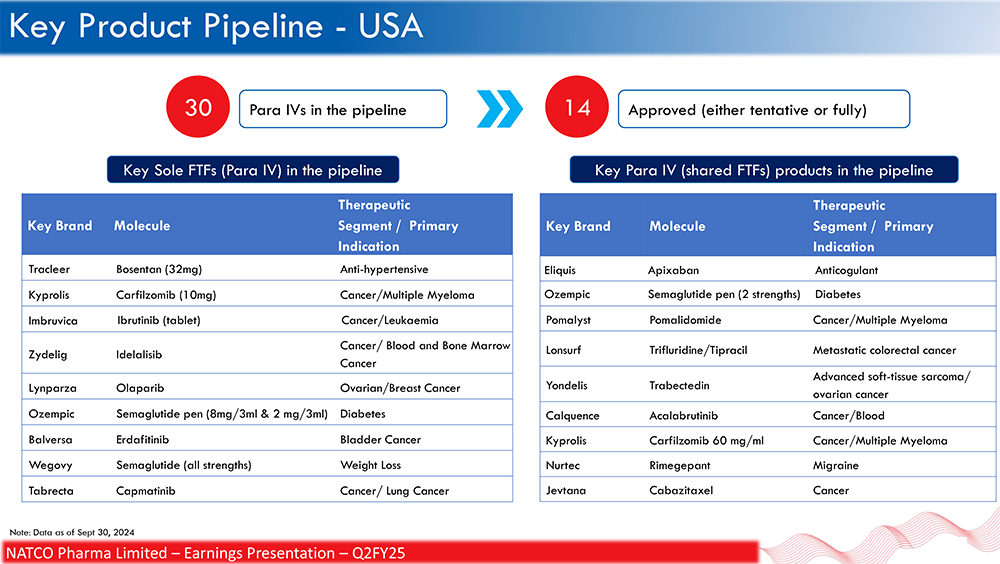
- Olaparib: Filed, awaiting approval, with trials expected in 11.5 years.
- Other Products: Carfilzomib (10mg), Bosentan (32mg), and several shared FTF products in the pipeline.
- Adapetini and Capmatinib are high-potential, early-stage products.
- Pending Litigation: Semaglutide, Tabrecta and Ozempic are under pending litigation, and launches depend on regulatory approvals.
- Launch pipeline: Two to three products are expected to be filed in the next 1.5 to 2 years. These will provide revenue visibility for the next 8-10 years.
- Clinical Trial ongoing for NCE 2694 for Late-Stage cancer indication.

Acquisition
- In Q2FY25, Natco Pharma invested in eGenesis, a biotechnology company involved in genome engineering and xenotransplantation for a consideration of $8 million.
Subsidiary revenue:
- The combined revenue from subsidiaries reached Rs.120 crore.
Crop Health Science segment
- Currently operating at a loss, aiming for breakeven by March 2026 with Rs.300 cr potential.
Cash and Bank
- Cash on books as of 30th September: Rs.2,600 crore as of September end.
R&D
- R&D spending for QFY25 stood at Rs 100-125cr, primarily funded by Revlimid profits.
Concerns
- Price Erosion: There is uncertainty around potential Revlimid price erosion in FY27 and FY28.
- Earnings Volatility: Pending litigations and delay in new product launches may cause earnings volatility.
Outlook & Future Strategy
- A weaker performance is anticipated in Q3 FY25 compared to Q2.
- Focus on high-risk, high-reward products and expansion in emerging markets.
Other Key Points
- Considering inorganic routes of acquisition, supported by ample cash reserves.
Outlook & valuation
Natco Pharma posted stellar earnings growth for the quarter ended Q2FY25. The company is focusing on expanding its presence in both domestic and international markets. Natco’s focus on strengthening the core business is bearing fruit, evident from steady India and Agrochem ramp-up (25% growth potential). Management expects a significant improvement in its market share in gRevlimid, which will likely touch ~33% in H2FY26. The company has a strong pipeline of FTF opportunities that includes assets such as Semaglutide, Olaparib, and Ibrutinib, Carfilzomib (10mg), Bosentan (32mg), which should drive growth in the long term while the company also aims to file 2–3 limited competition products in the US every year. We welcome the R&D ramp-up (from 8% to 10% of revenue) given Natco’s strength in complex generics. The strong Balance Sheet provides ample scope to pursue inorganic opportunities. With the base business recovering and Natco pursuing complex opportunities with gRevlimid, long term outlook appears promising. Management also sounds confident and has guided for 15-20% sales growth and 20% PAT growth in FY25 thus reaffirming its bullish stance. At a CMP of Rs.1364, the stock is trading at 15x FY26E. We maintain a HOLD rating on the stock.
Consolidated Financial statements
Profit & Loss statement
| Particulars (Rs. In cr) | Q2FY25 | Q2FY24 | YoY (%) | Q1FY25 | QoQ (%) |
|---|---|---|---|---|---|
| Revenue from operations | 1371.00 | 1031.00 | 33.00% | 1363.00 | 1.00% |
| Other Income | 64.00 | 29.00 | 121.00% | 48.00 | 33.00% |
| Total Income | 1435.00 | 1061.00 | 35.00% | 1411.00 | 2.00% |
| Cost of goods sold | 178.00 | 216.00 | -18.00% | 180.00 | -1.00% |
| Gross Profit | 1257.00 | 845.00 | 49.00% | 1231.00 | 2.00% |
| Gross Margin (%) | 87.60% | 79.64% | 796 bps | 87.24% | 36 bps |
| Employee Benefit Expenses | 151.00 | 122.00 | 24.00% | 142.00 | 6.00% |
| Other Expenses | 238.00 | 235.00 | 1.00% | 236.00 | 1.00% |
| EBITDA | 868.00 | 488.00 | 78.00% | 853.00 | 2.00% |
| EBITDA Margin (%) | 60.49% | 45.99% | 1450 bps | 60.45% | 4 bps |
| Depreciation expenses | 46.00 | 44.00 | 5.00% | 44.00 | 5.00% |
| EBIT | 822.00 | 444.00 | 85.00% | 809.00 | 2.00% |
| Finance cost | 4.00 | 4.00 | 0.00% | 5.00 | -20.00% |
| PBT | 818.00 | 440.00 | 86.00% | 804.00 | 2.00% |
| Tax expenses | 142.00 | 71.00 | 100.00% | 135.00 | 5.00% |
| PAT | 676.00 | 369.00 | 83.00% | 669.00 | 1.00% |
| EPS (Rs.) | 37.81 | 20.60 | 84.00% | 37.32 | 1.00% |