Marksans Pharma Ltd
Quarterly Result - Q2FY25
Marksans Pharma Ltd
Pharmaceuticals & Drugs - Global
Current
Previous
Stock Info
Shareholding Pattern
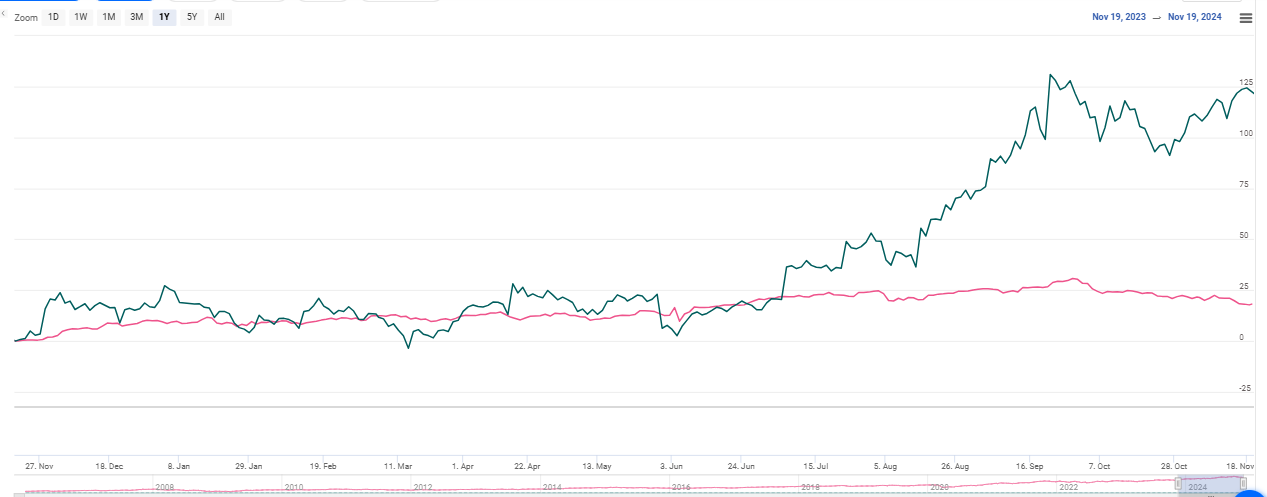
Price performance
Indexed Stock Performance

Financial Highlights:
| Particulars (Rs. in cr) | Q2FY25 | Q2FY24 | YoY (%) | Q1FY25 | QoQ (%) |
|---|---|---|---|---|---|
| Revenue from operations | 642.00 | 531.00 | 21.00% | 591.00 | 9.00% |
| EBITDA | 136.00 | 114.00 | 19.00% | 129.00 | 5.00% |
| EBITDA Margin (%) | 21.18% | 21.47% | (31 bps) | 21.83% | (61 bps) |
| PAT | 98.00 | 84.00 | 17.00% | 89.00 | 10.00% |
| EPS (Rs.) | 2.13 | 1.84 | 16.00% | 1.96 | 9.00% |
Source: Company Filings; stockaxis Research
Q2FY25 Result Highlights
Marksans Pharma Ltd (MPL) reported healthy earnings growth for the quarter ended
Q2FY25. Consolidated net sales rose 21% YoY to Rs.642 cr driven by growth across
all key markets, led by US and followed by ANZ. Continued softening of raw material
prices and a better product mix led to growth in gross profit and margin expansion.
Gross Margins expanded by 730 bps at 59.7%. Consolidated EBITDA witnessed a growth
of 19% YoY to Rs.136 cr while margins declined by 31 bps to 21.18% due to increase
in employee expenses due to addition of new employees at TEVA facility and Increase
in freight costs. PAT grew by 17% YoY to Rs.98 cr.
Financial and other highlights
Revenue contribution for Q2FY25
- US –Rs.304.2 cr
- UK & Europe –Rs.246.7 cr
- Australia & New Zealand –Rs.63.6 cr
- ROW – Rs.27.5 cr.
Research & Development (R&D) spends at Rs.10.7 cr in Q2 FY25, 1.7% of consolidated revenue.
Capex of Rs.76.0 cr incurred during H1FY25.
Cash Balance as of 30th September 2024 is Rs.657 cr.
Working capital cycle 132 days for H1FY25.
In Q2, the company received market authorization from UKMHRA for products - Levonorgestrel 1.5mg tablet, Rasagiline 1mg tablet, Olmesartan 10, 20, 40mg tablets, Fluoxetine 10, 30, 60mg tablets and Levetiracetam 100mg/ml.
Geography wise performance
US & North America
- Revenues grew by 37% YoY and 21% QoQ to Rs.304 cr driven by increase in market share and new product launches.
- Price erosion of Rx products is stable.
UK & Europe
Revenues grew by 6% YoY and declined 2% sequentially
to Rs.247 cr due to a delay in the onset of the cough and cold season.
- Witnessed mixed demand trends in the category.
- Expect demand to pick up in H2
Australia & New Zealand
Revenues grew 31% YoY and fell 3% sequentially to Rs.64 cr. QoQ witnessed a decline
due to a seasonal impact, similar to what we saw last year.
RoW Business
Revenues grew by 1% YoY and 21% QoQ to Rs.28 cr due to Favourable demand scenario
in key RoW markets.
Key Conference call takeaways
Expanding the OTC business
- Aim to capture a significant part of the multi-billion-dollar OTC opportunity. According to IQVIA, Global OTC Size in 2025 is expected to be ~$ 204bn.
- OTC segment grew at CAGR of 17% (from FY17-FY24). Majority of revenue in OTC comes from manufacturing and selling store brands for key retailers in key regions.
- Marksans is the most preferred and growing low-cost store brand manufacturing partner.
Capacity expansion
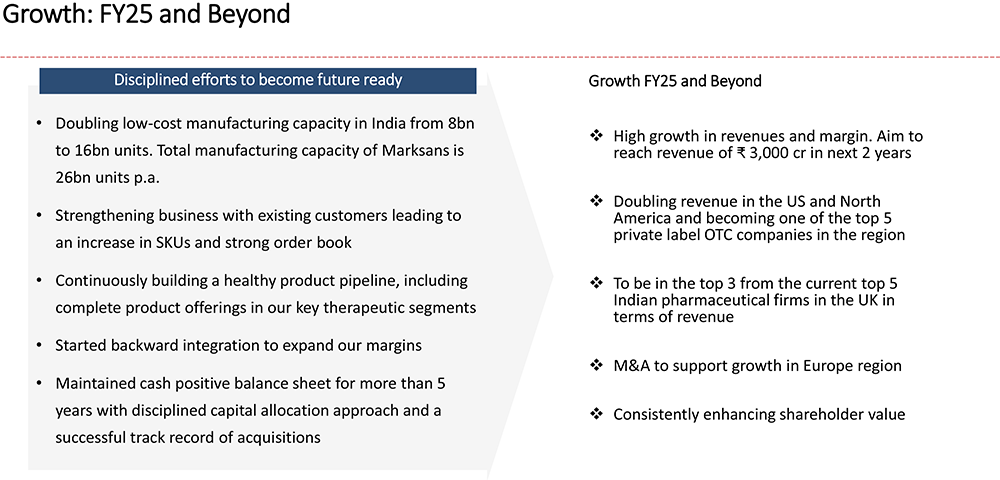
- Aim to scale the newly acquired TEVA unit’s capacity to 8bn units p.a. in three phases.
- Phase 2 expansion to 6bn units p.a. will be completed by the end of FY25.
- Plan to manufacture tablets, hard capsules, ointments, liquids, and creams
Healthy product pipeline
- Continued focus on R&D leading to strong product pipeline and successful launches.
- Strong pipeline of more than 76 products.
Backward integration
- We are in the process of backward integration, and API manufacturing for captive consumption of our top molecules.
Supplement growth via acquisitions
- We will follow calibrated inorganic growth approach.
- Expansion in growing markets and EU through acquiring front-end marketing and distribution companies.
- Strong balance sheet to support the growth
Other Key Highlights
The company anticipates better traction of growth for US & North America for
coming quarters as cough and cold season start towards second half of the year.
Management anticipates stronger performance for Australia and New Zealand in coming quarters due to upcoming new launches.
Product Pipeline
UK
Planned 34 new filings over the next three years.
In addition, 16 products are already filed and awaiting approval.
USA
32 products are in the pipeline out of that 20 are oral solids, 12 are ointments
and creams. Within oral solids 4 are Softgels.
Australia & New Zealand
10 products are in the pipeline and expected to be launched over the next two years.
Rest of the World
124 products approved in Q2Fy25. 120 products awaiting approval and 108 products
are in the Pipeline.

Outlook & valuation
Marksans Pharma delivered another solid financial performance for the quarter ended Q2FY25. MPL boasts of a strong product pipeline followed by successful launches led by continued focus on R&D. In the UK region, the company has planned 34 new filings over the next three years, and in addition, 16 products are already filed and awaiting approval. For the US region, the company has a pipeline of 32 products with 20 being oral solids, 12 being ointments and creams and within oral solids 4 are softgels. Further, MPL has 10 products in the pipeline that are expected to be launched over the course of the next 2 years under the Australia and New Zealand region. For the Rest of the world, 124 products are approved with 120 products awaiting approval and 108 products are in the pipeline.
Management has guided for Rs.3000 cr revenue in the next 2 years that translates to 50% growth in the next couple of years. We also expect the EBITDA margin to improve gradually in the near term, led by a robust pipeline of new launches in the regulated markets of the US and Europe; continued demand for its existing products, and cost savings from improved sourcing due to the company’s backward-integration initiatives.
Considering robust R&D capabilities, healthy pipeline of product launches, Strong capabilities and experience to capture a significant part of the multibillion-dollar OTC opportunity, Backward integration, API manufacturing for captive consumption, credible management, continued expansion of product pipeline, capacity expansion and focus on inorganic growth, Marksans Pharma is well positioned to deliver steady earnings growth in the coming quarters. At CMP of Rs.308, the stock is trading at 28x FY26E. We maintain a HOLD rating on the stock.
Consolidated Financial statements
Profit & Loss statement
| Particulars (Rs. in cr) | Q2FY25 | Q2FY24 | YoY (%) | Q1FY25 | QoQ (%) |
|---|---|---|---|---|---|
| Revenue from operations | 642.00 | 531.00 | 21.00% | 591.00 | 9.00% |
| COGS | 258.00 | 253.00 | 2.00% | 262.00 | -2.00% |
| Gross Profit | 384.00 | 278.00 | 38.00% | 329.00 | 17.00% |
| Gross Margin (%) | 59.81% | 52.35% | 732 bps | 55.67% | 407 bps |
| Employee Benefit expenses | 84.00 | 71.00 | 18.00% | 80.00 | 5.00% |
| Other expenses | 164.00 | 93.00 | 76.00% | 120.00 | 37.00% |
| EBITDA | 136.00 | 114.00 | 19.00% | 129.00 | 5.00% |
| EBITDA Margin (%) | 21.18% | 21.47% | (31 bps) | 21.83% | (61 bps) |
| Depreciation expenses | 20.00 | 18.00 | 11.00% | 20.00 | 0.00% |
| EBIT | 116.00 | 96.00 | 21.00% | 109.00 | 6.00% |
| Finance cost | 3.00 | 2.00 | 50.00% | 3.00 | 0.00% |
| Other Income | 11.00 | 19.00 | -42.00% | 15.00 | -27.00% |
| PBT | 124.00 | 114.00 | 9.00% | 120.00 | 3.00% |
| Tax expenses | 27.00 | 30.00 | -10.00% | 31.00 | -13.00% |
| PAT | 98.00 | 84.00 | 17.00% | 89.00 | 10.00% |
| EPS (Rs.) | 2.13 | 1.84 | 16.00% | 1.96 | 9.00% |