KPIT Technologies Ltd
Quarterly Result - Q2FY25
KPIT Technologies Ltd
IT - Software Services
Current
Previous
Stock Info
Shareholding Pattern
Price performance
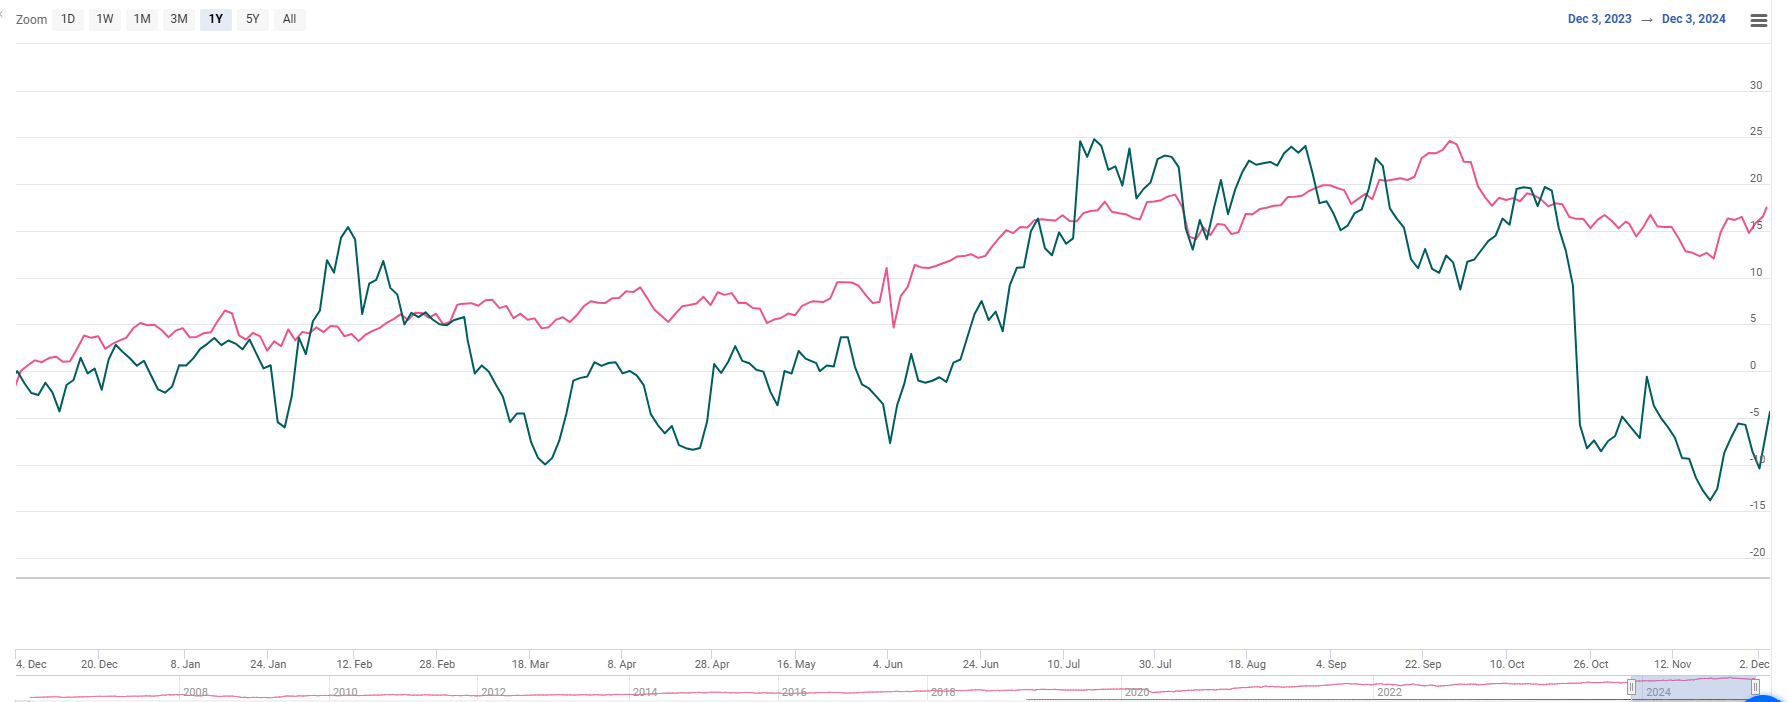
Indexed Stock Performance

Financial Highlights:
| Particulars (in Rs. Cr) | Q2FY25 | Q2FY24 | YoY (%) | Q1FY25 | QoQ (%) |
|---|---|---|---|---|---|
| Revenue from Operations | 1471.00 | 1199.00 | 23.00% | 1365.00 | 8.00% |
| EBITDA | 302.00 | 240.00 | 26.00% | 288.00 | 5.00% |
| EBITDA Margin (%) | 20.52% | 20.01% | 50 bps | 21.11% | (61) bps |
| PAT | 204.00 | 141.00 | 44.00% | 204.00 | 0.00% |
| EPS | 7.51 | 5.20 | 44.00% | 7.53 | 0.00% |
Source: Company Filings; stockaxis Research
Q2FY25 Result Highlights
KPIT Technologies Ltd delivered industry-leading performance that continued in Q2FY25,
reporting 8% QoQ and 23% YoY revenue growth, the strongest among ER&D players.
Growth was fuelled by passenger cars. The company reported dollar revenue growth
of 19% YoY growth led by Middleware, Powertrain, and Asia. Q2FY25 Constant Currency
Revenue grows 20% YoY. Consolidated EBITDA grew by 26% YoY to Rs.302 cr and EBITDA
Margins expanded by 50 bps at 20.5%. EBITDA margins have seen a consistent improvement
to 20.5% since the past months of ESOP cost and quarterly promotions, mainly due
to fixed cost leverage. Sequentially, EBITDA grew by 5%. Other income jumped ~5x
YoY to 52 cr, in line with the previous quarter (Q1FY25: 54 cr). KPIT Tech managed
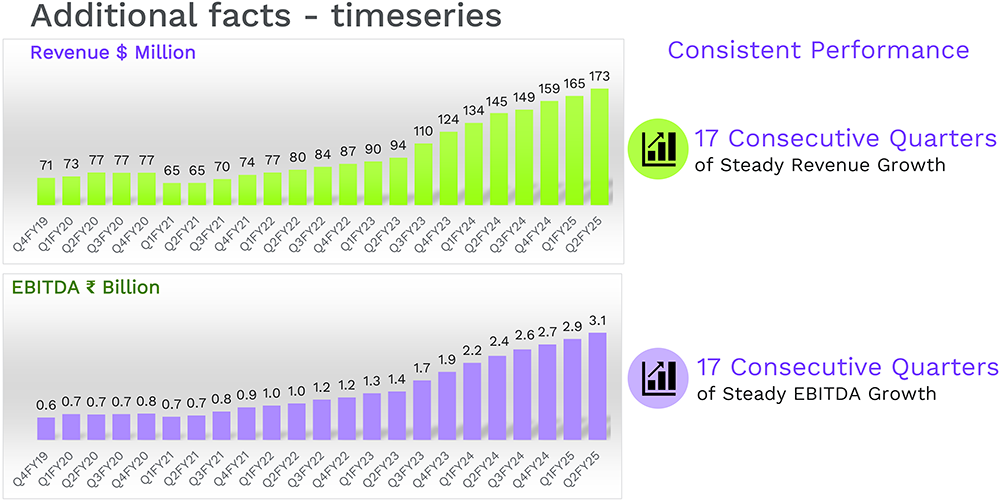
to deliver 17 consecutive quarters of steady revenue and EBITDA growth. PAT surged
by 44% YoY to Rs.204 cr, mainly due to superior operating leverage and lower finance
costs.
New TCV signed at $207m, up 33% YoY, taking LTM to $859m, down 17.5% y/y, incl. mega deals in FY23. The book-to-bill of 1.2x (last 4 quarter average of 1.3x) and management talked of a strong deal pipeline with many large deals. The company plans to raise Rs.28.8bn (~6% equity dilution) towards inorganic growth.
Key Highlights
- QoQ Constant Currency growth of 4.7% and reported $ growth of 5.0%. Growth led by Asia and Passenger Cars.
- EBITDA margins stood at 20.8% despite the full quarter impact of wage hikes and one-month additional ESOP cost, mainly due to productivity improvement and fixed cost leverage.
- Other income was lower as compared to last quarter due to conversion losses on Euro and Yen-denominated assets and liabilities. ETR was in line with our annual outlook.

Key Conference call takeaways
Guidance: (i) FY25 CC revenue growth guidance confirmed at 18-22%. The management
anticipates revenue to be at the lower end of this range, (ii) EBITDA Margin is
expected to exceed the guided 20.5%
Key Conference call takeaways:
Operational Overview
- The company secured approximately $207 million in new engagements during the quarter, showcasing its strong ability to attract high-value projects.
- A notable increase in offshore work was observed, as clients increasingly prioritized cost optimization strategies while ensuring stable pricing and volume.
- The Passenger Car segment saw an impressive 26.4% YoY revenue growth, driven by significant advancements in powertrain and middleware projects.
- Both the Middleware and Powertrain sectors experienced substantial growth, underscoring the company’s focus on innovation and market demand.
- Growth during the quarter was primarily driven by strong performance in Asia, particularly in Japan, Korea, and India, alongside robust demand in the Passenger Car segment.
- The company recorded its lowest-ever attrition rates, demonstrating strong employee retention and satisfaction.
- Investment in Qorix is beginning to yield revenue, though large-scale revenue is anticipated to take more time. The subsidiary recently joined the Eclipse and COVESA foundations.
- The second tranche investment in gaming company nDream brought the stake to 25%.
- KPIT is actively exploring inorganic growth opportunities in areas related to cost reduction, adjacencies, and compliance.
- The board approved raising up to Rs.2,880 million through QIP, implying up to 6% dilution. This is an enabling resolution for potential strategic acquisitions, not linked to any specific deal.
Business Highlights
- Passenger cars have accelerated for several quarters now. In Q2, the segment grew 5.3% sequentially and is on a high growth trajectory.
- This continues to be the largest segment for KPIT, bringing 80% to revenue (76% a year back).
- Management is confidence of growth at the European OEM client in passenger vehicles reviving, which would reflect in the next couple of quarters.
- On the other hand, commercial vehicles have stagnated in the last several quarters. In Q2, though, they swung up slightly sequentially but continued to decline (1.4%) y/y.
- Management says commercial vehicles are expected to grow from FY26, mostly in Europe and the US.
- Within Asia, Japan remains strong y/y. Growth in Japan in the last six quarters has been consistently strong y/y (though on a smaller base), driven by the Honda ramp-up. Sequentially, it grew 25% in Q2 on the back of 31.5% growth in Q1.
- Within Asia, the company is confident of broad-based growth in Korea, China, Thailand and India. Further, growth in the region is expected to be on the higher side. However, it may not be large enough to move the company’s growth rates
Future Outlook:
- Prospects for large consolidation and megadeals identified, though their timing remains uncertain.
- Continued investments in electric powertrain and connected domains are anticipated.
- Plans for expansion in Off-Highway and Commercial Vehicles on schedule.
- Increased focus on the China market to explore innovation trends and collaborate with OEMs in targeted areas.
Concerns
- Uncertainty in large deal closures in Europe and the US, leading to a cautious short-term outlook despite robust pipelines.
- Global OEMs are facing pressures to cut costs and remain cautious in spending, potentially affecting the initiation of new projects.
Outlook & valuation
KPIT Tech delivered steady Q2FY25 earnings owing to a healthy deal pipeline and growth led by Middleware, Powertrain, and Asia. We believe that KPIT Tech appears to be in a strong position with a clear growth strategy and positive outlook. The company's focus on new technologies, deep client relationships, and successful deal wins have contributed to its consistent revenue growth and profitability. Management's commitment to doubling down on offerings, expanding into new markets, and increasing R&D spending in future-focused areas bodes well for its future growth potential. Management is cautious about the overall environment with delayed deal ramp-ups and extended timelines for revenue conversion
Management maintained the guidance at the lower end of 18-22% revenue growth for FY25 and an EBITDA margin of 20.5% reflects confidence in its ability to capitalize on opportunities in the automotive sector. However, management expressed concerns about industry pressures on demand and profitability, market saturation in China, and competition in the software-defined vehicle space. KPIT's plans to invest in new practices, explore adjacencies, and expand its client base in key markets like India and China further support its growth prospects.
We believe that KPIT is well-positioned to capture the immense growth opportunity in the industry considering 1) Accelerated demand for ER&D services, 2) Focus on client retention for long-term sustainable growth, 3) Margin tailwinds driven by cost efficiencies, lower input costs, Robust Investments in newer technologies by the Auto industry, Capitalizing on growing investment in the Automotive vertical, Robust investments in CV segment, strong geographical diversification, and strong services mix. The company's consistent industry-leading growth and margin expansion, coupled with positive trends in TCV, pipeline, and net additions, indicate sustained momentum. At a CMP of Rs.1350, the stock is trading at 39x FY26E. We maintain a HOLD rating on the stock.
Consolidated Financial statements
Profit & Loss statement
| Particulars (in Rs. Cr) | Q2FY25 | Q2FY24 | YoY (%) | Q1FY25 | QoQ (%) |
|---|---|---|---|---|---|
| Revenue from Operations | 1471.00 | 1199.00 | 23.00% | 1365.00 | 8.00% |
| Cost of Goods Sold | 14.00 | 18.00 | -19.00% | 8.00 | 81.00% |
| Gross Profit | 1457.00 | 1182.00 | 23.00% | 1357.00 | 7.00% |
| Employee Benefit Expenses | 945.00 | 775.00 | 22.00% | 874.00 | 8.00% |
| Other Expenses | 211.00 | 166.00 | 27.00% | 194.00 | 8.00% |
| EBITDA | 302.00 | 240.00 | 26.00% | 288.00 | 5.00% |
| EBITDA Margin (%) | 20.52% | 20.01% | 50 bps | 21.11% | (61) bps |
| Depreciation | 56.00 | 48.00 | 17.00% | 53.00 | 7.00% |
| EBIT | 246.00 | 192.00 | 28.00% | 236.00 | 4.00% |
| Finance Cost | 10.00 | 14.00 | -25.00% | 13.00 | -20.00% |
| Other Income | 52.00 | 9.00 | 448.00% | 54.00 | -5.00% |
| Profit before share of profit/(loss) of equity accounted investees and tax | 288.00 | 188.00 | 53.00% | 277.00 | 4.00% |
| Share of Profit/(loss) of associates | -4.00 | 0.00 | - | -0.06 | - |
| PBT | 283.00 | 188.00 | 51.00% | 277.00 | 2.00% |
| Taxes | 79.00 | 46.00 | 71.00% | 73.00 | 9.00% |
| PAT | 204.00 | 141.00 | 44.00% | 204.00 | 0.00% |
| EPS | 7.51 | 5.20 | 44.00% | 7.53 | 0.00% |