KFin Technologies Ltd
Quarterly Result - Q2FY25
KFin Technologies Ltd
Depository Services
Current
Previous
Stock Info
Shareholding Pattern
Price performance
Indexed Stock Performance

Financial Highlights:
| Particulars (Rs. in cr) | Q2FY25 | Q2FY24 | %YoY | Q1FY25 | %QoQ |
|---|---|---|---|---|---|
| Revenue from operations | 280.00 | 209.00 | 34.00% | 237.56 | 18.00% |
| EBITDA | 127.00 | 94.00 | 35.00% | 99.66 | 27.00% |
| EBITDA Margin (%) | 45.10% | 44.80% | 30 bps | 42.00% | 310 bps |
| PAT | 89.00 | 61.00 | 46.00% | 68.00 | 31.00% |
| EPS (Rs.) | 5.16 | 3.58 | 44.00% | 3.94 | 31.00% |
Source: Company Filings; stockaxis Research
Q2FY25 Result Highlights
KFin Technologies Limited delivered robust financial results for Q2 FY25, with a
notable 34% YoY growth in revenue, reaching Rs. 280 cr backed by structural growth
across diversified business segments. EBITDA also showed a strong performance, increasing
by 35% YoY to Rs. 1,265.4 million, resulting in a healthy margin of 45%. Net Profit
After Tax (PAT) saw a significant rise of 45.5% YoY, totalling Rs. 89 cr, with a
PAT margin of 31.8%. International and other investor solutions revenue up by 44%
YoY; VAS revenue is up by 46% YoY. KFintech continues to witness strong business
momentum in terms of new client wins, growth in revenue and profitability, expansion
in margins, and accumulation of free cash flows.
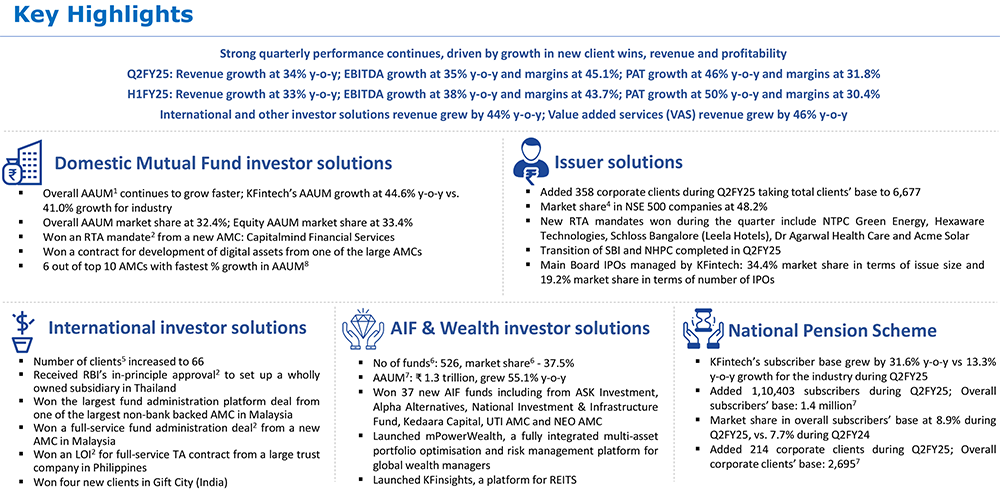
For the first half of FY25, the company reported a 33% YoY increase in revenue, amounting to Rs. 518 cr, and a 50% YoY rise in PAT to Rs.157 cr. International and other investor solutions revenue is up by 49.5% YoY; VAS revenue is up by 49.8% YoY. EBITDA stood at Rs.226 cr, up 38% YoY, and EBITDA margin at 43.7%.
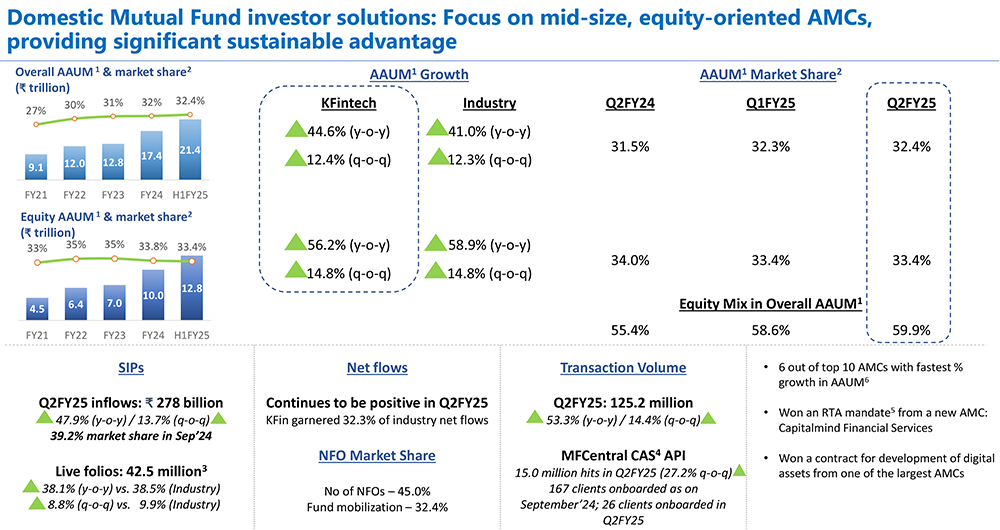
Overall AAUM growth came in at 45% YoY vs. 41% for the industry: market share at 32.4%
Equity AAUM growth stood at 56% YoY vs. 59% for the industry: market share at 33.4%


Key Deal Wins & Business Updates:
- Won an RTA deal from a new AMC: Capitalmind Financial Services; Won a deal for the development of digital assets from an AMC client.
- Added 358 new corporate clients and 11.5 million investor folios under issuer solutions.
- Market share in NSE500 companies at 48.2%.
- New RTA mandates won during the quarter include NTPC Green Energy, Hexaware Technologies, Schloss Bangalore (Leela Hotels), Dr Agarwal Health Care, and Acme Solar
- Won 37 new AIF funds from Alpha Alternatives, NIIF, Kedaara Capital, UTI AMC, and NEO AMC. Launched mPower Wealth, a fully integrated multi-asset portfolio optimisation and risk management platform for global wealth managers; Launched KFinsights, a platform for REITS.
- No of alternate funds at 526; Market share at 37.5%; AAUM grew 55% YoY to Rs.1.3 trillion.
- NPS subscriber base grew to Rs.1.37 million, up 32% YoY vs. 13% YoY growth for the industry.
- Market share in overall subscribers’ base at 8.9% as of September 30, 2024, up from 7.7% as of September 30, 2023
- Launches & Other Updates:
- The number of international clients increased to 66.
- Received RBI’s in-principal approval to set up a wholly-owned subsidiary in Thailand;
- Won the largest fund administration platform deal from one of the largest non-banks backed AMC and a full-service fund administration deal from a new AMC in Malaysia; Won an LOI for a full-service transfer agency deal from a large trust company in the Philippines.
- Launched KFinsights, a platform for REITS

Key Conference call takeaways
Segment Overview:
Domestic Mutual Fund Segment:
- Achieved a 44.6% YoY growth in Average Assets Under Management (AAUM), outperforming the industry average of 41%.
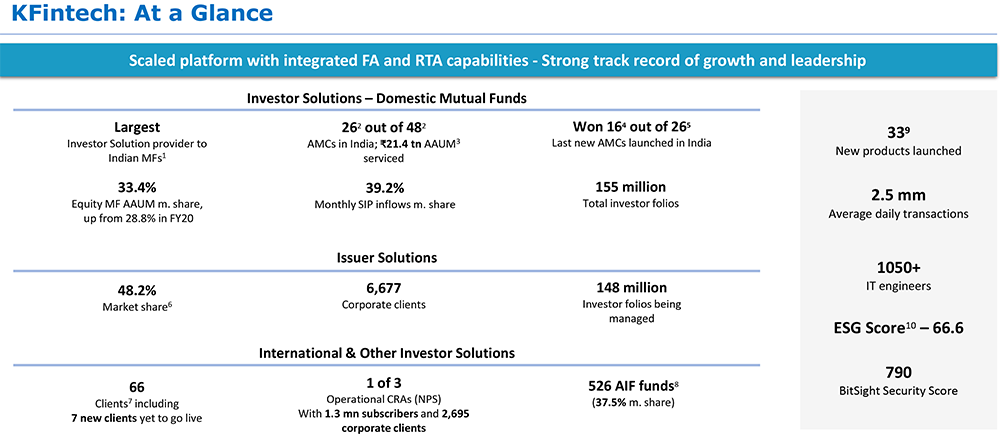
- The market share stood at 32.4%, with a 39.2% share in the SIP (Systematic Investment Plan) market.
- Significant client wins include an RTA deal with Capitalmind Financial Services and a digital asset development deal with a major AMC.
- Transaction volumes increased by 53.3% YoY and 14.4% QoQ.
- Six out of the top ten fastest-growing AMCs are now clients of KFinTech.
Issuer Solutions:
- Secured 358 new corporate clients, bringing the total to 6,677.
- Notable wins include mandates from NTPC Green Energy and Hexaware Technologies.
- Successfully transitioned clients like SBI and NHPC, adding 11.5 million new investor folios.
- Main Board IPOs managed by KFintech: 34.4% market share in terms of issue size and 19.2% market share in terms of number of IPOs.
- Market share4 in NSE 500 companies at 48.2%.
International Investor Solutions:
- Expanded its client base to 66.
- Secured in-principal approval from the RBI for a Thailand subsidiary.
- Added four new clients in GIFT City and saw 44% YoY revenue growth.
Other Investor Solutions:
- Maintained 37.5% market share in the Alternative Investment Funds (AIFs) space with AAUM up 55.1% YoY.
- Launched new platforms like mPower Wealth and KFinsights.
- Won 37 new AIF funds including from ASK Investment, Alpha Alternatives, National Investment & Infrastructure Fund, Kedaara Capital, UTI AMC and NEO AMC.
- NPS subscriber base grew by 31.6% YoY, surpassing industry growth, with 214 corporate clients added to the NPS segment.
Strategic Outlook & Expansion Plans:
Global Growth Focus:
The company is targeting sustained growth both domestically and internationally,
with an emphasis on expanding in markets like Thailand.
Plans to broaden product offerings and increase AAUM in the Thai market are key priorities.
Issuer Solutions Expansion:
With a growing client base, the company aims to enhance issuer solutions through
new service offerings and an expanding deal pipeline.
Anticipates continued revenue growth through value-added services.
Challenges and Areas of Concern:
Yield Compression in Domestic Mutual Funds:
The domestic mutual fund sector is experiencing yield compression, which could impact
margins.
The company is monitoring this challenge closely as part of its broader strategy to adapt to market conditions.
Global Business Solutions (GBS):
Issues in the U.S. mortgage market are affecting the GBS division, particularly
its mortgage processing business.
A review of the strategic direction for this segment is underway.
Rising Costs:
- Increased hiring and geographical expansion have led to higher costs.
- The company is leveraging technology to manage and optimize these expenses effectively.
Future Strategies
- Adoption of technology including cloud migration and automation.
- Hiring top talent, especially from engineering backgrounds.
- Expanding Service Offerings into Alternatives and Wealth Management are being considered.
- Expansion of the existing KRA business (Know Your Customer Registration Agency) to meet the growing demand in India.
Outlook
- Management is optimistic about continued growth in both domestic and international markets.
- The robust pipeline of new sign-ups and the ongoing expansion into new geographies, particularly Southeast Asia, are significant growth drivers.
- The strategic focus on technology and operational excellence Is expected to sustain revenue growth and profitability.
Outlook & valuation
KFin Technologies continues to demonstrate impressive financial performance and operational growth, driven by a strong domestic presence and international expansion. The company remains focused on leveraging technology to manage challenges, optimize costs, and expand its service offerings to support future growth across multiple sectors. KFIN Technologies Ltd is one of the leading technology-driven companies dealing in varied financial services. Kfin Tech boasts of a strong pipeline of deals in the international markets which we believe will propel overall growth for the company. KFintech is uniquely positioned to offer a full suite of fund administration services to global asset managers using its state-of-the-art technology stack and innovative value-added solutions. With the launch of the industry's first platform XAlt, KFintech aims to set new standards in the global fund administration space to offer a fully automated system to global alternate asset managers that aligns with the evolving requirements. India’s alternate asset management industry is at an inflection point and with global industry too expected to grow at a rapid pace, KFintech is well poised to seize the opportunity leveraging its product suite and sales efforts.” At a CMP of Rs.860, the stock is trading at 43.5x FY26E. We recommend a HOLD rating on the stock.
Consolidated Financial statements
Profit & Loss statement
| Particulars (Rs. in cr) | Q2FY25 | Q2FY24 | %YoY | Q1FY25 | %QoQ |
|---|---|---|---|---|---|
| Revenue from operations | 280.00 | 209.00 | 34.00% | 237.56 | 18.00% |
| Employee Benefit Expenses | 102.00 | 76.00 | 34.00% | 95.84 | 6.00% |
| Other expenses | 52.00 | 39.00 | 33.00% | 42.06 | 24.00% |
| EBITDA | 127.00 | 94.00 | 35.00% | 99.66 | 27.00% |
| EBITDA Margin (%) | 45.10% | 44.80% | 30 bps | 42.00% | 310 bps |
| Depreciation and amortization expenses | 17.00 | 12.57 | 32.00% | 14.78 | 12.00% |
| EBIT | 110.00 | 81.10 | 36.00% | 84.89 | 30.00% |
| Finance cost | 1.00 | 3.20 | -66.00% | 1.17 | -7.00% |
| Other Income | 11.00 | 6.30 | 67.00% | 8.09 | 30.00% |
| Profit before share of profit/loss of JV | 119.47 | 84.19 | 42.00% | 91.81 | 30.00% |
| Share of loss of joint venture | 0.00 | 0.48 | - | 0.00 | - |
| PBT | 119.00 | 84.00 | 41.00% | 92.00 | 30.00% |
| Tax expenses | 30.00 | 22.00 | 37.00% | 24.00 | 27.00% |
| PAT | 89.00 | 61.00 | 46.00% | 68.00 | 31.00% |
| EPS (Rs.) | 5.16 | 3.58 | 44.00% | 3.94 | 31.00% |