Hindustan Aeronautics Ltd
Quarterly Result - Q2FY25
Hindustan Aeronautics Ltd
Defence
Current
Previous
Stock Info
Shareholding Pattern
Price performance
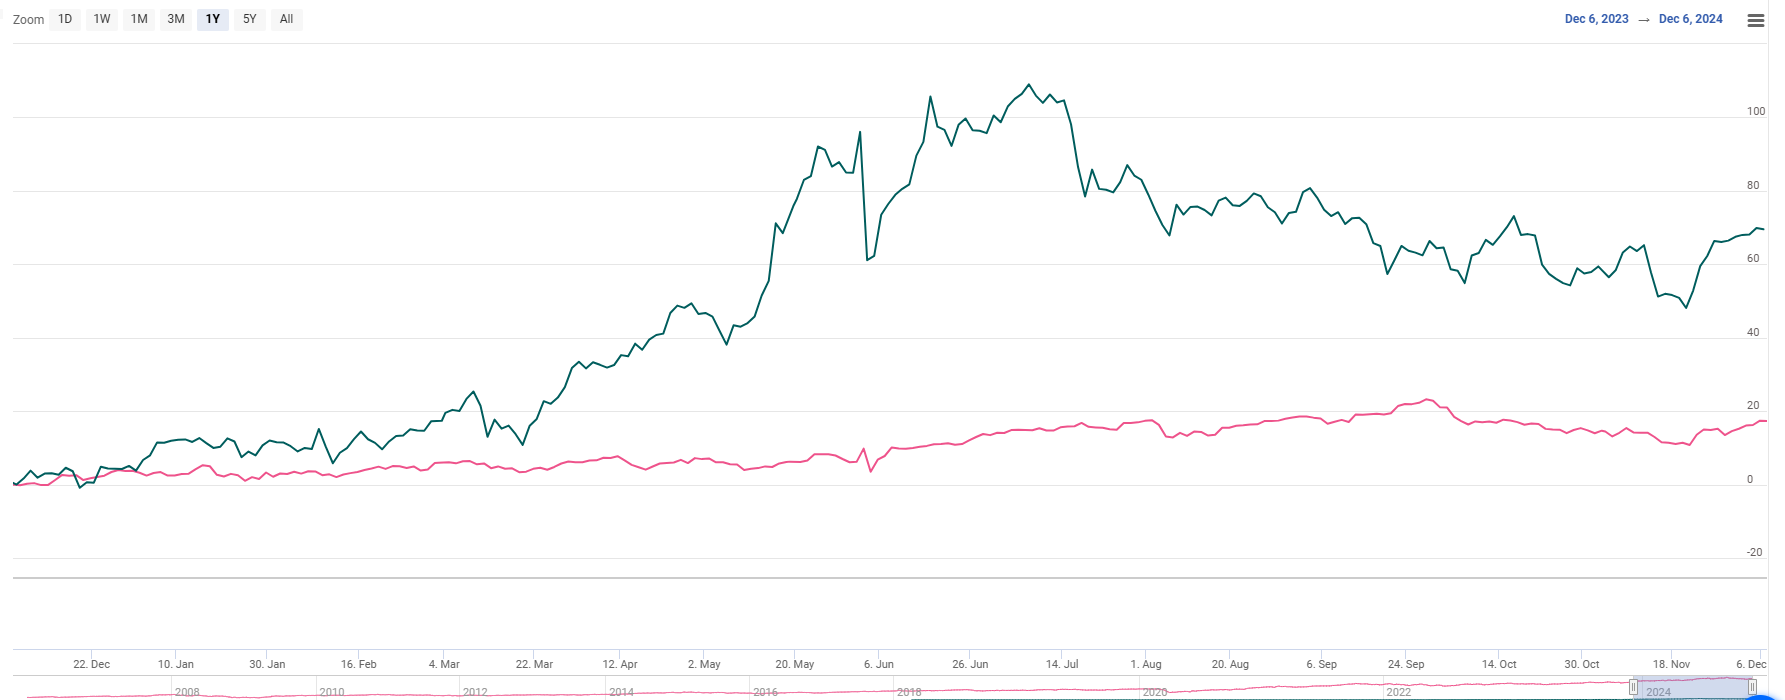
Indexed Stock Performance

Financial Highlights:
| Particulars Rs. In cr) | Q2FY25 | Q2FY24 | YoY (%) | Q1FY25 | QoQ (%) |
|---|---|---|---|---|---|
| Revenue from operations | 5976.00 | 5636.00 | 6.00% | 4348.00 | 37.00% |
| EBITDA | 1640.00 | 1528.00 | 7.00% | 991.00 | 65.00% |
| EBITDA Margin (%) | 27.44% | 27.11% | 33 bps | 22.79% | 465 bps |
| PAT | 1510.00 | 1236.00 | 22.00% | 1437.00 | 5.00% |
| EPS (Rs.) | 22.59 | 18.49 | 22.00% | 21.49 | 5.00% |
Source: Company Filings; stockaxis Research
Q2FY25 Result Highlights
Hindustan Aeronautics Ltd (HAL) has achieved exceptional growth through strategic
execution and stringent cost control measures, positioning itself as a leader in
the aerospace and defence sector. Consolidated Revenue for the quarter stood at
Rs.5976 crores, a growth of 6%YoY. This growth was driven by the successful execution
of major orders, including Dornier aircraft, Twin Seater LCA Tejas, and Tejas Mk-1A.
EBITDA grew by 7% YoY to Rs.1640 cr while Margins were maintained at 27%. Profit
after tax (PAT) surged 22% YoY, reaching Rs 1,510 crores, propelled by higher other
income aided by steady overall performance.
Key Conference call takeaways
Guidance: The company has sustained its growth trajectory despite geopolitical challenges and expects to maintain this momentum with a projected growth rate of 12-15% in the upcoming years. It anticipates securing orders valued at Rs 1,60,000-1,70,000 crores over the next three years, reflecting its positive outlook for future growth. The company is optimistic about its long-term prospects and foresees a continued and consistent increase in the medium term.
Maharatna status: During the quarter, HAL was granted the “Maharatna” status by the Department of Public Enterprises, Ministry of Finance, Government of India
Outlook & valuation
HAL delivered better than expected earnings growth for the quarter ended Q2FY25 due to healthy execution. We believe HAL is a long-term play on the growing strength & modernization of India’s air defense given: 1) it is the primary supplier of India’s military aircraft, 2) long-term sustainable demand opportunity owing to the government’s push on Indigenous procurement of defense aircraft, 3) robust order book with a 3-year pipeline of Rs.94000 cr, 4) HAL’s technological capabilities due to development of advanced platforms (Tejas, AMCA, GE-414 & IMRH engines, etc.), and 5) improvement in profitability via scale & operating leverage, despite the short-term financial fluctuations attributed to the supply chain difficulties encountered in fulfilling the substantial Tejas MK I A orders. HAL boasts of a robust unexecuted order book of Rs.94000 cr at the end of October 2024 that provides revenue visibility. Execution of the order book is the key thing to watch out for going forward. At a CMP of 4570, the stock is trading at 39x FY26E. We maintain a ‘Hold’ rating on the stock.
Consolidated Financial statements
Profit & Loss statement
| Particulars Rs. In cr) | Q2FY25 | Q2FY24 | YoY (%) | Q1FY25 | QoQ (%) |
|---|---|---|---|---|---|
| Revenue from operations | 5976.00 | 5636.00 | 6.00% | 4348.00 | 37.00% |
| COGS | 2446.00 | 2352.00 | 4.00% | 1451.00 | 69.00% |
| Gross Profit | 3530.00 | 3284.00 | 7.00% | 2897.00 | 22.00% |
| Gross Margin (%) | 59.07% | 58.27% | 80 bps | 66.63% | (756 bps) |
| Employee benefit expenses | 1375.00 | 1196.00 | 15.00% | 1248.00 | 10.00% |
| Other expenses | 515.00 | 560.00 | -8.00% | 658.00 | -22.00% |
| EBITDA | 1640.00 | 1528.00 | 7.00% | 991.00 | 65.00% |
| EBITDA Margin (%) | 27.44% | 27.11% | 33 bps | 22.79% | 465 bps |
| Depreciation expenses | 178.00 | 350.00 | -49.00% | 149.00 | 19.00% |
| EBIT | 1462.00 | 1178.00 | 24.00% | 842.00 | 74.00% |
| Finance cost | - | - | - | ||
| Other Income | 542.00 | 469.00 | 16.00% | 736.00 | -26.00% |
| Profit before share of associates | 2004.00 | 1647.00 | 22.00% | 1578.00 | 27.00% |
| Share of profit of associates | 12.00 | 4.00 | 200.00% | 6.00 | 100.00% |
| PBT | 2016.00 | 1651.00 | 22.00% | 1584.00 | 27.00% |
| Tax expenses | 512.00 | 415.00 | 23.00% | 147.00 | 248.00% |
| PAT | 1510.00 | 1236.00 | 22.00% | 1437.00 | 5.00% |
| EPS (Rs.) | 22.59 | 18.49 | 22.00% | 21.49 | 5.00% |