
Garware Hi-Tech Films Ltd
Quarterly Result - Q2FY25
Garware Hi-Tech Films Ltd
Plastic Products - Packaging
Current
Previous
Stock Info
Shareholding Pattern
Price performance
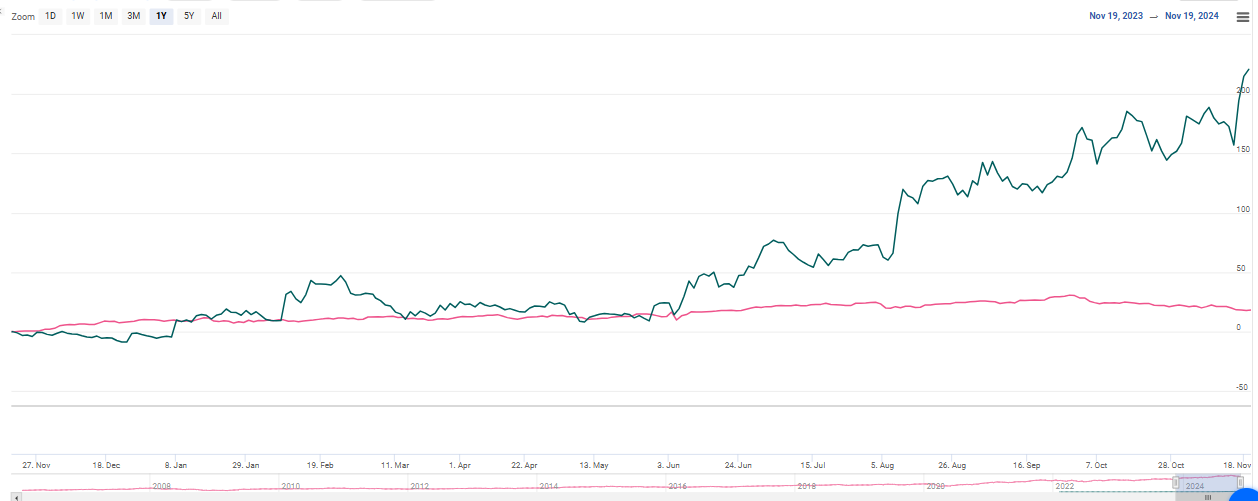
Indexed Stock Performance
Financial Highlights:
| Particulars (in Rs. Cr) | Q2FY25 | Q2FY24 | YoY (%) | Q1FY25 | QoQ (%) |
|---|---|---|---|---|---|
| Revenue from Operations | 621.00 | 397.00 | 56.00% | 474.00 | 31.00% |
| EBITDA | 151.00 | 74.00 | 104.00% | 130.00 | 16.00% |
| EBITDA Margin (%) | 24.32% | 18.64% | 568 bps | 27.43% | (311 bps) |
| PAT | 104.00 | 46.00 | 126.00% | 88.00 | 18.00% |
| EPS (Rs.) | 44.88 | 19.76 | 127.00% | 38.03 | 18.00% |
Source: Company Filings; stockaxis Research
Q2FY25 Result Highlights
Garware Hi-tech Films (GHFL) reported the highest ever consolidated numbers on all
fronts. Consolidated net sales rose 56% YoY to Rs.620.6 cr as compared to Rs.397
cr in the same quarter of the corresponding fiscal. Growth is primarily fuelled
by robust sales momentum in SCF (Solar Control Films) and PPF (Paint Protection
Films), apart from product expansion across all segments. Strong efforts in Sales
and Marketing led to a substantial increase in high-end SCF and PPF business. The
architectural segment of SCF witnessed high growth with the introduction of new
products. On the operating front, consolidated EBITDA surged to Rs.151cr and recorded
a growth of 104% YoY while margins expanded by 568 bps YoY to 24.32%. A significant
improvement in EBITDA margins is primarily due to increased sales of high-end products
across all segments. PAT more than doubled to Rs.104 cr because of a better product
mix and better realization of the specialty products. Notably, exports accounted
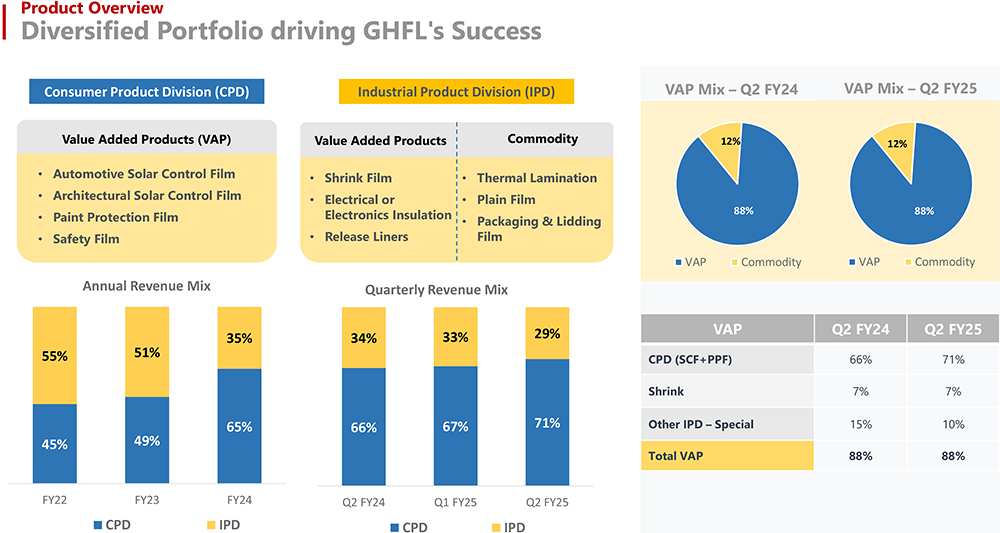
for approximately 81.3% of the Q2 FY25 revenue, with around 88% coming from value-added
firms.
Key Conference call takeaways
Guidance: (i) Management is confident of reaching Rs. 2,500 crores of revenue in FY25, (ii) the Company expects the PPF business to grow by 30-40% in the next two years and settle at 20% thereafter, (iii) SCF segment is expected to grow at 20-30% in FY25.
Key Takeaways
Segment Performance:
- SCF, PPF, and IPD are driving excellent growth.
- CPD (including SCF and PPF) now contributes 71% of total revenue (up from 66% in Q2 FY24).
Paint Protection Films (PPFs) Market
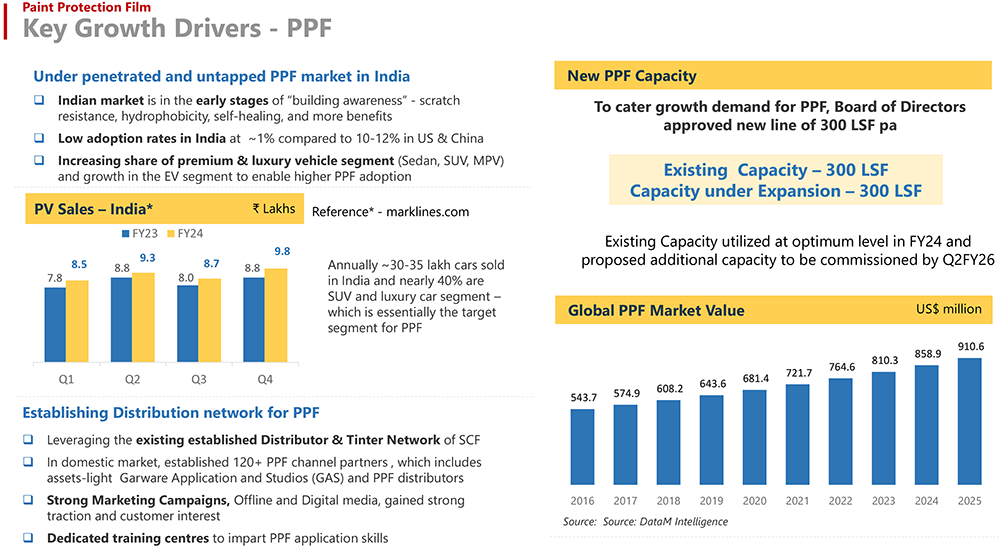
- Anticipated 5x growth in the PPF market in India.
- A new PPF line with an annual capacity of 300 lakh square feet is on track for commercial production by Q2FY26.
Capacity Utilization
- SCF lines are running at full capacity; PPF lines at 135-140% utilization.
Product Launches
- Colored PPF launched at SEMA, which is targeting competitors like Tesla.
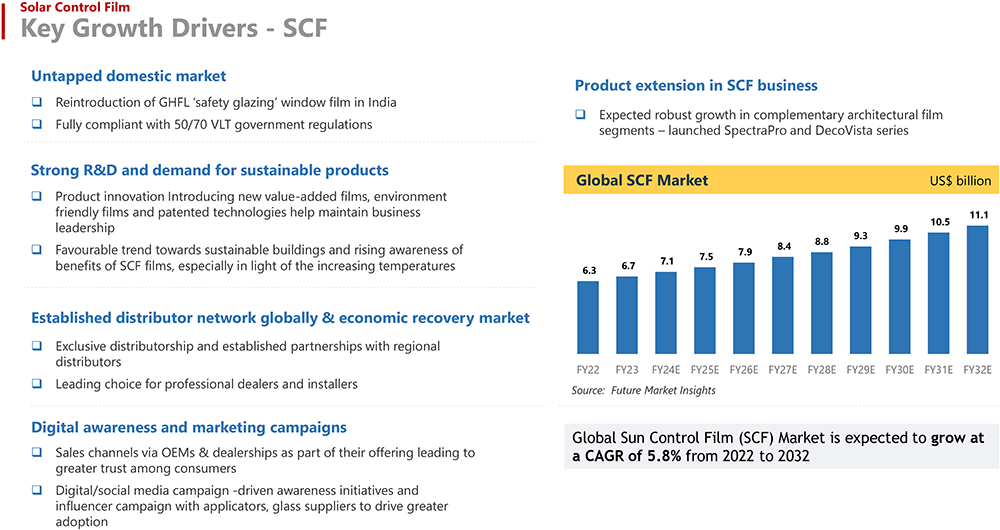
- Spectra Pro &DecoVista architectural films launched, and Safety Glazing Film reintroduced in India.
Capex & Capacity Expansion
- The new PPF production line (annual capacity of 300 lakh sq. ft.) is expected to become operational from Q2 FY26.
- The management is also exploring further expansion opportunities.
Seasonality
- Q3 sales are typically lower due to seasonal effects, especially in SCF.
Distribution Network
- Strong global network: 5,000+ tinters and 160+ PPF distributors in India.
- Comprehensive training programs for applicators and tinters to maintain high quality and standards.
Future Strategies
- Continued focus on high-margin, specialty products to reduce reliance on low-margin commodities.
- Entering new geographies with teams in five countries and expanding into Tier 2 and Tier 3 cities in India.
Near-term Concerns
- Global geopolitical tensions and economic uncertainties could impact performance.
- Potential inflationary impacts from US policies and rising input costs could impact margins going forward.
- Seasonality – Q3 traditionally experiences lower sales due to seasonal factors, especially affecting the SCF segment.
Outlook & valuation
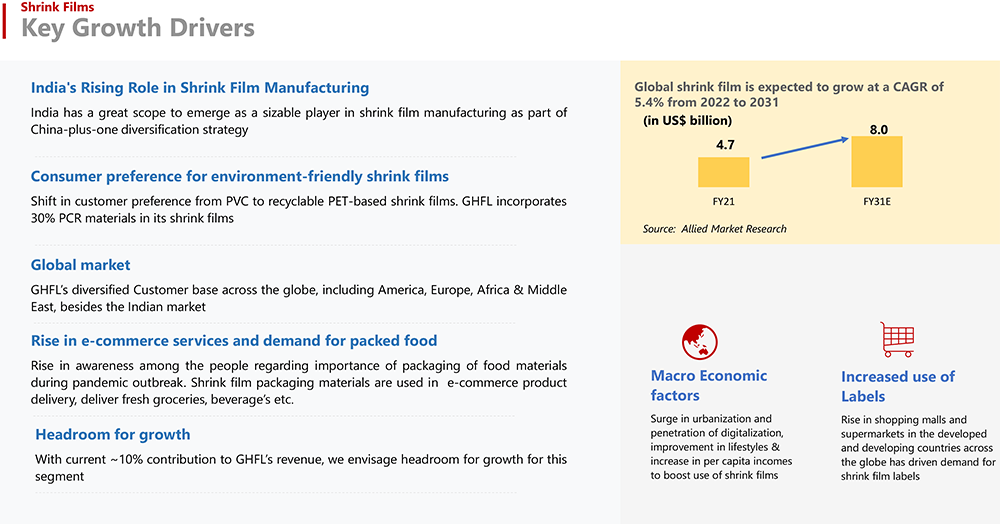
Garware Hi-tech films (GHFL) posted stellar earnings growth driven by significant growth in the Sun Control Films (SCF), Paint Protection Films (PPF) and Industrial Products Division (IPD) segments led by focused efforts in Sales and Marketing and addition of newer geographies. GHFL is the leading manufacturer and supplier of high-quality, durable, and highly tensile polyester films, solar control films, and paint protection films internationally. We are bullish on the company’s growth prospects as Capacity expansion (PPF) and strong traction in architectural segment act as key catalysts for the company’s growth. New domestic automotive rules now allow the usage of safety glazing materials in automobiles, which will increase domestic demand of SCF as GHFL is the sole manufacturer of safety glazing film, conforming to new standards.
Management is optimistic regarding future growth of the PPF business and has debottlenecked one line for future growth. The company expects this business to grow by 30-40% in the next two years and settle at 20% thereafter. GHFL is the third largest branded player in the U.S. and European SCF markets. GHFL can expand PPF’s distribution network and increase its visibility by leveraging SCF’s existing distribution networks. The company is going to double the PPF capacity with a capex of Rs. 125 crores and it will drive additional Rs. 300-350 crores revenue. Steady track record of growth and encouraging growth prospects makes it a compelling investment bet. At CMP of Rs.4680, the stock is trading at 24x FY26E. We maintain HOLD rating on the stock.
Consolidated Financial statements
Profit & Loss statement
| Particulars (in Rs. Cr) | Q2FY25 | Q2FY24 | YoY (%) | Q1FY25 | QoQ (%) |
|---|---|---|---|---|---|
| Revenue from Operations | 621.00 | 397.00 | 56.00% | 474.00 | 31.00% |
| Other Income | 14.00 | 9.00 | 56.00% | 11.00 | 27.00% |
| Total Income | 634.00 | 406.00 | 56.00% | 485.00 | 31.00% |
| Cost of Goods Sold | 307.00 | 188.00 | 63.00% | 187.00 | 64.00% |
| Gross Profit | 327.00 | 218.00 | 50.00% | 298.00 | 10.00% |
| Gross Profit Margin (%) | 52.66% | 54.91% | (231) bps | 62.87% | (1021) bps |
| Employee benefit expenses | 43.00 | 33.00 | 30.00% | 41.00 | 5.00% |
| Other expenses | 133.00 | 111.00 | 20.00% | 128.00 | 4.00% |
| EBITDA | 151.00 | 74.00 | 104.00% | 130.00 | 16.00% |
| EBITDA Margin (%) | 24.32% | 18.64% | 568 bps | 27.43% | (311 bps) |
| Depreciation and amortisation expenses | 10.00 | 10.00 | 0.00% | 10.00 | 0.00% |
| EBIT | 141.00 | 64.00 | 120.00% | 120.00 | 18.00% |
| Finance cost | 2.00 | 4.00 | -50.00% | 2.00 | 0.00% |
| PBT | 138.00 | 61.00 | 126.00% | 118.00 | 17.00% |
| Tax expenses | 34.00 | 15.00 | 127.00% | 29.00 | 17.00% |
| PAT | 104.00 | 46.00 | 126.00% | 88.00 | 18.00% |
| EPS (Rs.) | 44.88 | 19.76 | 127.00% | 38.03 | 18.00% |