Eris Lifesciences Ltd
Quarterly Result - Q1FY25
Eris Lifesciences Ltd
Pharmaceuticals & Drugs - Domestic
Current
Previous
Stock Info
Shareholding Pattern
Price performance
Indexed Stock Performance
Financial Highlights:
| Particulars (Rs. in cr) | Q1FY25 | Q1FY24 | YoY (%) | Q4FY24 | QoQ (%) |
|---|---|---|---|---|---|
| Revenue from operations | 720.00 | 467.00 | 54.00% | 551.00 | 31.00% |
| EBITDA | 249.00 | 171.00 | 46.00% | 149.00 | 67.00% |
| EBITDA Margin (%) | 34.58% | 36.62% | (204 bps) | 27.04% | 754 bps |
| PAT | 89.00 | 93.00 | -4.00% | 79.98 | 11.00% |
| EPS (Rs.) | 6.11 | 6.97 | -12.00% | 5.22 | 17.00% |
Source: Company Filings; stockaxis Research
Q1FY25 Result Highlights
Eris Lifesciences delivered in-line numbers for the quarter ended Q1FY25. Consolidated
net sales rose 54% YoY to Rs.720 cr aided by integration of Swiss parental and Biocon’s
nephro and derma business. Among various business acquired in FY24 - Biocon Nephro
and derma business reported 25% YoY growth, Swiss Parenterals reported Rs730mn of
revenues and Biocon branded formulation business grew by 13% YoY in Q1. Gross Margin
is down by 829 bps in Q1 due to significant changes in product/ business mix. However,
consolidated EBITDA witnessed a significant growth of 47% YoY to Rs.249 cr. OPM
came in at 34.5%. The YoY decline of 180bps was on account of integration of Biocon
and Swiss Parenteral business. Base business OPM stood at 39%. PAT fell 4% YoY to
Rs.89 cr reflects impact of all acquisitions and increase in book tax rate.
Net Debt of the company as on 30th June = INR 2,737 crores
DOMESTIC BRANDED FORMULATIONS – BASE BUSINESS HIGHLIGHTS (AWACS)
- Q1 growth stood at 12.7% vs. CVM growth of 8.1% - ahead of market by 460 bps - market-beating growth in 4 out of top 6 therapies.
- Oral Anti-Diabetes market share grows to 5.6%.
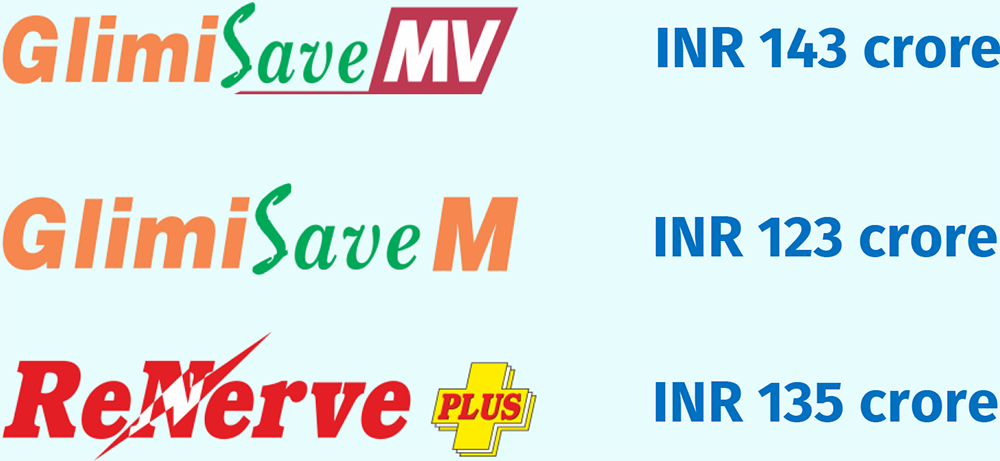
- Robust growth in all three “100+ crore” brands:

- New Product launch and scale-up: Eris ranks 3 rd* in the IPM in New Products Count and Value (MAT Jun 24).
Base Business Q1 Financial Performance
- Q1 Organic revenue growth 10%.
- Q1 Gross Margin 86% - up by 282 bps on a yoy basis.
- Q1 EBIDTA Margin 39% - up by 185 bps on a yoy basis due to productivity gain, gross margin improvement and better fixed cost leverage.
- Derma portfolio Q1 Gross Margin up by 400 bps to 80% on account of insourcing (initiated in Jan 2024).
BIOCON 1 – BUSINESS SEGMENT
- Q1 revenue growth of 16% driven by strong growth in power brands, with a Q1 YPM of INR 7.43 lakh.
- Q1 Gross Margin up by ~ 1,500 bps to 65% –
- Q1 EBIDTA margin 39% vs. 19% at the time of acquisition – represents a gain of 2,000 bps in just 6-7 months from acquisition.
BIOCON 2 BUSINESS SEGMENT
- Integrated well ahead of schedule; delivered 13% revenue growth in Q1 FY25 with a YPM of INR 7.8 lakh.
- Oncology & Critical Care – New product launches lined up; a good portion of the critical care portfolio is now getting manufactured at the Swiss facilities.
- Q1 Gross Margin ~ 40% – we expect a further upside of up to 1,000 bps driven by sourcing initiatives.
- Q1 EBIDTA margin 19% -
- Insulin Segment (Basalog and Insugen)
Marks the addition of two more power brands to our “100+ crores club” – bringing the total of our “100+ crores” brands to Five
SWISS PARENTALS
- Q1 headline financials - Revenue stood at Rs.73 crores and EBIDTA Rs.26 crores
Key Conference call takeaways
Base Business
- Organic growth pegged at 12-14% with robust growth in power brands.
- EBIDTA margin of 37% in FY25.
Biocon Business
- Total revenue growth of 27% at Rs.585 cr with EBIDTA margin of 30% (across both segments acquired).
- New product launches to expand CVM and broaden our base.
- EBIDTA margin expansion 1,000 bps driven by synergies from integration.
Swiss Parentals
- Revenue ~ Rs. 330 crores with EBIDTA margin of 35%.
- Expand product portfolio and market reach in export markets.
- Build the foundation for scale-up of OSD exports starting FY26.
- 185 New Dossiers filed in Q1 across 42 countries.
- 11 new products filed in Q1 in the segments of Ophthalmology, CNS and Antibiotics.
- R&D pipeline of 90+ products.
- Confirmed order book of ~ INR 130 crores for delivery in FY25
Guidance – Management has guided for Rs.3000 cr+ revenues with EBITDA of 35% in FY25.
Capex pegged at Rs.100-120 cr. for Hormones, Insulins & MABs.
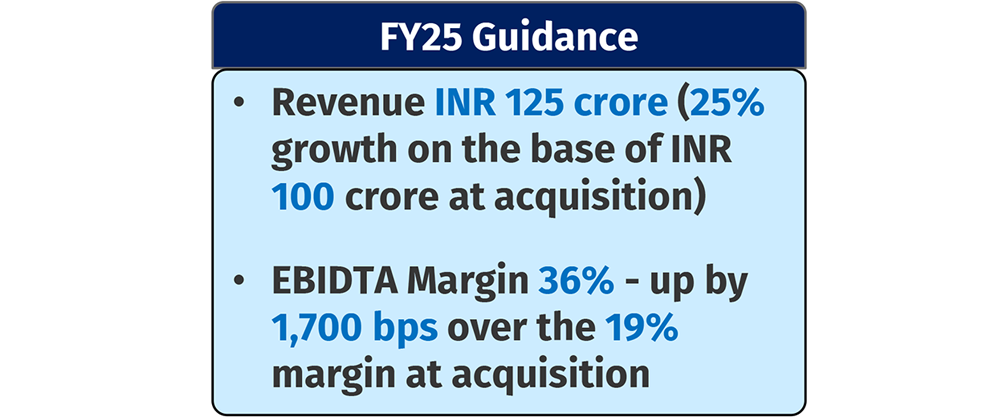
Biocon 1 Business Segment (Guidance for FY25)

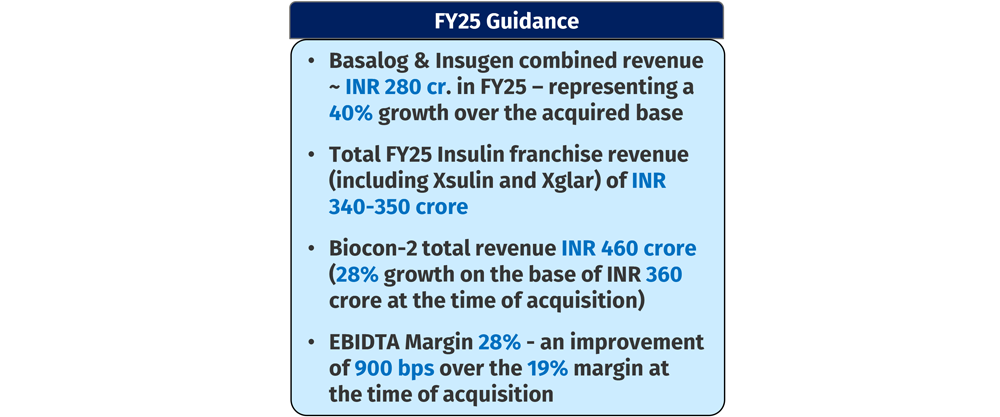
Biocon 2 Business Segment (Guidance for FY25)
Other Key takeaways
- Top three therapies (anti-diabetes, cardiovascular, VMN) account for 62% of portfolio while emerging therapies (derma, insulins, women's health, CNS, oncology, critical care, nephro) account for 38%. Market share in oral anti diabetic market stands at 5.6% with improved performance from large brands.
- Biocon Derma +Nephro biz: Its Derma and Nephrology portfolio delivered 16% YoY revenue growth. Derma portfolio has 80 MRs with PCPM of 0.75mn\month. Guided for 25% revenue growth with OPM of 36%.

Outlook & valuation
Eris Lifesciences reported in-line set of earnings for the quarter ended Q1FY25. Eris has opted for inorganic route to diversify and scale up existing portfolio. This has been implemented without diluting margins. We expect margins to sustain at +35% as revenue scales up from recent acquisitions which is currently operating at sub optimal profitability. Acquisitions, including Swiss Parenterals and Biocon's injectable business, are expected to contribute to ERIS growth trajectory in the medium term. ERIS is also working on launching over 20 'first-to-market' products, showcasing a strong focus on innovation. The company's robust product pipeline and expected patent expirations in key therapeutic areas contribute to a positive outlook. ERIS Lifesciences Ltd exhibits strong growth potential, driven by its innovative product pipeline, strategic acquisitions, and anticipated performance in key therapeutic segments.
The company has multiple growth levers such as broad-based offerings in the derma segment, opportunities in cardio metabolic market with patent expirations, and benefits of operating leverage, as revenue scales up from these acquisitions. We expect ERIS to outperform the industry over the near to medium term, as it has established its presence in the cardiac/ant diabetic segments. Additionally, the new product pipeline and patent expiries provide robust growth visibility in the future. Through the organic and inorganic routes, ERIS has enhanced its offerings in dermatology, nephrology, women’s healthcare, injectables, and intensified its diabetology/cardio-vascular portfolio. At CMP of Rs.1195, the stock is trading at 30x FY26E. We maintain HOLD rating on the stock.
Consolidated Financial statements
Profit & Loss statement
| Particulars (Rs. in cr) | Q1FY25 | Q1FY24 | YoY (%) | Q4FY24 | QoQ (%) |
|---|---|---|---|---|---|
| Revenue from operations | 720.00 | 467.00 | 54.00% | 551.00 | 31.00% |
| COGS | 181.00 | 78.00 | 132.00% | 118.00 | 53.00% |
| Gross Profit | 539.00 | 389.00 | 39.00% | 433.00 | 24.00% |
| Gross Margin (%) | 74.86% | 83.30% | (844 bps) | 78.58% | (372 bps) |
| Employee Benefit expenses | 133.00 | 104.00 | 28.00% | 102.00 | 30.00% |
| Other expenses | 157.00 | 114.00 | 38.00% | 182.00 | -14.00% |
| EBITDA | 249.00 | 171.00 | 46.00% | 149.00 | 67.00% |
| EBITDA Margin (%) | 34.58% | 36.62% | (204 bps) | 27.04% | 754 bps |
| Depreciation and amortisation expenses | 76.00 | 41.00 | 85.00% | 54.00 | 41.00% |
| EBIT | 173.00 | 130.00 | 33.00% | 95.00 | 82.00% |
| Finance cost | 60.00 | 17.00 | 253.00% | 33.00 | 82.00% |
| Other Income | 2.00 | 1.00 | 100.00% | 15.00 | -87.00% |
| PBT | 115.00 | 112.00 | 3.00% | 77.00 | 49.00% |
| Tax expenses | 26.00 | 19.00 | 37.00% | -2.98 | - |
| PAT | 89.00 | 93.00 | -4.00% | 79.98 | 11.00% |
| EPS (Rs.) | 6.11 | 6.97 | -12.00% | 5.22 | 17.00% |