Anant Raj Ltd
Quarterly Result - Q2FY25
Anant Raj Ltd
Construction - Real Estate
Current
Previous
Stock Info
Shareholding Pattern
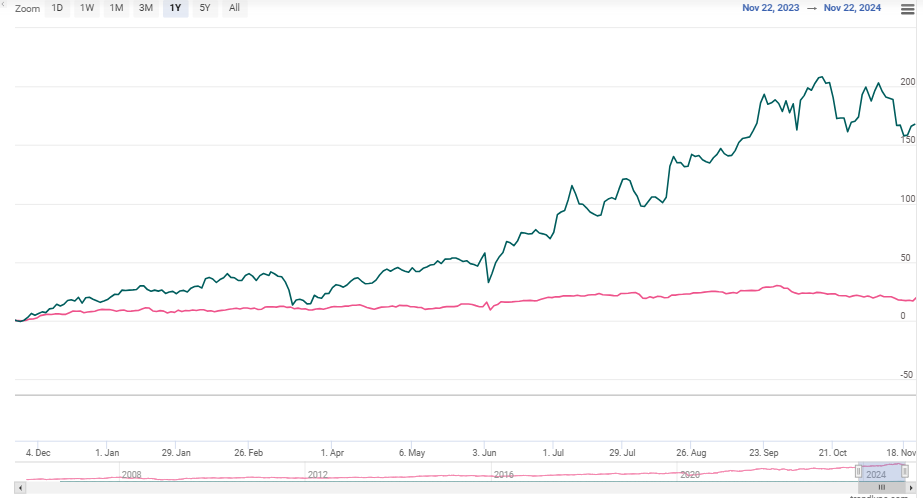
Price performance
Indexed Stock Performance

Financial Highlights:
| Particulars (Rs. In cr) | Q2FY25 | Q2FY24 | YoY(%) | Q1FY25 | QoQ (%) |
|---|---|---|---|---|---|
| Revenue from operations | 513.00 | 332.00 | 54.00% | 472.00 | 8.69% |
| EBITDA | 113.00 | 80.00 | 12.00% | 103.00 | 10.00% |
| EBITDA Margin (%) | 22.00% | 23.99% | (200) bps | 21.80% | 20 bps |
| PAT | 106.00 | 60.00 | 77.00% | 91.00 | 16.00% |
| EPS (Rs.) | 3.09 | 1.85 | 67.00% | 2.66 | 16.00% |
Source: Company Filings; stockaxis Research
Q2FY25 Result Highlights
Anant Raj demonstrated strong financial growth for the quarter ended Q2FY25.
Consolidated net sales rose 54% YoY to Rs.513 cr as compared to Rs.332 cr in the
same quarter of the preceding fiscal. Consolidated EBITDA witnessed a remarkable
growth of 41% YoY to Rs.113 cr while the EBITDA Margin expanded 18 bps QoQ and reduced
by 200 bps YoY at 22%. PAT registered a notable growth of 66% YoY to Rs.106 cr.
The company has significantly reduced its debt and expects to be net debt-free status
by the end of the calendar year 2024; Net debt ending Q2FY25 stood at Rs.96 crores
vs Rs.220 crores in Q1FY25.
Key Conference call takeaways
Data Centres
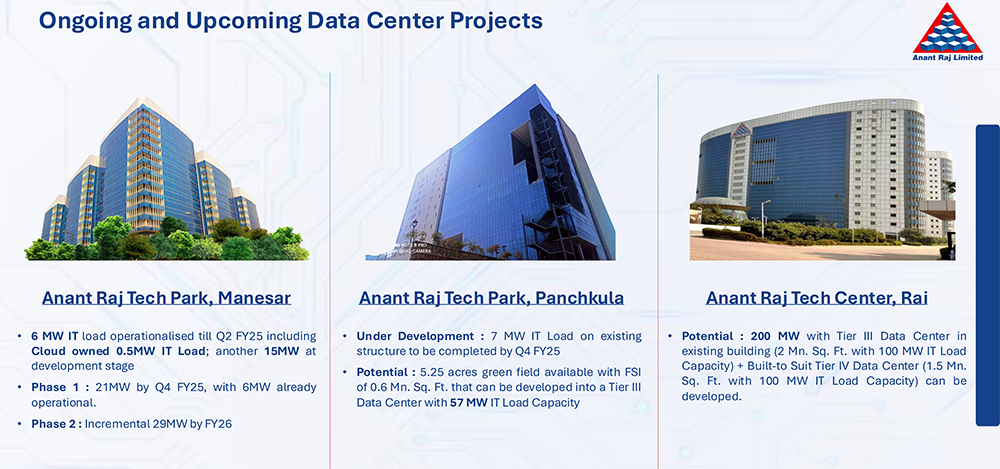
- Operating a 6 MW IT load at Manesar.
- The company plans to add a 5 MW data center at Manesar and another 7 MW data centre at Panchkula by FY25.
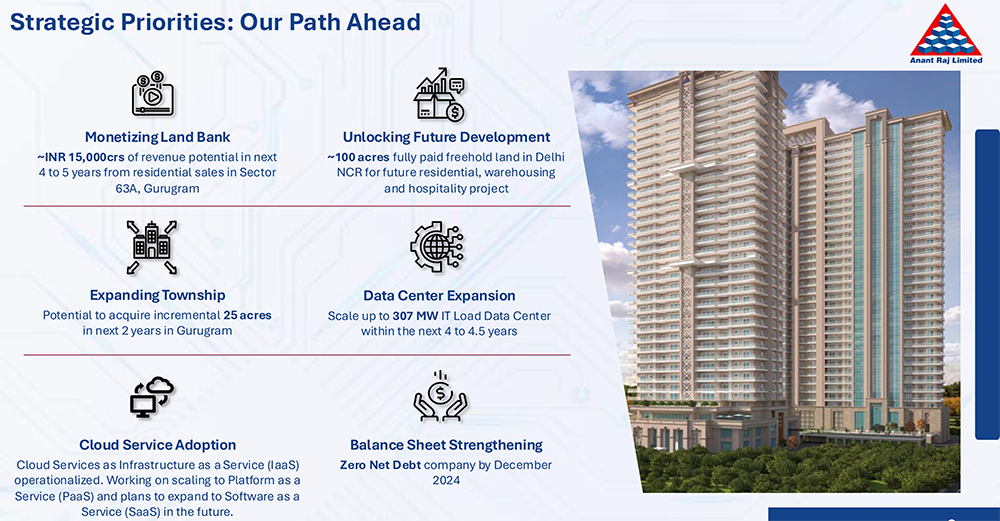
- Total data center capacity is expected to reach 28 MW by the end of FY25 and 63MW in FY26. Plan is to scale the capacity to 307 MW IT load in 4-4.5 years.
- Expansion to include sites in Manesar, Rai, and Panchkula.

Cloud Services Expansion
- The strategic partnership with Orange Business was signed in Q1FY25, for Infrastructure as a Service (IaaS). Plans to further expand cloud infrastructure, focusing on IaaS, co-location services, and AI-enabled solutions to enhance its offerings in collaboration with Orange Business.
- In Q2FY25, the company launched Ashok Cloud with a 0.5 MW IT load.
- Planned expansion into PaaS and SaaS offerings is on track.
- Out of the total data center capacity planned in FY26 of 63MW, 14 MW will be cloud-based.
- Revenue potential of Rs. 150cr per year per MW for cloud-enabled data centres.
Land Banks
- Anant Raj acquired 11.35 acres of land in Sector 63A, Gurugram during the quarter.
- This significantly enhances its development potential and future growth prospects.
- Plans for the Delhi land bank of ~101 acres will be revised after the release of the new master plan by the government
Residential Projects:
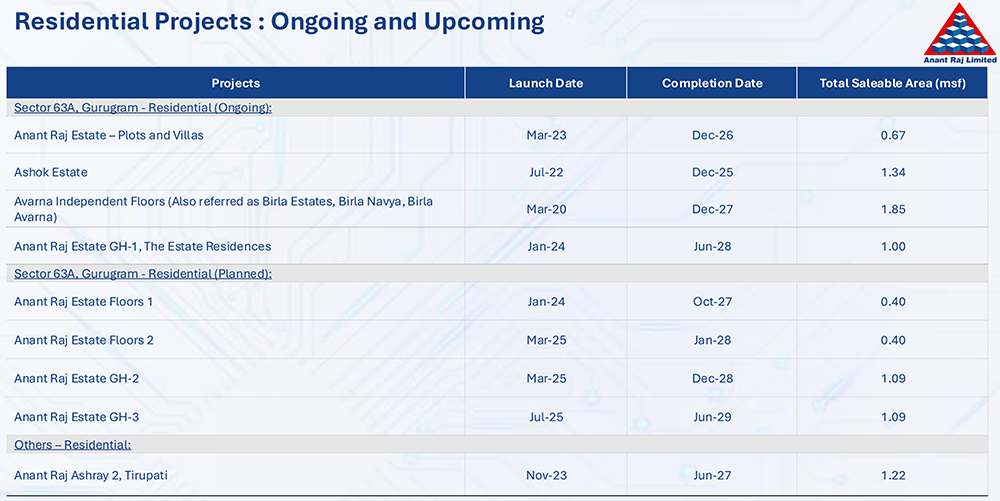
- Construction started on Estate Residences (Group Housing 1) and AR Ashray - 2.
- Handover commenced for 228 units at Birla Navya Phase 1.
Commercial Leasing:
- Full occupancy achieved at Sector-44, Gurugram office building.
- Tech Park in Panchkula reached 28% occupancy.
Debt
- Aiming to be net debt-free by December 2024.
Residential Project Launches
- Group Housing 2 and 3 launches expected with projected revenues of INR 2,100 crore and INR 2,500 crore respectively
- Township project in Sector 63A expected to generate INR 15,000 crore in revenue over 4-5 years.
Commercial Leasing
- Targeting to increase commercial leasing revenues 2.5-3 times of the current levels.
QIP & Funds Utilization
- The company announced a QIP of upto INR 2,000 crore in Q2FY25, along with a preferential warrant issue of INR 100 crore to promoters.
- The fundraising is primarily for adding 35MW of data center and cloud service expansion.
- Plans for further developments on the 101-acre land bank in Delhi.


Outlook & valuation
Anant Raj posted stellar earnings growth for the quarter ended Q2FY25. Anant Raj is one of the largest landowners in Delhi-NCR with a land bank of over 250 acres, spread across up-and-coming locations in Gurugram and Delhi. We expect a significant scale-up in Anant Raj’s pre-sales on i) a strong launch pipeline of over 5.5mn sq. ft. over the next 18 months on a land bank that is owned and fully paid for, ii) cyclical uptick in Delhi-NCR’s residential real estate market on growing demand and record low inventory levels, iii) increasing preference for branded premium products, and iv) increase in average realizations per sq. ft. on constrained supply in the industry coupled with Anant Raj’s improving product mix. We also see a significant surge in annuity income, led by, i) its foray into the data centre space where it plans to build and lease 28MW of IT load handling capacity by the end of FY25, and ii) steady growth in rentals in the current commercial annuity portfolio.
Anant Raj is also planning an expansion of leasable area by ~1.55mn sq. ft. at its commercial assets of Anant Raj Centre and Stellar resorts land parcel. India ranks among the fastest-growing data center markets in the APAC region and is one of the top 15 globally; Rapid capacity expansion and an evolving operator landscape are expected over the next five years and Anant Raj is well positioned to benefit from the emerging opportunities in the data center space. The Indian housing sector is on a cyclical upswing bolstered by enhanced social and lifestyle amenities, increased job prospects, numerous infrastructure initiatives, improved connectivity, and the burgeoning cloud computing sector, the demand is poised to sustain its momentum. At a CMP of Rs.520, the stock is trading at 25x FY26E. We maintain a HOLD rating on the stock.
Consolidated Financial statements
Profit & Loss statement
| Particulars (Rs. In cr) | Q2FY25 | Q2FY24 | YoY(%) | Q1FY25 | QoQ (%) |
|---|---|---|---|---|---|
| Revenue from operations | 513.00 | 332.00 | 54.00% | 472.00 | 8.69% |
| COGS | 377.00 | 239.00 | 58.00% | 350.00 | 7.93% |
| Gross Profit | 136.00 | 94.00 | 45.00% | 122.00 | 10.89% |
| Gross Margin (%) | 26.42% | 28.20% | (178) bps | 25.90% | 52 bps |
| Employee benefit expenses | 5.00 | 5.00 | 12.00% | 5.00 | 1.00% |
| Other expenses | 18.00 | 9.00 | 12.00% | 14.00 | 24.00% |
| EBITDA | 113.00 | 80.00 | 12.00% | 103.00 | 10.00% |
| EBITDA Margin (%) | 22.00% | 23.99% | (200) bps | 21.80% | 20 bps |
| Depreciation & Amortization | 8.00 | 4.00 | 102.00% | 5.00 | 48.00% |
| EBIT | 105.00 | 76.00 | 38.00% | 97.00 | 7.00% |
| Finance costs | 2.00 | 8.00 | -75.00% | 4.00 | -44.00% |
| Other Income | 11.00 | 9.00 | 22.00% | 10.00 | 12.00% |
| PBT | 114.00 | 76.00 | 50.00% | 104.00 | 10.00% |
| Tax expenses | 10.00 | 17.00 | -41.00% | 14.00 | -30.00% |
| PAT before share of profit in associates | 104.00 | 59.00 | 76.00% | 90.00 | 16.00% |
| Share of profit of associates | 1.00 | 2.00 | -26.00% | 1.00 | -18.00% |
| PAT | 106.00 | 60.00 | 77.00% | 91.00 | 16.00% |
| EPS (Rs.) | 3.09 | 1.85 | 67.00% | 2.66 | 16.00% |