Varun Beverages Ltd
Consumer Food
Varun Beverages Ltd
Consumer Food
Stock Info
Shareholding Pattern
Price performance
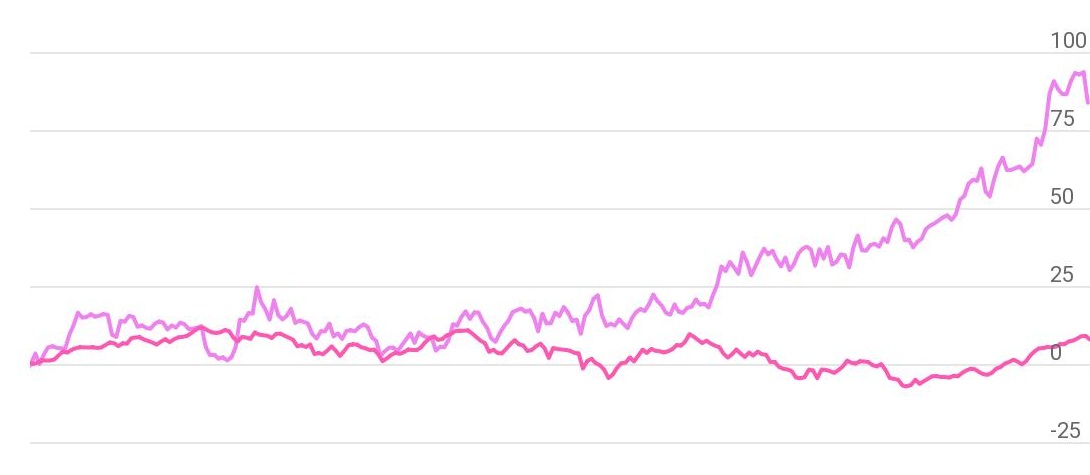
Indexed Stock Performance

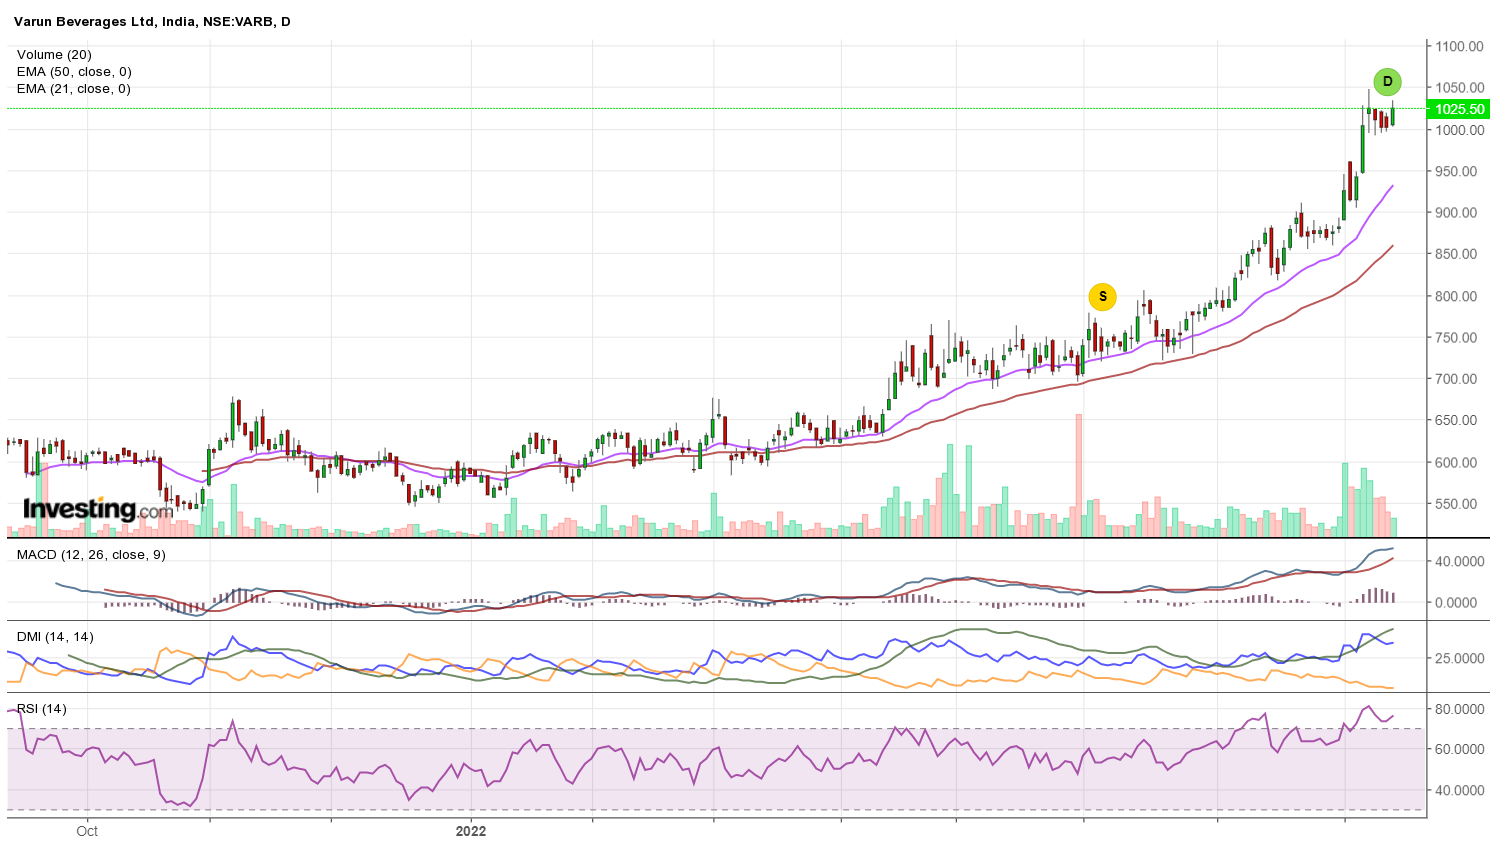
Parabolic curve pattern, ready for new highs

Price: VBL is in a secular bull run, trading in parabolic curve pattern in daily and weekly chart. The stock is currently placed above its 21EMA & 50EMA moving averages on daily & weekly time frames which indicates positive setup. The stock is trading above the upper band of the Bollinger Band indicating the volatility expansion on the higher side.
Indicator: The RSI on daily chart is pegged at 76.43, indicating strength and no sign of overbought. The signal line also suggests the upward move and more momentum is due in the counter from a near term perspective. The DMI + trading at 34.39 on daily chart, well above 25 marks, which shows overall strength is likely to bring in sustained buying from the current levels.
Volume: Price and volume pattern are moving in the same direction which reflects the true movements in the stock. VBL stock has seen the accumulation volume, which shows the movement of this stock, is on buy side.
Conclusion: As an investor one can accumulate around current level and Rs.1060 with keeping the stop loss Rs.910 for target Rs.1280 in 3 – 6 month of time frame.