
Tata Steel Ltd
Steel & Iron Products
Tata Steel Ltd
Steel & Iron Products
Stock Info
Shareholding Pattern
Price performance
Indexed Stock Performance

Established Player in the Steel industry
Company Profile
Tata Steel Ltd is a part of the widely diversified Tata Group and is present across
the entire value chain of steel manufacturing from mining and processing iron ore
and coal to producing and distributing finished products. The Company offers a broad
range of steel products including a portfolio of high value added downstream products
such as hot rolled, cold rolled, coated steel, rebar’s, wire rods, tubes and
wires. Further the product profile of the company comprises both flat and long products.
In addition to different varieties of steel, it is also a large producer of ferro-chrome
products. The company has an annual crude steel capacity of 34 million tons per
annum, of which 19.6 million tons of crude steel capacity is in India, and 12.1
million tons’ capacity is in Europe. In May 2018, it completed acquisition
of Bhushan Steel (BSL) Tata Steel BSL also completed acquisition of Bhushan Energy
in June 2019 to improve cost efficiency. In April 2019, it completed acquisition
of Usha Martin’s steel business through its subsidiary Tata Sponge Iron (now
known as Tata Steel Long Products), thereby expanding its long products portfolio.
Rationale for Investment
Established market position with a wide distribution reach
The company is world’s second-most geographically diversified steel producer
having operations that are fully integrated - from mining to the manufacturing and
marketing of finished products. The company’s operations are spread across
26 countries and commercial presence in over 50 countries. The company has a high
market share in the Eastern and Northern regions of India. Further we believe the
company has been able to operate the steel assets in India at its maximum capacity
due to superior product quality and wide distribution network. The company’s
channel partners and the Sampoorna digital platform is enabling efficient distribution
and enhancing customer experience through better collaboration along the distribution
network.
Diversified product segment with focus on innovative products
The company’s product portfolio spans across the flat and long product categories,
characterised by a high share of value-added and branded products, which support
higher margins and strengthen its operating profile. In FY20 for India operations,
~78% of sales was contributed by flat products and ~22% by long products. The company
has four segments such as i) Automotive & special products ii) Branded products
and retail iii) Industrial products and projects iv) downstream division. The company
has an established position in the domestic automobile flat product segment and
with the acquisition of Bhushan Steel and the alloy steel business of Usha Martin
Limited, we expect the company will further consolidate its leadership position
in the domestic automotive market.
Captive iron ore and coal provides cost efficiency
Tata Steel standalone steel business is amongst the lowest cost steel producers
globally, as it procures 100% of its iron ore requirement and around 30% of its
coking coal requirement from its captive mines, thus providing a distinct competitive
advantage over its peers. Due to captive consumption, the company’s domestic
profitability has remained partly insulated from the volatility in raw material
prices. Further we believe, this backward integration benefits the company in getting
significant operating leverage and aids in reporting healthy earnings through the
steel upcycle.
Debt reduction strategy shall lead to leaner and stronger balance sheet
The company is focused on debt reduction with deleveraging commitment of $ 1 billion
annually. Additionally, the company has reduced net debt by Rs 18609 crore in 9MFY21
whereas it reduced leverage by Rs 10325 crore in Q3FY21 and its net debt stood at
Rs 86170 crores as of December 2020. During Q3FY21, the company received ~ Rs 6000
crore on account of export advances (forward sell of export volumes), which helped
in reducing net debt. As part of the continued de-leveraging strategy, the company
aims to further reduce its gross debt by more than Rs 12000 crores in Q4FY21.
Outlook & Valuation
We believe the company shall capitalize on growth opportunities supported by i) elevated steel prices ii) deleveraging balance sheet and diversified product segments. Further we expect Tata steel BSL and Tata steel long products to continue deliver improvements in operating business which will translate into better profitability and also Tata steel Europe to turnaround its business performance through transformation program. Further we expect the company to focus on conserving cash and ensuring adequate liquidity to face potential disruptions. At CMP, the stock is trading at 4.8x FY23E EV/EBITDA and we initiate our coverage on Tata Steel with a Buy Rating.
Consolidated Financial Statements
| Rs in Cr | Net Sales | EBITDA | EBITDAM | PAT | EPS | ROE | P/E | EV/EBITDA |
|---|---|---|---|---|---|---|---|---|
| FY18 | 132315.00 | 21801.00 | 16.00% | 13434.00 | 113.00 | 22.00% | 4.90 | 6.30 |
| FY19 | 167302.00 | 29619.00 | 18.00% | 10218.00 | 86.00 | 14.00% | 5.80 | 5.30 |
| FY20 | 148972.00 | 17801.00 | 12.00% | 1557.00 | 13.00 | 2.00% | 19.80 | 7.70 |
| FY21E | 151081.00 | 25737.00 | 17.00% | 8619.00 | 76.00 | 10.00% | 9.50 | 6.90 |
| FY22E | 160986.00 | 30420.00 | 19.00% | 13116.00 | 116.00 | 14.00% | 6.20 | 5.80 |
| FY23E | 169234.00 | 34190.00 | 20.00% | 16789.00 | 149.00 | 16.00% | 4.90 | 4.80 |
Investment Rationale
Established market position with a wide distribution reach
The company is world’s second-most geographically diversified steel producer
having operations that are fully integrated - from mining to the manufacturing and
marketing of finished products. The company’s operations are spread across
26 countries and commercial presence in over 50 countries. The company has a high
market share in the Eastern and Northern regions of India. Further we believe the
company has been able to operate the steel assets in India at its maximum capacity
due to superior product quality and wide distribution network. The company’s
channel partners and the Sampoorna digital platform is enabling efficient distribution
and enhancing customer experience through better collaboration along the distribution
network.
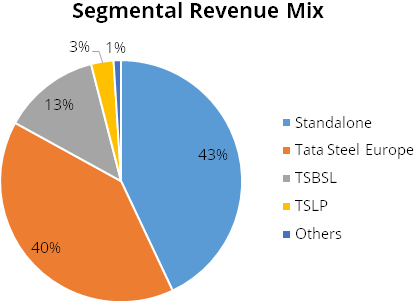
Diversified product segment with focus on innovative products
The company’s product portfolio spans across the flat and long product categories,
characterised by a high share of value-added and branded products, which support
higher margins and strengthen its operating profile. In FY20 for India operations,
~78% of sales was contributed by flat products and ~22% by long products. The company
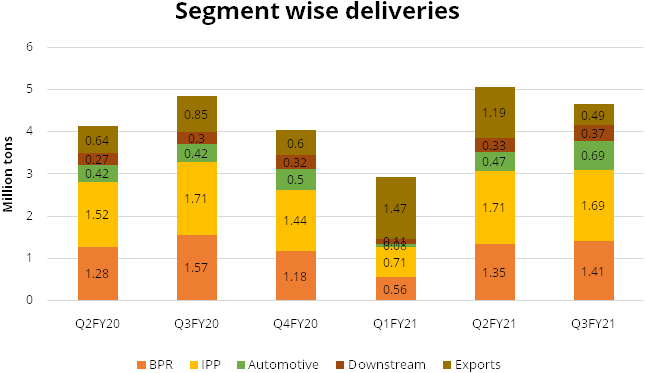
has four segments such as i) Automotive & special products: It launched digital
VAVE2 platform “e-DRIVE” which is first in India, enabling to engage
with automotive customers for the workshops virtually –ii) Branded products
and retail: B2C brands Tata Shaktee and Tata Tiscon achieved best-ever quarterly
sales, serving more than 1.5 lacs and 5.5 lacs consumers, respectively, in Q3FY21.
A new coated brand “Galvanova” was launched to meet the evolving needs
of customers with applications in appliances, false ceiling and solar segments and
also “Tata Astrum” was recognised as India’s Leading Brand for
2020 by ‘The Brand Story’, iii) Industrial products and projects: The
company entered into two new segments – Metro Railway and gas pipeline with
launch of ‘Sm@rtFAB’ (a prefabricated welded wire fabric solution) ,
it also received order of Tata TISCON CRS rebars for the prestigious New Parliament
Building Project with 100% share of business till date iv) downstream division includes
tubes, wires and bearings and it’s Tubes division achieved best ever quarterly
deliveries enabled by strong customers engagement and higher rural penetration.
The company aims to be a technology and innovation leader in the steel industry and is leveraging its in house potential and that of the external ecosystem through carefully curated collaborations and partnerships. With the growth in the economy, there is a large opportunity for new materials and applications in existing and emerging sectors, the company is focussing on creating new businesses in high-potential new materials such as Fibre Reinforced Polymer (FRP) composite and Graphene. FRP is a composite material that comprises of glass/carbon/other fibres; it is corrosion resistant, light weight and offers flexibility in designing. This business completed its first year of operations in FY20 and has developed products for the infrastructure and railways sectors. Major FRP applications constitute fencing, street furniture, translucent poles and foot-over bridges. In the industries segment, it supplies pressure vessels for water filtration and FRP tanks for the chemicals, paper and pulp, textile and iron and steel sectors. The company has installed 100 TPA graphene powder production, the world’s largest single site facility, at Jamshedpur. The company expects these new businesses to contribute approx. 10% of total revenues by 2025 and reduce the impact of cyclicality of the steel business.
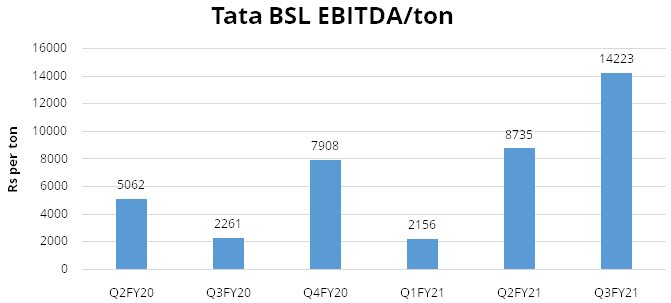
Tata Steel BSL ltd has a mix of blast furnace and electric furnace steelmaking capacity in the ratio of 75:25 and produces a mix of flat and long products. The company’s major products constitute - HR, pipe, sheets, cold rolled etc. The company’s downstream facilities were first Indian steel plant to supply skin panel to auto makers. It was also market leader in colour coated supplies to the appliances segment and had huge product range of tubes & pipes including world class large diameter pipes manufacturing. The company has an established position in the domestic automobile flat product segment and with the acquisition of Bhushan Steel and the alloy steel business of Usha Martin Limited, we expect the company will further consolidate its leadership position in the domestic automotive market.
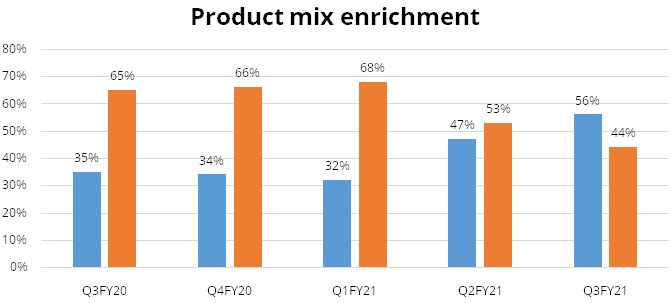
Tata Steel Long products is all set to scale up post-merger with Tata Metaliks (200 KTPA ductile iron pipe company in high growth water infrastructure segment) and Indian Steel and Wire Products (ISWP) (a downstream steel producer of nails, fasteners and welding products). The company is transforming into a high value added, diversified long product steel company with combination of integrated steel plants to drive scale and future growth. The company is continuously focusing on product mix enhancement and diversifying presence in automotive with strong recovery in market place.
Captive iron ore & coal provides cost efficiency
Tata Steel standalone steel business is amongst the lowest cost steel producers
globally, as it procures 100% of its iron ore requirement and around 30% of its
coking coal requirement from its captive mines, thus providing a distinct competitive
advantage over its peers. Due to captive consumption, the company’s domestic
profitability has remained partly insulated from the volatility in raw material
prices. Further we believe, this backward integration benefits the company in getting
significant operating leverage and aids in reporting healthy earnings through the
steel upcycle.
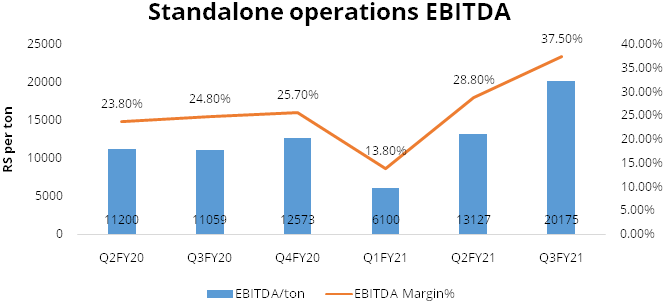
The company has captive mines for iron ore, coking coal, chrome ore, manganese ore and dolomite and has significantly expanded its captive iron ore production from 14mtpa in FY15 to 27mtpa in FY20 and also supplies iron ore to Tata BSL and Tata long products. Further Tata Steel mines are under the ‘captive’ category as of now and their leases shall terminate in March 2030. The company’s chromite mine leases were classified under the ‘merchant’ category and their leases had expired in March 2020. It has acquired these mines again through auctions by disbursing high premiums of 90-95% through its new mining vertical ‘Tata Steel Mining’ (formerly TS Alloys). The management estimates an additional annual outgo of Rs 500 crores as premium for these mines. The company’s standalone operations have had one of the highest EBITDA margins amongst other steel producers. The company’s robust product pipeline and low cost of conversion are among the key factors contributing to growth.
Debt reduction strategy shall lead to leaner and stronger balance sheet
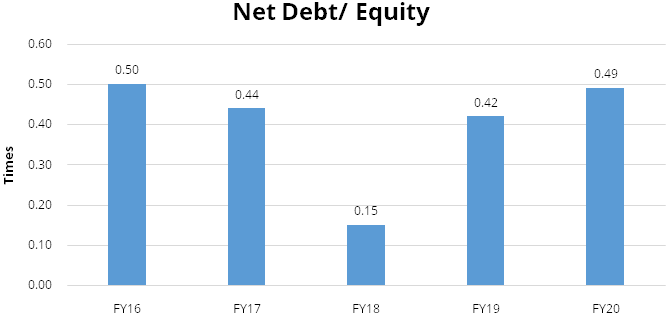
The company is focused on debt reduction with deleveraging commitment of $ 1 billion
annually. Additionally, the company has reduced net debt by Rs 18609 crore in 9MFY21
whereas it reduced leverage by Rs 10325 crore in Q3FY21 and its net debt stood at
Rs 86170 crores as of December 2020. During Q3FY21, the company received ~ Rs 6000
crore on account of export advances (forward sell of export volumes), which helped
in reducing net debt. As part of the continued de-leveraging strategy, the company
aims to further reduce its gross debt by more than Rs 12000 crores in Q4FY21.
The company has revised its target of domestic capacity to 25mtpa by 2025 from earlier target of 30 mtpa. We believe this is a step in the right direction as this will lead to avoidance of expensive acquisitions or additional leverage. Further we believe the emphasis on deleveraging is positive in the near-term and would allow for better focus towards integrating Bhushan Steel and rationalizing its numerous subsidiaries and business verticals. The company deleverages its balance sheet through internal cash flows and asset monetisation.
Capacity expansion to be margin accretive
The company has partly commenced the Kalinganagar Phase II (KPO II) expansion project
to increase its capacity from 3 million tons’ per annum to 8 million tons
per annum. This expansion shall consolidate its presence in the domestic market
in the long run and strengthen its product mix. The expansion project also involves
the setting up of raw material handling facilities and a cold rolling mill complex.
At present the company has been prioritizing the pellet plant for cost minimization
and the cold rolling mill for value addition due to capital restraint. The project
will be commissioned in phases and the proposed 5mtpa blast furnace will be amongst
the largest in the country.
Commissioned in 2016, the Kalinganagar plant Phase I (KPO I) attained production levels at its rated capacity in less than two years. The company’s major aim is to expand its capacity at KPO II by the end of FY22 as KPO I has proven to be very profitable due to its close proximity to iron ore mines leading to logistical benefits and being a state of the art mill with a better product profile. This capacity expansion to 8 mtpa (Phase II) shall augment their product portfolio with new value-added products while driving operational efficiency.
Focus on downstream product portfolio shall drive growth
The company has started the process of winding up non performing subsidiaries and
has proposed new structure for rationalizing subsidiaries and this is a positive
step as this would drive synergies across the group. The company has increased its
focus on the retail business and downstream product portfolio, to reduce the cyclical
pressures inherent in the steel business. It has commenced on building a Services
and Solutions (S&S) business for steel based solutions for end user industries
experiencing significant growth. The company developed 155 new products in FY20
in the high strength automotive structural applications. In long-products, it has
commercialised high-strength, high ductility rebar-grade products and low nitrogen
steel grade wire-rods.
Sustainable growth in Europe operations remains the key
The company initiated its inorganic expansion route in 2005 with the acquisition
of NatSteel, Singapore for $48.6 crores and a 67% stake in Millennium Steel, Thailand.
Consequently, it acquired a 20 mtpa steelmaking capacity in Europe through its extravagant
acquisition of Anglo-Dutch steel producer Corus Plc. for $13 billion in 2006 through
a bidding process and this acquisition was funded through a mix of equity and long-term
debt. This acquisition was the biggest overseas acquisition by an Indian company
and Tata Steel emerged as the fifth largest steel producer in the world after the
acquisition. There were many likely synergies between Tata Steel, the lowest-cost
producer of steel in the world, and Corus, a large player with a significant presence
in value-added steel segment and a strong distribution network in Europe. Among
the benefits to Tata Steel was the fact that it would be able to supply semi-finished
steel to Corus for finishing at its plants, which were located closer to the high-value
markets. Corus' expertise in making the grades of steel used in automobiles
and in aerospace could be used to boost Tata Steel's supplies to the Indian
automobile market. Corus in turn was expected to benefit from Tata Steel's expertise
in low cost manufacturing of steel. Corus had a wide variety of products and services
which comprise of the manufacturing of electrical steel, narrow strip, plates, packaging
steel, plated steel strip, semi-finished steel, tube products, wire rod and rail
products and services.
However, there were some pitfalls with the acquisition whereby Corus EBITDA margin at 8% was much lower than that of Tata Steel which was at 30% during the acquisition. Secondly the company started on taking on massive debt to fulfil this acquisition, considering Corus was almost 4x (in volumes) the size of the company at the time of acquisition. However, Corus saw sharp permanent decline in steel demand in Europe due to Global Financial Crisis. Over the years, the company has been rationalizing its European capacities, especially in the UK where it has sold majority of its capacity.
The company’s UK operations at Port Talbot Steel Works, Wales reported liquid steel production of 3.5 MT (Total Europe production: 10.3 MT) in FY20. Tata Steel Europe has commenced a company-wide “Transformation programme” to improve the performance of the business, helping it to become more sustainable and enabling investments necessary to secure its long-term future. We believe improvements in performance will come from productivity improvements, increase in sales of higher-value steels, and employment cost savings. During FY20, the “Transformation programme” delivered over £200 million worth of sustainable benefits and The Port Talbot Hot Strip Mill recorded its highest ever availability with inherent capability to exceed record production. Thereafter, the UK operations extended the successful ‘Sustainable Operational Excellence’ programme across the hub with many areas entering the sustainable phase. We believe such improvement initiatives like ‘Delivering Our Future’ programme shall lead to significant improvement in UK operations, thereby aiding the consolidated profits.
The company has also attempted to hive off its European steel operations by entering into a joint venture with German steel producer, ThyssenKrupp AG which was protested by anti-trust regulators in Europe and has since been called off. The company has also planned to divest its Asian steelmaking operations but nothing has been fructifying yet.
Financials
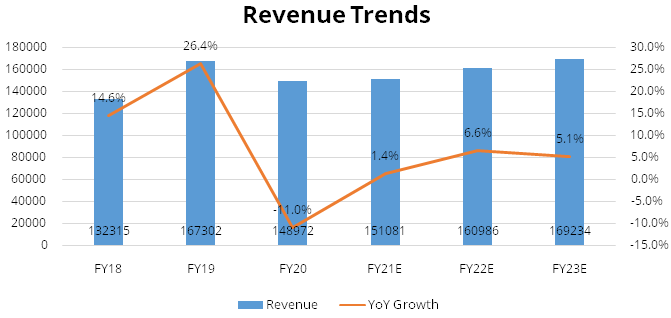
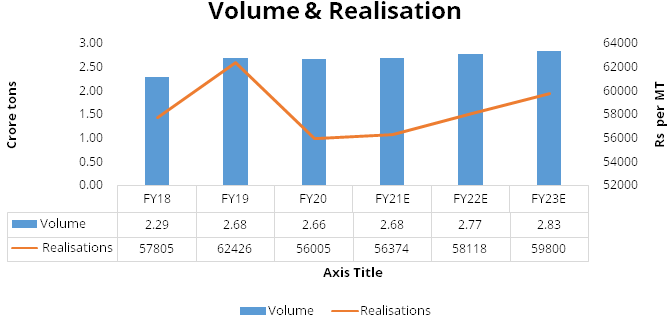
Revenue is expected to grow @~ 6% CAGR over FY21E-FY23E
We expect the company’s consolidated revenue to grow at ~6% CAGR over FY21E-FY23E
supported by i) buoyant Indian steel demand led by economic recovery, government
spending and easy liquidity. ii) robust Indian steel prices led by steel demand
recovery iii) Europe steel prices are expected to improve further due to strong
global steel prices iv) steady volume growth in Indian operations.
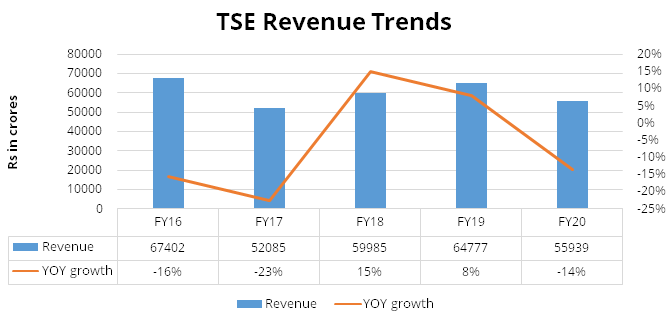
The company’s standalone operations have witnessed a steady volume growth over the last five years. The initial volume expansion was driven by the 3mtpa brownfield expansion at Jamshedpur, Jharkhand, followed by the 3mtpa greenfield expansion at Kalinganagar, Odisha.
EBITDA is expected to grow @~ 15% CAGR over FY21E-FY23E
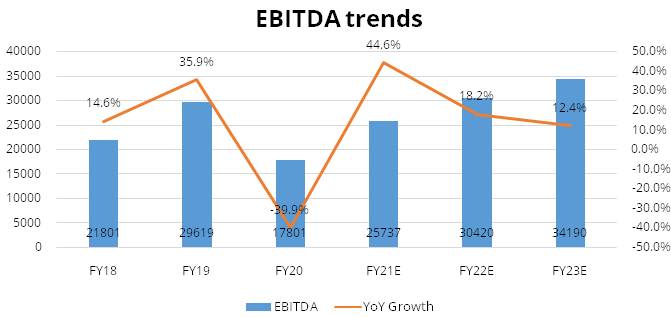
We expect EBITDA to grow at ~15% CAGR over FY21E-FY23E to Rs 34,190 crores and EBITDA
margins to expand by 320 bps to 20% over FY21E-FY23E aided by i) higher capacity
utilization at its Indian steel plants ii) softening of coking coal prices and cost
savings initiatives iii) favourable product mix on commissioning of Kalinganagar
plant second phase iv) shift in geographical mix from export market to domestic
region as realisations are higher.
Net Profit is expected to grow @~ 39% CAGR over FY21E-FY23E
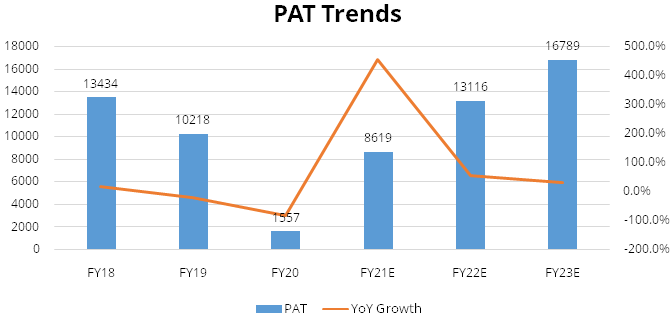
We expect Net profit to grow at ~39% CAGR over FY21E-FY23E to Rs 16788 crores and
PAT margins to expand by 420 bps to 9.9% over FY21E-FY23E aided by i) Debt reduction
strategy shall lead to leaner and stronger balance sheet ii) reduction in losses
from overseas operations iii) steady growth in volumes in domestic market.
Return Ratios
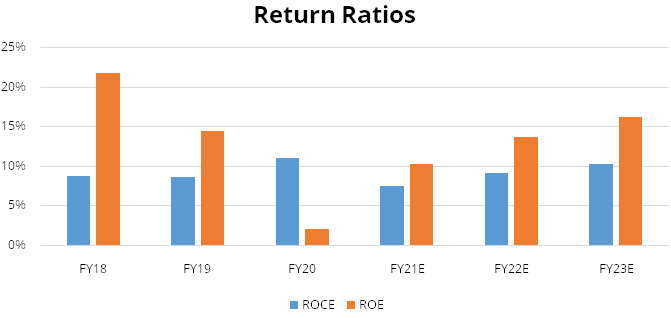
Return ratios fell in FY20 majorly due to weak pricing environment and are likely
to recover from base level in FY21, albeit minimal due to major impact on demand
due to pandemic scenario. Going forward, we expect big improvement in return ratios
over FY22-23 as volumes are likely to return to normal levels.
Industry
Global Steel Industry
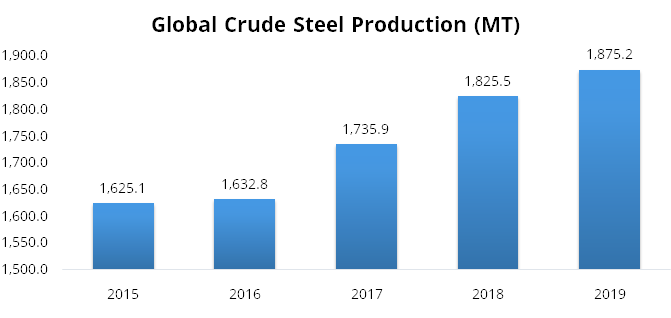
In 2019, the global crude steel production stood at 1,875.2 MT, compared to 1,825.5
MT in 2018, a growth of 2.72% YoY (Source: Worldsteel). This increase was primarily
due to the growth in steel consumption in infrastructure, manufacturing, and equipment
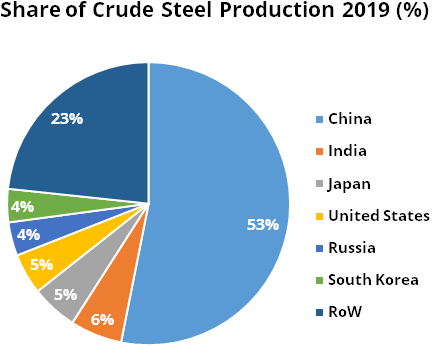
sectors. China, India, Japan and the USA continued to be the major contributors
in crude steel production, contributing 69.05% of the total world crude steel production.
In the wake of a protective market environment in key economies, the global steel
industry faced pricing pressure for most parts of 2019 which was further aggravated
due to country-specific demand slowdown. The consumer industries of steel undertook
active destocking which led to stunted capacity utilisation and resulted in net
excess capacity globally. This was further complemented by addition of new capacities
and resulted in downward pressure on steel prices.
Source: WorldSteel
China produces the largest quantity of steel in the world every year, producing more than half of the world’s steel. In 2019, China produced 996.3 MT of steel, a growth of 7.33% compared to last year. India is the second-largest producer of steel in the world. India’s crude steel production for 2019 was 111.2 MT, an increase of 1.9% from 2018. This is still a fraction of what China produces in a year. Japan produced 99.3 MT in 2019, a decrease of 4.8% vs 2018. The US produced 87.9 MT of steel in 2019, a growth of 1.33% from 2018.
Source: WorldSteel
The Covid-19 pandemic has severely affected economies and industries globally and the steel industry is no exception. As a result, the World Steel Association (World steel) forecasts that the steel demand will contract by 2.4% to 1,725.1 MT in 2020. Further, the association expects steel demand to recover to 1,795.1 MT in 2021, an increase of 4.1% compared to 2020. This view is more optimistic compared with the Short Range Outlook the association released in June 2020. The strong recovery in China will mitigate the reduction in global steel demand, while the post lockdown recovery in demand in the RoW has been stronger than that was earlier expected. However, that reduction in demand still resulted in a deep contraction in 2020 in both developed and emerging economies, with only a partial recovery expected in 2021.
A strong rebound in manufacturing will be counterbalanced by supply chain issues. However, steel consumers suffered less from the lockdown and are recovering faster than the hospitality, aviation and entertainment sectors. The construction sector has been more resilient as many governments focused on implementing public projects. Following the easing of lockdowns, construction sector recovery continued in the advanced economies, mostly driven by infrastructure investment, pent-up demand, low mortgage rates and easier access to credit.
Indian Steel Industry
India’s steel industry has witnessed a robust growth in the last 10-12 years
on account of sustained domestic demand. Since 2008, production has gone up by ~75%
while domestic demand has grown by ~80%. Further, the Government of India has supported
the industry and introduced the National Steel Policy in 2017 which envisions the
growth trajectory of the country’s steel industry till 2030.
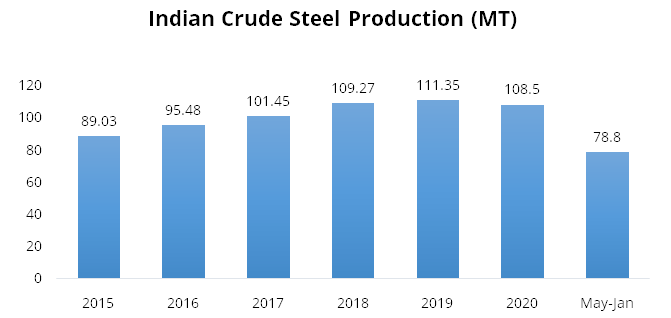
India is the second-largest crude steel producer in the world after China. As of 2019, the crude steel production stood at 111.35 MT. The production has grown at a CAGR of 5.75% between 2015 – 2019. Further, as per the National Steel Policy (NSP) 2017, the crude steel production is expected to reach at 255 MT by 2030 at a capacity utilisation of 85%. In 2020, the production was hit by -2.56% compared to 2019 and a sharp contraction of 19% in March due to Covid-19 pandemic. However, the production has witnessed growth from October 2020 and in the month of January 2021, the production stood at ~10MT, a growth of 7% compared to January 2020.
Source: WorldSteel, IBEF, StockAxis Research.
The National Infrastructure Pipeline (NIP) is a noteworthy initiative of the Government of India which holds tremendous opportunities for the growth of steel sector. The NIP announced an investment of ~102 lakh crores by FY 2024-25. NIP was launched with 6,835 projects which is now expanded to 7,400 projects. ~217 projects worth Rs. 1.10 lakh crores have been completed. In Budget 2021-22, total capital expenditure outlay for infrastructure has increased from Rs. 4.39 lakh crores to Rs. 5.54 lakh crores.
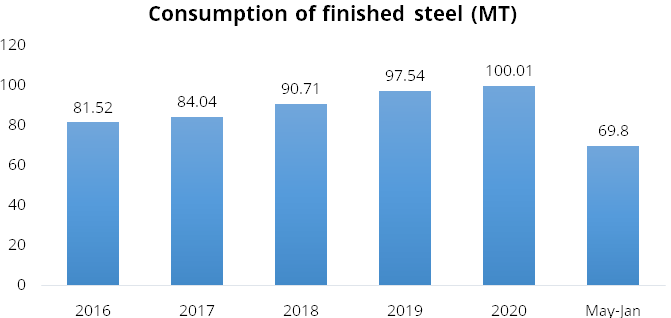
India’s consumption of finished steel has grown at a CAGR of 5.24% between FY16 - FY20 and stood at 100.01 MMT as of FY20. After a decline in consumption in April 2020, due to the covid-19 pandemic, the consumption of the steel has been witnessing a growth every month starting from May 2020 and in the month of Jan-2021, the consumption stood at ~10MT, a growth of ~9% YoY and ~3% MoM. The growth in the month Jan-2021 was despite the strong base in Jan-2020, which has seen a growth of 9% YoY. The growth in demand has been backed by the robust demand from infrastructure and double-digit growth in auto, white goods, and consumer durables.
India’s per capita steel consumption was at 75.1 kgs. in 2019, which has grown from 61.2 kgs. in 2015 (Source: WorldSteel). It is expected that consumption per capita would increase, supported by rapid growth in the industrial sector and rising infra expenditure projects in railways, roads and highways, etc. The National Steel Policy aims to increase per capita steel consumption to 160 kgs by 2030. The government has objective of increasing rural consumption of steel from the current 19.6 kg/per capita to 38 kg/per capita by 2030. It is to be noted that even at 160 kgs. of the consumption, India will be still far from the average global consumption of 190.5 kgs as of 2019.
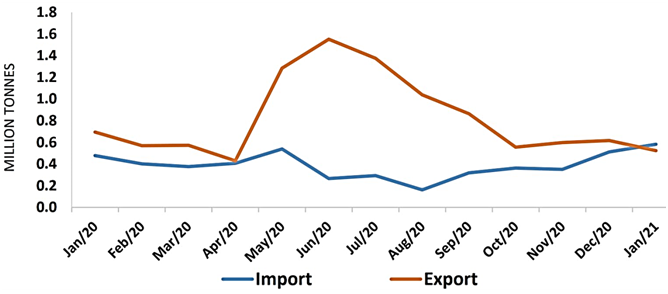
India was net exporter of finished steel during April-January of FY21 with net trade surplus of 5.05 MT. During the current FY21 till January 2021, exports of finished steel from India stood at 8.84MT, a growth of 22.5% while the imports stood at 3.79MT, a de-growth of 36.7% compared to same period last year. India became a net importer of finished steel during January 2021 with a marginal net trade deficit of 0.06 MT. In the recent months, the demand has increased on the back of gradual unlocking of the economy and improving economic activities which has resulted in decline in exports and increase in imports with imports exceeding exports for the first time during the fiscal year in January 2021 (See chart below)
End usage of Steel in India
Construction & Infrastructure
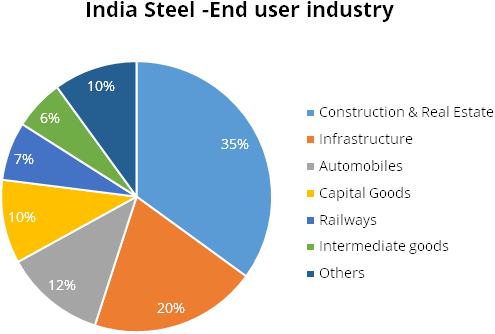
This segment contributes approx. 55% of India’s steel demand and includes
physical infrastructure and real estate. The construction sector contributed to
about ~7.5% of the GDP in FY20. The real estate sector and the affordable housing
and smart cities initiatives will enable strong growth in this sub‐segment. Various
government initiatives will provide impetus to growth in this sector as well as
overall steel demand. A few of the major government initiatives are as follows:
i) Road connectivity through the Bharatmala programme depicts the development of
34,800 kms of roads under the National Highways Development Project ii) Port connectivity
through the Sagarmala programme depicts industrial development covering all major
maritime zones in India iii) Under the Atal Mission for Rejuvenation and Urban Transformation
(AMRUT), basic facilities are being upgraded.
Automobiles
This segment contributes to around 12% of steel demand in India. Steel demand from
the automotive sector is likely to sustain, despite the temporary blip in growth
this year. India’s automobile sector is domestic market‐oriented; whereby
domestic demand constitutes over 80% of sales.
Capital Goods
The sector contributes to about 10% of steel demand. It has several sub‐segments,
of which electrical equipment followed by plant equipment are the largest segments.
A significant gap exists in technology capabilities due to the low acceptance of
domestically manufactured products, leading to a lower capacity utilisation ratio,
weak support infrastructure and inadequate R&D spending.
Steel industry production process
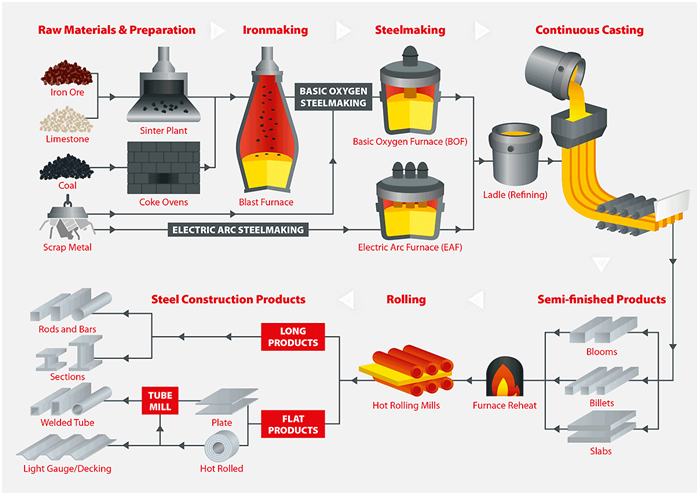
Globally, two distinct processes make up bulk of worldwide steel production: the
blast furnace‐basic oxygen furnace (BOF) route and the induction furnace‐electric
arc furnace (EAF) route. The key difference between the routes is the type of raw
materials they consume. The BOF route predominantly uses iron ore, coking coal and
recycled steel while the EAF route produces steel using mainly recycled steel and
electricity.
Basic Oxygen Furnace (BOF)
In basic oxygen furnace, iron is combined with varying amounts of steel scrap (less
than 30%), after that very pure oxygen is blown into the vessel causing a rise in
temperature to 1700 degree Celsius. The scrap melts, impurities are oxidized and
carbon content is reduced by 90%, resulting in liquid steel. Other processes can
follow secondary steel‐making processes where the properties of steel are determined
by the addition of other elements such as boron, chromium and molybdenum, ensuring
that exact specification can be met.
Currently about 71% of the world’s steel is produced through BOF route remaining ~29% of steel is produced in Electric Arc Furnaces.
Electric Arc Furnaces (EAF)
Electric Arc Furnace or mini-mill, does not involve iron making. It reuses existing
steel (scrap), avoiding the need for raw material and their processing. The furnace
is charged with steel scrap, it can also include some Direct Reduced Iron (DRI)
and pig iron for chemical balance. The electric arc operates with an electric charge
between two electrodes providing heat for the process. This furnace does not require
coke as raw material but depends heavily on the electricity generated by coal-fired
power plant elsewhere in the grid.
Peer comparison
We have compared the company with its listed peers- JSW steel and SAIL. As far as
JSW steel & SAIL is concerned volumes were impacted due to benign demand in
FY20 and lockdown in the wake of the pandemic. However, the output has improved
significantly after H1FY21 and the companies are now operating at near-full capacity
levels. The disruptions due to pandemic impacted the smaller steel producers more
severely, leading to market share consolidation in favour of larger steel players
that could tap the robust export markets in South East Asia and China.
| Particulars | FY16 | FY17 | FY18 | FY19 | FY20 |
|---|---|---|---|---|---|
| Tata Steel | 114716 | 115423 | 132315 | 167302 | 148972 |
| JSW Steel | 60536 | 60536 | 73211 | 84757 | 73326 |
| SAIL | 43294 | 49180 | 58297 | 66267 | 61025 |
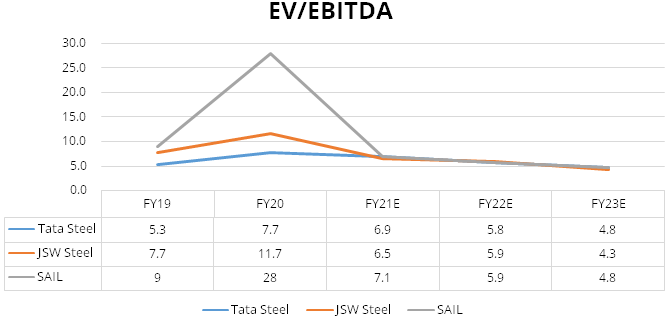
Further in comparison to its peers like JSW steel and SAIL which is trading at EV/EBITDA of 4.3x/4.8x FY23E basis, we believe Tata Steel is fairly valued. Tata Steel has distinct advantage of captive iron ore as well as coking coal thus can demand higher valuation. JSW steel is currently doubling its 5mtpa capacity at Dolvi in the state of Maharashtra and the
company has a robust near-term capacity addition profile in comparison to its peers, which could potentially increase its domestic market share. Thereafter, SAIL aims to double the share of high-value yielding cold rolled coils/sheets to 11% going forward post-expansion from 6% in FY20. The improvement in its product mix will have a positive bearing on its realisations.
Risks & Concerns
Failure to turnaround Tata Steel Europe business:
The company’s European operations are dragging down its consolidated margins
and also the conversion spreads in Europe were at historic lows, thereby it may
have an impact on demand revival.
Higher outgo of premiums due to bidding
Captive chromite mines were a major source of profitability, but many of their leases
expired in FY20 as they were classified under the ‘Merchant’ category.
Although, the company has done aggressive bidding and managed to retain these mines,
it shall have an additional outgo on account of premiums thereby impacting the profitability.
Manoeuvring mining laws may have a negative impact:
The Ministry of Mines is most likely to suggest a change in mining laws to remove
the distinction between captive and non-captive mines and also lower the tenure
period of captive mines from 2030 to 2025. This action may have a negative impact
on a longer term.
Outlook & valuation
We believe the company shall capitalize on growth opportunities supported by i) elevated steel prices ii) deleveraging balance sheet and diversified product segments. Further we expect Tata steel BSL and Tata steel long products to continue deliver improvements in operating business which will translate into better profitability and also Tata steel Europe to turnaround its business performance through transformation program. Further we expect the company to focus on conserving cash and ensuring adequate liquidity to face potential disruptions. At CMP the stock is trading at 4.8x FY23E EV/EBITDA and we initiate our coverage on Tata Steel with a Buy Rating.
Financial Statement
Profit & Loss statement
| Yr End March (Rs Cr) | 2018 | 2019 | 2020 | 2021E | 2022E | 2023E |
|---|---|---|---|---|---|---|
| Net Sales | 132315.00 | 167302.00 | 148972.00 | 151081.00 | 160986.00 | 169234.00 |
| Growth % | 15.00% | 26.00% | -11.00% | 1.00% | 7.00% | 5.00% |
| Expenditure | ||||||
| Material Cost | 52229.00 | 67442.00 | 63607.00 | 64965.00 | 68419.00 | 71586.00 |
| Employee Cost | 17657.00 | 19356.00 | 19152.00 | 19297.00 | 20272.00 | 21061.00 |
| Other Expenses | 40628.00 | 50885.00 | 48412.00 | 41082.00 | 41875.00 | 42397.00 |
| EBITDA | 21801.00 | 29619.00 | 17801.00 | 25737.00 | 30420.00 | 34190.00 |
| Growth % | 66.00% | 36.00% | -40.00% | 45.00% | 18.00% | 12.00% |
| EBITDA Margin | 16.00% | 18.00% | 12.00% | 17.00% | 19.00% | 20.00% |
| Depreciation & Amortization | 5962.00 | 7579.00 | 8708.00 | 8750.00 | 9200.00 | 9500.00 |
| EBIT | 15839.00 | 22040.00 | 9093.00 | 16987.00 | 21220.00 | 24690.00 |
| EBIT Margin % | 12.00% | 13.00% | 6.00% | 11.00% | 13.00% | 15.00% |
| Other Income | 1016.00 | 1423.00 | 1821.00 | 1879.00 | 1982.00 | 2038.00 |
| Interest & Finance Charges | 5502.00 | 7742.00 | 7581.00 | 7348.00 | 5674.00 | 4292.00 |
| Profit Before Tax - Before Exceptional | 11353.00 | 15721.00 | 3333.00 | 11519.00 | 17528.00 | 22436.00 |
| Profit Before Tax | 20952.00 | 15585.00 | -1568.00 | 11519.00 | 17528.00 | 22436.00 |
| Tax Expense | 3405.00 | 6709.00 | -2553.00 | 2899.00 | 4412.00 | 5647.00 |
| Effective Tax rate | 0.00 | 0.00 | -1.00 | 0.00 | 0.00 | 0.00 |
| Exceptional Items | 9599.00 | -136.00 | -4902.00 | 0.00 | 0.00 | 0.00 |
| Net Profit | 17547.00 | 8876.00 | 984.00 | 8619.00 | 13116.00 | 16789.00 |
| Growth % | -520.00% | -49.00% | -89.00% | 776.00% | 52.00% | 28.00% |
| Net Profit Margin | 13.00% | 5.00% | 1.00% | 6.00% | 8.00% | 10.00% |
| Consolidated Net Profit | 13434.00 | 10218.00 | 1557.00 | 8619.00 | 13116.00 | 16789.00 |
| Growth % | -417.00% | -24.00% | -85.00% | 454.00% | 52.00% | 28.00% |
| Net Profit Margin after MI | 10.00% | 6.00% | 1.00% | 6.00% | 8.00% | 10.00% |
Balance Sheet
| Yr End March (Rs Cr) | 2018 | 2019 | 2020 | 2021E | 2022E | 2023E |
|---|---|---|---|---|---|---|
| Share Capital | 3420.00 | 3420.00 | 3420.00 | 3420.00 | 3420.00 | 3420.00 |
| Total Reserves | 57451.00 | 65505.00 | 70156.00 | 78172.00 | 90370.00 | 105983.00 |
| Shareholders' Funds | 61807.00 | 71290.00 | 76163.00 | 84179.00 | 96377.00 | 111990.00 |
| Minority Interest | 937.00 | 2364.00 | 2587.00 | 2587.00 | 2587.00 | 2587.00 |
| Non Current Liabilities | ||||||
| Long Term Burrowing | 72789.00 | 80343.00 | 94105.00 | 87144.00 | 77144.00 | 67144.00 |
| Deferred Tax Assets / Liabilities | 9534.00 | 11651.00 | 7991.00 | 7991.00 | 7991.00 | 7991.00 |
| Long Term Provisions | 6855.00 | 6700.00 | 7833.00 | 7833.00 | 7833.00 | 7833.00 |
| Current Liabilities | ||||||
| Short Term Borrowings | 15885.00 | 10802.00 | 19184.00 | 19184.00 | 19184.00 | 19184.00 |
| Trade Payables | 20414.00 | 21717.00 | 21381.00 | 24662.00 | 26504.00 | 28951.00 |
| Other Current Liabilities | 17199.00 | 26509.00 | 18681.00 | 15642.00 | 15642.00 | 15642.00 |
| Short Term Provisions | 2163.00 | 2006.00 | 2415.00 | 2415.00 | 2415.00 | 2415.00 |
| Total Equity & Liabilities | 208722.00 | 232773.00 | 249149.00 | 250446.00 | 254487.00 | 262547.00 |
| Assets | ||||||
| Net Block | 96105.00 | 124442.00 | 134551.00 | 131883.00 | 142683.00 | 150183.00 |
| Non Current Investments | 2991.00 | 3213.00 | 2853.00 | 2853.00 | 2853.00 | 2853.00 |
| Long Term Loans & Advances | 23856.00 | 25114.00 | 32895.00 | 32895.00 | 32895.00 | 32895.00 |
| Current Assets | ||||||
| Currents Investments | 14909.00 | 2525.00 | 3432.00 | 3432.00 | 3432.00 | 3432.00 |
| Inventories | 28331.00 | 31656.00 | 31069.00 | 28772.00 | 29924.00 | 31665.00 |
| Sundry Debtors | 12416.00 | 11811.00 | 7885.00 | 10687.00 | 11542.00 | 12214.00 |
| Cash and Bank | 7938.00 | 3341.00 | 8055.00 | 11192.00 | 2425.00 | 572.00 |
| Short Term Loans and Advances | 3092.00 | 3702.00 | 2778.00 | 2778.00 | 2778.00 | 2778.00 |
| Total Assets | 208722.00 | 232773.00 | 249149.00 | 250446.00 | 254487.00 | 262547.00 |
Cash Flow Statement
| Yr End March (Rs Cr) | 2018 | 2019 | 2020 | 2021E | 2022E | 2023E |
|---|---|---|---|---|---|---|
| Profit After Tax | 17547.00 | 8876.00 | 984.00 | 8619.00 | 13116.00 | 16789.00 |
| Depreciation | 5962.00 | 7579.00 | 8708.00 | 8750.00 | 9200.00 | 9500.00 |
| Others | -6759.00 | 4008.00 | 19.00 | 0.00 | 0.00 | 0.00 |
| Changes in Working Capital | -9276.00 | 2591.00 | 4196.00 | 2776.00 | -165.00 | 34.00 |
| Cash From Operating Activities | 8023.00 | 25336.00 | 20169.00 | 20145.00 | 22151.00 | 26323.00 |
| Purchase of Fixed Assets | -7479.00 | -9091.00 | -10398.00 | -6082.00 | -20000.00 | -17000.00 |
| Free Cash Flows | 545.00 | 16245.00 | 9771.00 | 14063.00 | 2151.00 | 9323.00 |
| Others | -4726.00 | -20587.00 | -4518.00 | 0.00 | 0.00 | 0.00 |
| Cash Flow from Investing Activities | -12026.00 | -29211.00 | -14530.00 | -6082.00 | -20000.00 | -17000.00 |
| Increase / (Decrease) in Loan Funds | 4225.00 | 8267.00 | 8636.00 | -10000.00 | -10000.00 | -10000.00 |
| Equity Dividend Paid | -982.00 | -1186.00 | -1507.00 | -603.00 | -918.00 | -1175.00 |
| Others | 3595.00 | -7516.00 | -8516.00 | 0.00 | 0.00 | 0.00 |
| Cash from Financing Activities | 6640.00 | -673.00 | -1695.00 | -10603.00 | -10918.00 | -11175.00 |
| Net Cash Inflow / Outflow | 2638.00 | -4548.00 | 3944.00 | 3460.00 | -8767.00 | -1852.00 |
| Opening Cash & Cash Equivalents | 4850.00 | 7784.00 | 3270.00 | 7732.00 | 11192.00 | 2425.00 |
| Closing Cash & Cash Equivalent | 7784.00 | 3270.00 | 7732.00 | 11192.00 | 2425.00 | 572.00 |
Key Ratios
| Yr End March | 2018 | 2019 | 2020 | 2021E | 2022E | 2023E |
|---|---|---|---|---|---|---|
| Basic EPS | 113.00 | 86.00 | 13.00 | 76.00 | 116.00 | 149.00 |
| Diluted EPS | 113.00 | 86.00 | 13.00 | 76.00 | 116.00 | 149.00 |
| Cash EPS (Rs) | 163.00 | 150.00 | 87.00 | 154.00 | 197.00 | 233.00 |
| DPS | 10.00 | 13.00 | 10.00 | 5.00 | 8.00 | 10.00 |
| Book value (Rs/share) | 518.00 | 601.00 | 646.00 | 745.00 | 853.00 | 991.00 |
| ROCE (%) Post Tax | 9.00% | 9.00% | 11.00% | 7.00% | 9.00% | 10.00% |
| ROE (%) | 22.00% | 14.00% | 2.00% | 10.00% | 14.00% | 16.00% |
| Inventory Days | 73.00 | 65.00 | 77.00 | 72.00 | 67.00 | 66.00 |
| Receivable Days | 33.00 | 26.00 | 24.00 | 22.00 | 25.00 | 26.00 |
| Payable Days | 54.00 | 46.00 | 53.00 | 56.00 | 58.00 | 60.00 |
| PE | 4.90 | 5.80 | 19.80 | 9.50 | 6.20 | 4.90 |
| P/BV | 1.10 | 0.90 | 0.40 | 1.00 | 0.90 | 0.70 |
| EV/EBITDA | 6.30 | 5.30 | 7.70 | 6.90 | 5.80 | 4.80 |
| Dividend Yield (%) | 0.00 | 0.00 | 0.00 | 0.00 | 0.00 | 0.00 |
| P/Sales | 0.50 | 0.40 | 0.20 | 0.50 | 0.50 | 0.50 |
| Net debt/Equity | 1.10 | 1.30 | 1.40 | 1.10 | 1.00 | 0.70 |
| Net Debt/ EBITDA | 3.20 | 3.20 | 5.90 | 3.70 | 3.10 | 2.40 |
| Sales/Net FA (x) | 1.40 | 1.50 | 1.20 | 1.10 | 1.20 | 1.20 |