
Tata Power Company Ltd
Power Generation / Distribution
Tata Power Company Ltd
Power Generation / Distribution
Stock Info
Shareholding Pattern
Price performance
Indexed Stock Performance

Tata power is on the cusp on mega transformation.
Tata Power (TPWR) is India’s largest integrated power utility with a diversified portfolio spanning across:
1) regulated electricity distribution and franchisee; 2) transmission (regulated); 3) generation - coal-based generation and hydro conventional generation (mix of regulated - 26% and unregulated - 74%); 4) stakes in coal mines in Indonesia; 5) renewable energy generation; and 6) solar EPC business.
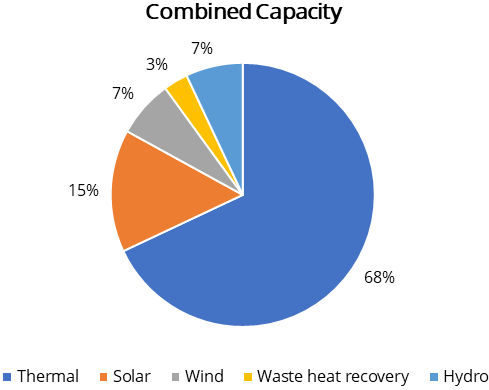
It is India’s largest private independent power producer with a combined capacity of 13,071MW (thermal – 68%, solar – 15%, wind – 7%, waste heat recovery – 3%, and hydro – 7%).
The company’s regulated distribution, transmission and generation business is among the most efficient in the country, which delivers steady growth and assured returns. Its presence across different segments of the sector provides a strong platform to mitigate the risk of slowdown in any one segment and helps in leveraging new opportunities in other segments.
With growing thrust across the renewable segment and slowdown in the thermal segment, the company has changed its gear by aggressively venturing into renewable energy generation and EPC.
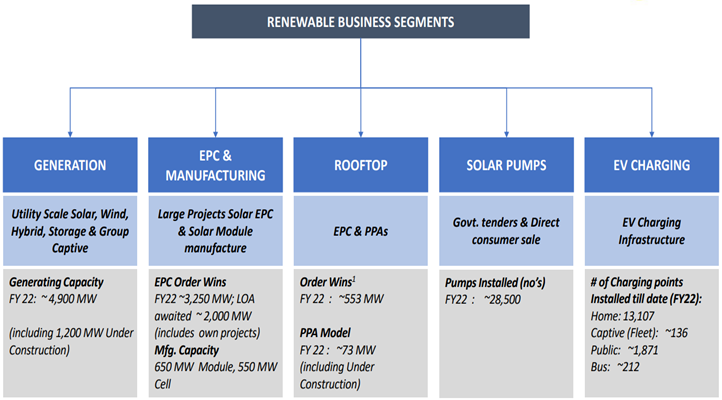
Tata Power distribution has a customer base of 12.4m and is present in Delhi, Mumbai, Ajmer, and Odisha. Its transmission assets include 1,211 ckm in the Mumbai business and 2,328 ckm in the Powerlinks JV. It is engaged in various other businesses such as solar EPC, solar cells & modules manufacturing, rooftop solar, solar pumps, operation and maintenance services, among others. TPWR has strategic holdings in Indonesian coal assets where it has a 30% stake in PT KPC. Its international presence includes generation assets in Zambia, Georgia and Bhutan.
Investment Rationale
Renewables can be a next growth driver:
TPWR's renewable operations include wind and solar assets spread across three
separate entities: Tata Power Renewable Energy Ltd (TPREL), Walwhan Renewable Energy
Ltd (WREL), and Tata Power Solar Systems Ltd. (Tata Power Solar).
As of Dec’21, TPWR had renewable energy generation capacity of 4.2GW, which includes solar capacity of 2GW, wind of 932MW, hydro of 880MW and waste heat recovery/bio-fuel (WHR/BFG) of 375MW. The company plans to increase this to 15GW by FY25 and 25GW by FY30. The large part of capacity addition will be from solar and hybrid (solar + wind + storage).
Government’s push towards 24x7 power for all, should provide the impetus to electricity demand growth in the country. While coal is expected to remain a significant fuel source in the country, its growth would diminish in the coming years.
Declining costs of renewables have provided the impetus for rapid increase in renewable- based capacities. The government is aiming to achieve 225 GW of renewable energy capacity (including 114 GW of solar capacity addition and 67 GW of wind power capacity) by 2022 and 500 GW by 2030 with an intent to increase the RE capacity in alignment reduce carbon emission.
| Subsidiaries | FY18 | FY19 | FY20 | FY21 |
|---|---|---|---|---|
| TPREL | ||||
| Capacity (MW) | 624 | 824 | 1,136 | 1,146 |
| Operating Income (INR cr) | 487 | 717 | 917 | 960 |
| EBITDA (INR cr) | 433 | 719 | 821 | 849 |
| Adj. PAT (INR cr) | 191 | 93 | -47 | 21 |
| WREL | ||||
| Capacity (MW) | 1,008 | 1,008 | 1,010 | 1,010 |
| Operating Income (INR cr) | 1,197 | 1,272 | 1,198 | 1,189 |
| EBITDA (INR cr) | 1,094 | 1,175 | 1,092 | 1,093 |
| PAT (INR cr) | 238 | 300 | 292 | 320 |
| Tata power standalone (renewable assets) | ||||
| Capacity (MW) | 376 | 380 | 379 | 379 |
| Operating Income (INR cr) | 271 | 264 | 284 | 229 |
| EBITDA (INR cr) | 225 | 204 | 225 | 141 |
| PAT (INR cr) | 45 | 16 | 37 | 8 |
| Solar PV Manufacturing - TPSCL | ||||
| Operating Income (INR cr) | 2,752 | 3,175 | 2,141 | 5,119 |
| EBITDA (INR cr) | 235 | 235 | 214 | 330 |
| PAT (INR cr) | 99 | 90 | 123 | 208 |
Source: Company, Annual Report
Steady order book in EPC:
In the EPC business, the company targets an aggressive revenue of Rs 12,000 Cr by
FY25 from Rs 1,450 Cr in FY20, and it is targeting overall execution of 4.0GW pa
with a 20% market share. Company is also targeting revenue of INR 10,000 cr by FY25
(INR 680 cr in FY20) from the rooftop solar as well as the solar pumps markets,
with a 33% market share in rooftop solar and 16% in solar pumps. Thus, Tata Power
is targeting an aggressive overall revenue build-up of Rs 22,000 Cr from EPC, EV
charging system and rooftop solar business.
We believe Tata Power being a major player in EPC solar space has a huge untapped opportunity to capitalise from industry as well as group companies in EV charging and home solar space.
TPWR is the largest company in the solar EPC segment. The company has secured EPC orders worth Rs 5980 Cr in the past four quarters. Anticipating the demand pick-up, taking advantage of the government’s PLI scheme and imposition of customs duty on imported solar modules, the company plans to add solar cell and module capacity of 4GW each with a capex of Rs 3400 Cr. Management expects that over the next 3 years, solar capacity of 15-20GW will come up for bidding, of which it expects to secure at least 20% market share.
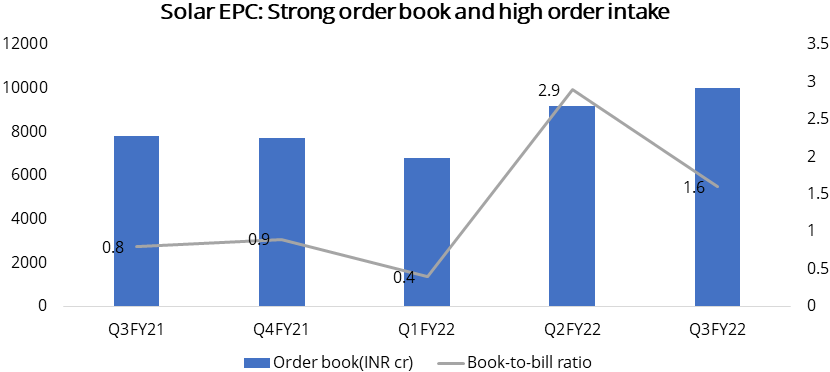
TPSSL targets to increase its utility-scale solar EPC market share
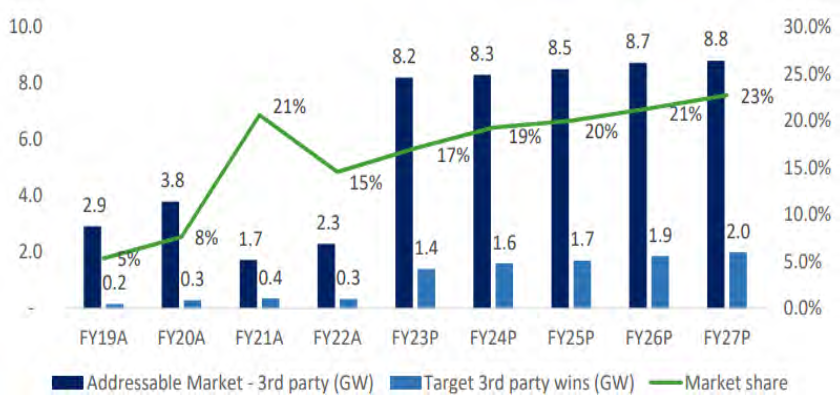
Source: Company
Regulated power distribution business to provide stability and predictability
As of December 21, TPWR's total regulated equity was Rs10400 cr. The major contributors
are the Mumbai operations (Rs 4240 cr), the Delhi operations (Rs 1770 cr), and the
Maithon Power Plant (INR16.5 billion). These projects earn a fixed 15.5-17% RoE
plus incentives ranging from 3-4% based on operational and financial efficiencies.
The company has set a capex plan of Rs 20,000 cr across all three regulated business segments - generation, distribution, and transmission - for FY21-25E, with a D/E ratio of 70:30. Of this, Rs 13500 cr would be invested in existing assets, while the remaining Rs 6,500 cr would be used to acquire new distribution licences put up for sale by state electricity distribution companies (discoms). With the goal of expanding its distribution reach, Tata Power acquired a 51% stake in Central Electricity State Utility of Odisha in December 2019 and then acquired the remaining three discoms in the state of Odisha. The company now has 12.3 million customers spread across seven discoms in Mumbai, Delhi, Odisha, and Ajmer.
TPWR has been successful in narrowing the AT&C losses materially in its existing discoms: Delhi from 53.1% at the time of takeover in 2002 to 5.7% in 3QFY22 and Ajmer from 22% in 2017 to 8.7% in 3QFY22.
In transmission, TPWR’s presence is in three ways: Mumbai transmission lines under the standalone entity, 74% stake in Powerlinks a joint venture with Powergrid Corporation and 26% stake in Resurgent Power Ventures Pte. The balance 74% of Resurgent Power is held by ICICI Bank and other investors such as Power Platform Limited and Kuwait Investment Authority.
Details of Odisha discoms at the time of acquisition
| Particulars | CESU | WESCO | SOUTHCO | NESCO |
|---|---|---|---|---|
| Area (sq km) | 29,354 | 48,000 | 47,000 | 27,920 |
| No of customers (m) | 2.69 | 1.96 | 2.28 | 1.91 |
| Input energy (Mus) | 8,160 | 7,523 | 3,469 | 5,439 |
| Sales (Mus) | 6,271 | 6,114 | 2,620 | 4,579 |
| EHT & HT consumers (as % of annual Sales MUs) | 37% | 57% | 29% | 56% |
| Annual revenue billed in FY20 (INRm) | 35,990 | 33,100 | 12,790 | 24,690 |
| Power Purchase Cost (INR p.u.) | 2.86 | 3.29 | 2.11 | 3.23 |
| Initial regulated equity (INRm) | 3,000 | 3,000 | 2,000 | 2,500 |
| Price payable for 51% stake (INRm) | 1,785 | 2,550 | 1,275 | 1,913 |
| Minimum capex in first five years (INRm) | 15,410 | 16,630 | 11,660 | 12,700 |
| Date of start of operations | 01-Jun-20 | 01-Jan-21 | 01-Jan-21 | 01-Apr-21 |
| FY20 AT&C losses | 30.4% | 28.6% | 36.3% | 25.3% |
| 1st year target | 23.7% | 20.4% | 25.8% | 19.2% |
| 2nd year target | 23.7% | 20.4% | 25.8% | 19.2% |
| 3rd year target | 23.7% | 18.9% | 25.8% | 17.1% |
| 4th year target | 22.0% | 17.4% | 25.4% | 15.0% |
| 5th year target | 20.0% | 15.9% | 25.0% | 13.8% |
| 6th year target | 18.0% | 14.5% | 22.6% | 12.8% |
| 7th year target | 16.0% | 13.0% | 20.4% | 11.8% |
| 8th year target | 15.0% | 11.5% | 18.4% | 10.9% |
| 9th year target | 14.0% | 10.0% | 16.6% | 10.0% |
| 10th year target | 13.5% | 9.5% | 15.0% | 9.5% |
Source: Company Presentation
Resolution and merger of Mundra power plant to reduce risk
Mundra ultra-power megaproject (UMPP), which includes five units of 800MW each,
totaling 4GW of thermal capacity, has been hindered by dispute since its commissioning.
The primary reason is cost escalation caused by regulatory changes in coal benchmark
price. Tariff under-recoveries have been observed by the company. Gujarat and Maharashtra
account for 65% of the capacity, with Rajasthan, Punjab, and Haryana accounting
for the remaining 35%. The company is actively negotiating with states to pass on
the increase in coal prices. The recent increase in coal prices has resulted in
limited availability of coal, so the company has only operated 1-3 units depending
on coal availability.
We believe that the negotiations will make some progress, allowing operations to resume and losses to be reduced.
The company owns a 26-30% stake in Indonesian mining assets with a capacity of 60MT. The mines serve as its suppliers. The coal assets provide a natural hedge for the Mundra plant.
Furthermore, TPWR has filed with the National Company Law Board for the merger of Coastal Gujarat Power Limited (CGPL), the company that houses this power plant, into a standalone entity. As of March 21, CGPL had Rs 11600 cr in losses on its books. The merger of Mundra (CGPL) with company will result in a tax break of approximately Rs 2500 cr.
New business avenues to drive future growth:
EV charging system: In the EV charging space, the company is rapidly
scaling up and has already installed 2200+ public EV charging points in 352 cities.
Tata Power has partnered with Tata Motors, MG Motors and several others to set EV
charging ecosystem across the country. Recently, the company has received orders
from Tata Motors for development of EV Charging ecosystem for deployment of 300
e-Buses in Mumbai.
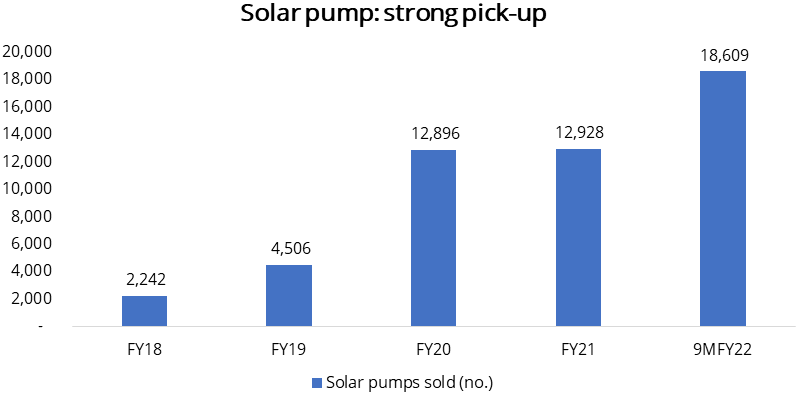
Solar pumps: Tata Power is a market leader in solar pumps with a 9% market share and has installed a total of 30,000 pumps across India until FY21. The company targets to increase its market share to 16% on a 1.14 mn annual installation in the industry by FY25. Indian solar pumps market is expected to grow from Rs 3000 Cr to Rs 32,000 Cr by FY25 (CAGR: 60.5%).
Rooftop solar: Tata Power’s solar rooftop business continued strong performances with 4x/3x growth during Q3FY22 with the highest-ever order book of Rs 1180 Cr in the solar rooftop business.
The Company has installed Rooftop solar capacity of 500 MW till date. The company envisage a market size of 1,166 MW and market share of 33% by FY25 as the cost of equipment and installation goes down and becomes more affordable.
Government initiative to drive solar pumps business:
Tata Power is one of the leading companies in the solar pump segment. Under the
PM Kusum Yojana, the government has set a target of installing 20 Lakh standalone
solar pumps and solarizing 15 Lakh existing grid-connected pumps. The central and
state governments both will fund 30% (each) of the cost, and the farmer can obtain
bank loans for the remaining 30%. The second phase of the scheme empanelment process
began in December'21, and company is working with 14 states to secure empanelled
status and begin accepting orders.
Disinvestments in non-core business is on track
Over the past three years, company’s strategy has been to focus on its core
business operations. This has led to monetisation of non-core assets helping prune
debt & freed up management bandwidth for developing the core portfolio. To this
effect, the company had classified several investments as ‘held for sale’.
Currently, it has INR 2,900 Cr of assets (net of liabilities) classified as held for sale, which it intends to offload in the near future.
Value unlocking in renewables
TPWR is looking at value unlocking in the renewables business. The company has carved
out the business and is exploring the possibilities of fund raising at the subsidiary
level. Earlier, the company was looking at an InvIT structure but later dropped
the idea. There are two US-listed India-based renewable power companies: Azure Power
Global initially listed in 2016 with a follow on offering in 2018 and Renew Power
which listed on the Nasdaq through the SPAC route. AZRE has an operational capacity
of 2.7GW and RNW of 7.4GW (10.2GW including projects under development).
Additionally, the company has 47.78% stake in Tata Projects with a book value of Rs 690 cr, which it plans to monetise as and when the company goes for an IPO. Additionally, it has hydropower capacity in Georgia (400MW) and Zambia (120MW), which it may plan to monetise.
Expansion in cells and modules:
Tata Power’s transition into the green segment is gaining strong momentum,
and the company now plans to incur a Capex of Rs 3400 Cr over the next 18 months
to enhance its cell and module manufacturing capacity by 4GW each. The company has
also participated in the PLI Scheme floated by the government to boost domestic
solar manufacturing and, thus, expects an incentive of Rs 1500 Cr against this Capex.
It is also strengthening its EV charging segment by signing MoUs with TVS Motors
and Apollo Tyres to deploy charging stations.
Q3FY22 Result Highlights:
In Q3FY22, consolidated revenue increased by 43.6% YoY to Rs. 10,913cr (+11.2% QoQ),
due to expanded operations in Odisha DISCOMS, higher project execution by TPSSL
and strong performance of other businesses. TPSSL won a total of 320 MW of Utility
Scale EPC orders. This includes India’s largest solar and battery power storage
project of 100 MW. The operating income for TPSSL was Rs. 1,562 cr in Q3FY22, a
YoY increase of 69%, mainly attributed to higher revenue from EPC and rooftop business.
The company is committed to focus on key growth areas i.e., renewables, distribution
and new businesses comprising rooftop solar, EV charging and solar pumps.
Financials
Financial performance
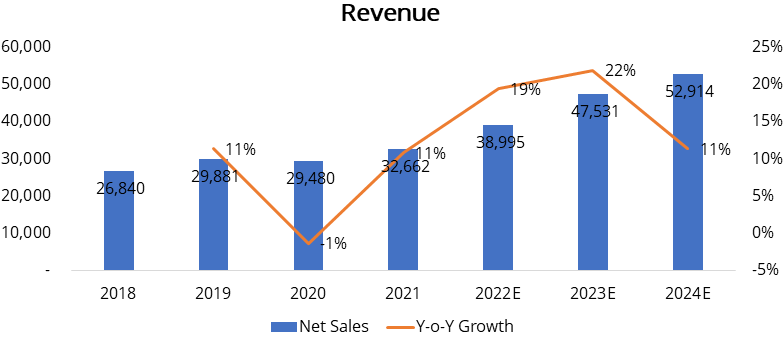
We forecast Tata power revenue to grow by CAGR 17.4% for FY21-24, driven by 30-40%
increase RE business revenue and steady improvement in regulated business.
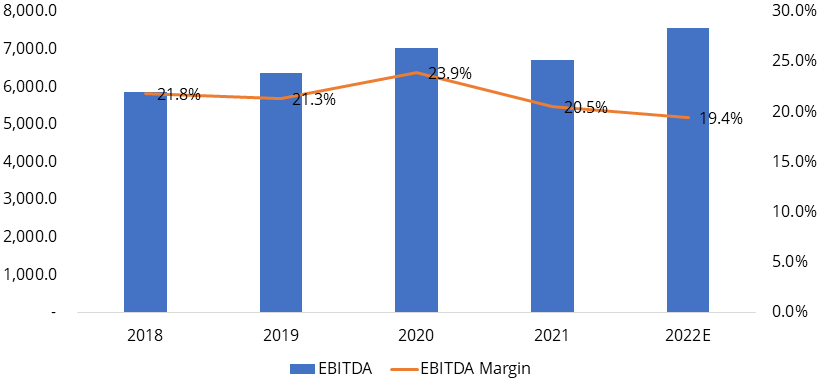
Over the last 3 years Company’s EBITDA has grown at a CAGR of 4% and for FY22-FY24E estimating a CAGR growth of 18.3% driven by increase in Renewable generation business and higher growth in Solar EPC.
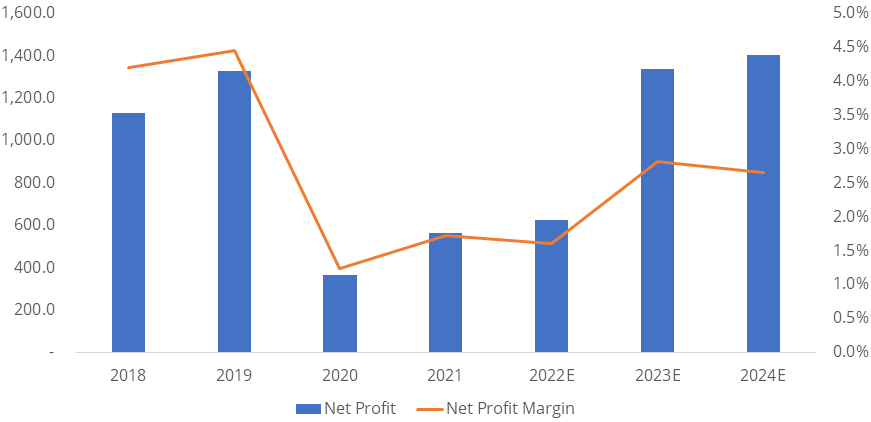
Over the last 3 years Company’s Net profit has degrown by 20.6% and for FY22-FY24E estimating a CAGR growth of 49.5%
Industry
Peer Comparison
| Particulars | CMP | MCAP | Revenue CAGR (FY16 - FY21) | PAT CAGR (FY16 - FY21) | EBITDAM (FY21) | ROE | ROCE | P/E | EV/EBITDA |
|---|---|---|---|---|---|---|---|---|---|
| (FY21) | (FY21) | (FY21) | (FY21) | ||||||
| Tata Power | 221.00 | 70745.00 | 4.00% | 1.00% | 20.50% | 4.50% | 4.90% | 40.60 | 10.70 |
| Torrent Power | 440.00 | 21123.00 | 7.00% | 18.00% | 29.00% | 9.00% | 13.00% | 23.70 | 7.82 |
| Adani Power | 314.00 | 121225.00 | 4.00% | 34.00% | 33.00% | 56.00% | 18.00% | 24.70 | 12.20 |
| NTPC | 154.00 | 149523.00 | 10.00% | 9.00% | 31.00% | 13.00% | 9.00% | 8.96 | 7.89 |
| JSW Energy | 278.00 | 45630.00 | -6.70% | 23.00% | 42.00% | 11.00% | 12.00% | 26.90 | 13.00 |
Risks & Concerns
- Near-term profitability in solar EPC business may get impacted by increase in landed solar module prices
- Slower-than-expected ramp-up of renewable energy portfolio and expansion in distribution business.
- Continued losses at Mundra UMPP in case of high imported coal prices.
Outlook & valuation
Tata power is the India’s largest company engaged in power generation. We expect the major driver for the stock to be the Solar EPC and Renewable business. The company has entered into many new business ventures like EV charging stations, microgrids and home solar automation which in our view has huge potential for growth going forward but difficult to currently estimate fully. On a successful turnout of these factors, we expect company’s profitability to improve. Apart from this shift towards higher RoE business, reducing debt by asset monetizing and fresh fund infusion by promoter will strengthen the balance sheet. Hence, we initiate a “Buy” on Tata power company limited.
At CMP of Rs 227 the stock trades at EV/EBITDA of 11.4x for FY24E.
Financial Statement
Profit & Loss statement
| Year End March (Rs. in Crores) | 2019 | 2020 | 2021 | 2022E | 2023E | 2024E |
|---|---|---|---|---|---|---|
| Net Sales | 29881.10 | 29480.10 | 32661.70 | 38995.00 | 47530.60 | 52914.30 |
| Expenditure | ||||||
| Material Cost | 19536.70 | 17654.40 | 20710.70 | 24566.90 | 29944.30 | 33336.00 |
| Employee Cost | 1339.10 | 1530.70 | 2209.10 | 2105.70 | 2376.50 | 2381.10 |
| Other Expenses | 2632.90 | 3254.00 | 3032.60 | 4757.40 | 5798.70 | 6455.50 |
| EBITDA | 6372.40 | 7041.10 | 6709.20 | 7565.00 | 9411.10 | 10741.60 |
| EBITDA Margin | 21.30% | 23.90% | 20.50% | 19.40% | 19.80% | 20.30% |
| Depreciation & Amortization | 2393.10 | 2633.60 | 2744.90 | 3096.00 | 3363.00 | 3563.00 |
| EBIT | 3979.30 | 4407.50 | 3964.30 | 4469.00 | 6048.10 | 7178.60 |
| EBIT Margin % | 13.30% | 15.00% | 12.10% | 11.50% | 12.70% | 13.60% |
| Other Income | 862.10 | 870.00 | 1073.80 | 1169.90 | 1425.90 | 1587.40 |
| Interest & Finance Charges | 4170.00 | 4530.80 | 4035.30 | 4347.20 | 4388.60 | 4124.60 |
| Profit Before Tax - Before Exceptional | 671.40 | 746.80 | 1002.80 | 1291.70 | 3085.30 | 4641.40 |
| Profit Before Tax | 2417.30 | 973.00 | 893.50 | 1091.70 | 3085.30 | 4641.40 |
| Tax Expense | 1087.60 | 609.10 | 328.20 | 464.00 | 1157.00 | 1670.90 |
| Effective Tax rate | 45.00% | 62.60% | 36.70% | 35.90% | 37.50% | 36.00% |
| Exceptional Items | 1745.80 | 226.20 | -109.30 | -200.00 | - | - |
| Consolidated Net Profit | 2482.00 | 1017.40 | 1127.40 | 132.70 | 1433.30 | 2475.50 |
| Net Profit Margin after MI | 8.30% | 3.50% | 3.50% | 0.30% | 3.00% | 4.70% |
Balance Sheet
| As of March (Rs. in Crores) | 2019 | 2020 | 2021 | 2022E | 2023E | 2024E |
|---|---|---|---|---|---|---|
| Share Capital | 270.50 | 270.50 | 319.60 | 319.60 | 319.60 | 319.60 |
| Total Reserves | 16535.00 | 17795.50 | 20502.70 | 20468.60 | 21569.60 | 23505.90 |
| Shareholders' Funds | 20472.20 | 21898.10 | 25249.60 | 22288.10 | 23389.20 | 25325.50 |
| Minority Interest | 2166.70 | 2332.00 | 2927.30 | - | - | - |
| Non Current Liabilities | ||||||
| Long Term Burrowing | 31139.20 | 32695.10 | 30045.00 | 43934.70 | 38934.70 | 37934.70 |
| Deferred Tax Assets / Liabilities | 967.30 | 1099.80 | 792.10 | 792.10 | 792.10 | 792.10 |
| Long Term Provisions | 337.30 | 410.40 | 842.60 | 842.60 | 842.60 | 842.60 |
| Current Liabilities | ||||||
| Short Term Borrowings | 13875.40 | 11844.40 | 8436.20 | 8436.20 | 8436.20 | 8436.20 |
| Trade Payables | 5481.50 | 5095.40 | 7120.10 | 6674.90 | 8297.00 | 9906.90 |
| Other Current Liabilities | 8972.90 | 10398.30 | 14944.30 | 10254.70 | 10254.70 | 10254.70 |
| Short Term Provisions | 243.80 | 245.90 | 468.50 | 468.50 | 468.50 | 468.50 |
| Total Equity & Liabilities | 84073.40 | 89673.90 | 98667.20 | 104460.60 | 102183.70 | 104730.00 |
| Assets | ||||||
| Net Block | 44304.90 | 47666.40 | 51889.30 | 56102.30 | 57239.30 | 58176.30 |
| Non Current Investments | 13374.90 | 13835.30 | 12649.50 | 12649.50 | 12649.50 | 12649.50 |
| Long Term Loans & Advances | 1313.70 | 948.00 | 1621.70 | 1621.70 | 1621.70 | 1621.70 |
| Current Assets | ||||||
| Currents Investments | 167.00 | 699.50 | 499.50 | 499.50 | 499.50 | 499.50 |
| Inventories | 1706.40 | 1752.40 | 1884.80 | 2355.80 | 2963.20 | 3577.50 |
| Sundry Debtors | 4445.30 | 4425.90 | 5001.00 | 5300.60 | 6637.60 | 7980.60 |
| Cash and Bank | 787.50 | 2094.20 | 6112.70 | 6922.30 | 1564.10 | 1245.50 |
| Short Term Loans and Advances | 1512.90 | 1549.80 | 2455.10 | 2455.10 | 2455.10 | 2455.10 |
| Total Assets | 84073.40 | 89673.90 | 98667.20 | 104460.60 | 102183.70 | 104729.90 |
Cash Flow Statement
| Year End March (Rs. in Crores) | 2019 | 2020 | 2021 | 2022E | 2023E | 2024E |
|---|---|---|---|---|---|---|
| Profit After Tax | 1329.70 | 363.90 | 565.30 | 627.70 | 1928.30 | 2970.50 |
| Depreciation | 2393.10 | 2633.60 | 2744.90 | 3096.00 | 3363.00 | 3563.00 |
| Changes in Working Capital | -1815.00 | 674.30 | 1254.40 | -1713.40 | -322.20 | -317.90 |
| Cash From Operating Activities | 4573.80 | 7375.30 | 8458.00 | 2010.30 | 4969.10 | 6215.60 |
| Purchase of Fixed Assets | -3576.20 | -2225.80 | -3335.80 | -7309.00 | -4500.00 | -4500.00 |
| Free Cash Flows | 997.60 | 5149.50 | 5122.20 | -5298.70 | 469.10 | 1715.60 |
| Cash Flow from Investing Activities | -319.20 | -542.90 | 667.60 | -7309.00 | -4500.00 | -4500.00 |
| Increase / (Decrease) in Loan Funds | -641.60 | -107.00 | -5973.40 | 9200.00 | -5000.00 | -1000.00 |
| Equity Dividend Paid | -410.40 | -500.60 | -526.30 | -548.80 | -686.00 | -857.50 |
| Cash from Financing Activities | -5184.50 | -5109.60 | -7602.90 | 8538.10 | -5827.30 | -2034.20 |
| Net Cash Inflow / Outflow | -929.90 | 1722.80 | 1522.70 | 3239.50 | -5358.20 | -318.60 |
| Opening Cash & Cash Equivalents | 944.50 | 61.50 | 1834.40 | 3682.90 | 6922.30 | 1564.10 |
| Closing Cash & Cash Equivalent | 61.50 | 1834.40 | 3682.90 | 6922.30 | 1564.10 | 1245.50 |
Key Ratios
| Year End March | 2019 | 2020 | 2021 | 2022E | 2023E | 2024E |
|---|---|---|---|---|---|---|
| Basic EPS | 8.30 | 3.50 | 3.30 | 0.40 | 4.20 | 8.70 |
| Diluted EPS | 8.30 | 3.50 | 3.30 | 0.40 | 4.20 | 8.70 |
| Cash EPS (Rs) | 16.20 | 12.40 | 11.30 | 9.40 | 14.00 | 17.60 |
| DPS | 1.30 | 1.60 | 1.60 | 1.60 | 2.00 | 2.50 |
| Book value (Rs/share) | 68.10 | 74.60 | 73.60 | 65.00 | 68.20 | 73.80 |
| ROCE (%) Post Tax | 4.30% | 3.00% | 4.90% | 5.20% | 6.40% | 7.90% |
| ROE (%) | 12.10% | 4.60% | 4.50% | 0.60% | 6.10% | 9.80% |
| Inventory Days | 20.30 | 21.40 | 20.30 | 24.00 | 25.00 | 26.00 |
| Receivable Days | 44.20 | 54.90 | 52.70 | 54.00 | 56.00 | 58.00 |
| Payable Days | 67.70 | 65.50 | 68.30 | 68.00 | 70.00 | 72.00 |
| PE | 8.50 | 8.70 | 29.30 | 124.60 | 40.50 | 26.30 |
| P/BV | 1.10 | 0.40 | 1.40 | 3.50 | 3.30 | 3.10 |
| EV/EBITDA | 10.90 | 7.80 | 10.70 | 16.30 | 13.20 | 11.40 |
| Dividend Yield (%) | 1.80% | 4.70% | 1.50% | 0.70% | 0.90% | 1.10% |
| P/Sales | 0.70 | 0.30 | 1.10 | 2.00 | 1.60 | 1.50 |
| Net debt/Equity | 2.30 | 2.10 | 1.40 | 2.00 | 2.00 | 1.80 |
| Net Debt/ EBITDA | 7.50 | 6.50 | 5.40 | 6.00 | 4.90 | 4.20 |
| Sales/Net FA (x) | 0.70 | 0.60 | 0.70 | 0.70 | 0.80 | 0.90 |