
Tata Elxsi Ltd
IT - Software Services
Tata Elxsi Ltd
IT - Software Services
Stock Info
Shareholding Pattern
Price performance
Indexed Stock Performance

Diversified business model, outsourcing of design services by Global OEMs and new avenues of growth from IoT space makes it a perfect candidate for re-rating.
The company was incorporated in 1989 as Tata Elxsi Limited. Tata Elxsi Ltd (TELX) is amongst the world’s leading providers of design and technology services for product engineering and solutions across industries including Broadcast, Communications and Automotive sectors. The company provides product design and engineering services and systems integration and support services in India, the US, Europe, and Rest of the World. The company also provides solutions and services for emerging technologies such as Internet of Things (IoT), big data analytics, cloud, mobility, virtual reality and artificial intelligence and brings together domain experience across infotainment, autonomous driving, telematics, powertrain, and body electronics. The company addresses the automotive, broadcast and communications, consumer electronics and healthcare industries supported by its worldwide network of design studios, development centres, and offices. The company also works with leading OEMs and suppliers in the automotive and transportation industries for R&D, design and product engineering services from architecture to launch and beyond.
Tata Elxsi is uniquely placed with its integrated design, technology & engineering teams to help enterprises reimaging their products & services, deliver exceptional outcomes for their customers, and drive the growth of their brands and business. In terms of business mix, the automotive sector contributed 50% to revenue in FY20, followed by Broadcasting and Media (30-35% of total revenue) and other sectors (5-10% of total revenue). TELX reports its financials under two segments, namely, Software Development and Services (SDS) and Systems Integration and Support (SI).
Tata Elxsi addresses the complete product development lifecycle from R&D, new product development and testing to maintenance engineering for Broadcast, Consumer Electronics, and Communications. Tata Elxsi works with leading broadcasters & operators to create solutions for smarter living, engaged entertainment and a digital future driven by IoT, analytics and artificial intelligence thereby enabling new revenue streams and enhanced customer experience.
Source: Company, Stockaxis Research
Investment Rationale:
Revival in Automotive sector to boost revenues in the near term:
The Automotive sector contributes around 51% of the company’s total revenue.
In the Automotive sector, its top client JLR comprises around 14.5% of the company’s
total revenues. In a recent statement from JLR, the management indicated that despite
the slowdown, JLR is not looking to reduce its R&D budget, which is positive
for TELX. We believe that the auto sector can revive at a faster pace in the near
term. The Automotive sector is undergoing a sea change with a shift to driverless
cars, electric cars, etc., which bodes well for TELX.
New collaborations and ventures to offer new opportunities:
Tata Elxsi has successfully collaborated with top auto sector players to develop
sector-specific products and tools for OEMs (original equipment manufacturers) and
automotive suppliers. TELX has collaborated with Hyundai Mobis to develop tools
for accelerate testing of autonomous cars. It recently announced the licensing of
the AUTOSAR adaptive platform to Great Wall Motors, China’s largest SUV manufacturer.
TELX has also partnered with Android and Blackberry for IP solutions with the help
of this partnership; now TELX is one-stop shop for automotive solutions. Tata Elxsi’s
in-house concept demonstrator vehicle has been developed using AEye’s iDAR™
platform and Tata Elxsi’s autonomous stack.
Media & Communication is the new avenue for healthy growth:
Tata Elxsi has made significant in-roads in the Media & Communication sector,
which offers the company an attractive growth opportunity. The company develops
the technology platform for FTH & DTH and OTT service providers in order to
improve the viewing experience for their customers. The company has tie-ups with
different players such as OEMs (Original Equipment Manufacturers), Digital Content
Providers (DCPs), Software Vendors for addressing their needs to digitally connect
consumers using DTH, IPTVs (Internet Protocol TVs), and OTA (Over-the-Air) technology.
5G - the new era for growth:
IHS has forecasted that the 5G market will grow to $19.3 bn by 2022 from $758.8
mn in 2018, at a CAGR of 124.6%. The market for 5G phones is likely to be quite
small initially since large players like Samsung, Oneplus, Huawei and LG have recently
launched their flagship phones with 5G technology. IHS projected a total of 720,336
global subscribers in 2019, but rising rapidly to 37.4 mn in 2020 and is further
expected to grow to 1.3 bn by 2023. 5G will be the connective tissue for the Internet
of Things (IoT), autonomous vehicles, and mobile media.
Robust growth potential in healthcare business:
Typically, healthcare business contracts are long-term businesses with 1-3 year
contracts having healthy total contract value (TCV). Currently, the US and Europe
are driving robust growth in the healthcare segment. Margins too are better in this
segment as compared to transportation and media & communication verticals. Though
the healthcare business vertical is small in size currently, it offers tremendous
opportunities going forward.
Outlook & Valuation:
Tata Elxsi provides design and technology services for product engineering and solutions
across industries including Broadcast, Communications and Automotive. Tata Elxsi
has developed good presence in the Media & Communication space. FTH and 5G have
opened up new opportunities for service providers like Tata Elxsi. We also expect
a revival in the auto sector which will lead to higher growth for Tata Elxsi going
forward. Global OEMs will continue outsourcing design services supported by higher
ER&D investments, which is also a positive development for the company. Tata
Elxsi has also entered into different verticals and now has a diversified business
model. The company is net debt-free with a cash surplus of Rs. 7 billion. We re-initiate
a “Buy” on the stock. At CMP of Rs. 1760, the stock trades at PE multiples
of 30x/26x of our FY22E/ FY23E EPS estimates. We apply a PE multiple of 38.6x to
the FY23E EPS to arrive at a TP of Rs 2550 per share.
Consolidated Financial Statements
| (In Rs Cr) | Sales | EBITDA | EBITDA % | PAT | EPS | ROE % | EV/EBITDA | PE |
|---|---|---|---|---|---|---|---|---|
| FY18 | 1386.00 | 359.00 | 25.90% | 254.00 | 39.00 | 39.20% | 16.00 | 25.60 |
| FY19 | 1597.00 | 433.00 | 27.10% | 307.00 | 47.00 | 36.50% | 12.70 | 20.70 |
| FY20 | 1610.00 | 354.00 | 22.00% | 272.00 | 41.00 | 26.70% | 8.70 | 14.40 |
| FY21E | 1706.00 | 421.00 | 24.70% | 306.00 | 49.00 | 26.20% | 23.60 | 35.00 |
| FY22E | 1877.00 | 479.00 | 25.50% | 355.00 | 57.00 | 26.40% | 20.50 | 30.30 |
| FY 23E | 2159.00 | 550.00 | 25.50% | 403.00 | 65.00 | 26.20% | 17.50 | 26.60 |
Investment Rationale
Story in Charts
Exhibit No 1: Revenue by Segments (As on FY 20)
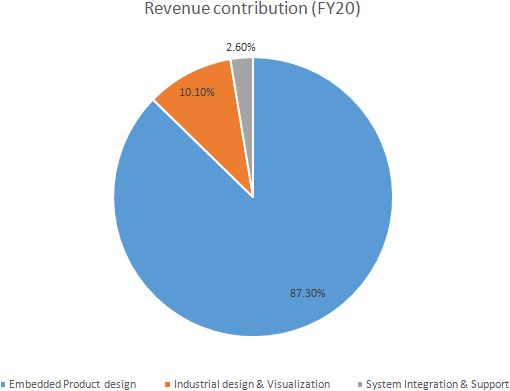
Exhibit No 2: Revenue by Verticals (In%)
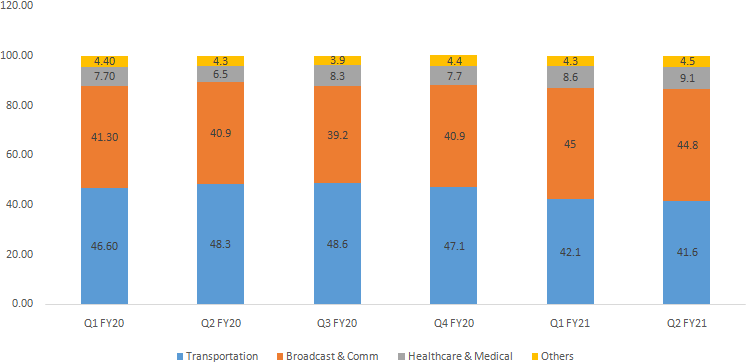
Exhibit No 3: Revenue by Geography (In %)
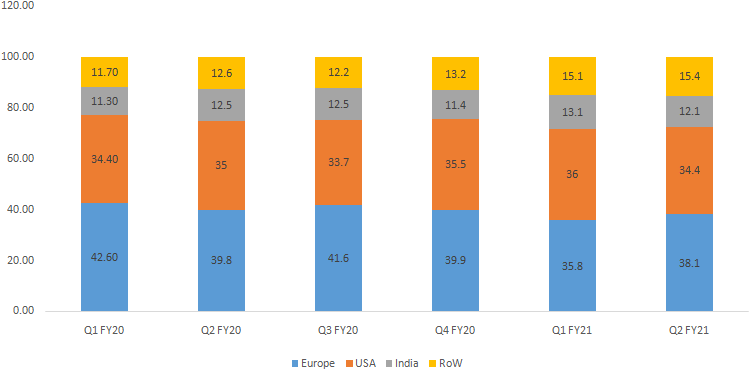
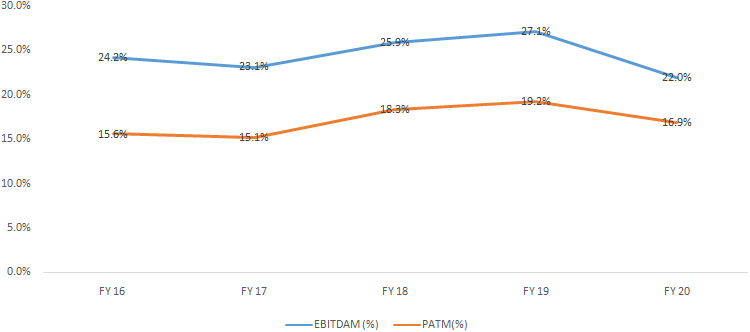
Exhibit No4: Profitability margins
Investment Rationale:
Revival in the automotive sector to boost revenues in the near term:
The Automotive sector contributes around 51% of the company’s total revenue.
In the Automotive sector, its top client JLR comprises around 14.5% of the company’s
total revenues. In a recent statement from JLR, the management indicated that despite
the slowdown, JLR is not looking to reduce its R&D budget, which is positive
for TELX. We believe that the auto sector can revive at a faster pace in the near
term. The Automotive sector is undergoing a sea change with a shift to driverless
cars, electric cars, etc., which bodes well for TELX. According to Bloomberg report,
in 2018, over 2 million Electric vehicles (EV) were sold, which is a 10-fold over
the previous decade. The company expects the number of EVs to rise by 10 million
annually till 2025. This offers a huge untapped opportunity for Tata Elxsi as the
company offers services to electric vehicle manufacturers in program management,
engine management software, battery management etc.
New collaborations and ventures to offer new opportunities:
Tata Elxsi
has successfully collaborated with top auto sector players to develop sector-specific
products and tools for OEMs (original equipment manufacturers) and automotive suppliers.
TELX has collaborated with Hyundai Mobis to develop tools for accelerate testing
of autonomous cars. It recently announced the licensing of the AUTOSAR adaptive
platform to Great Wall Motors, China’s largest SUV manufacturer. TELX
has also partnered with Android and Blackberry for IP solutions with the help of
this partnership, now TELX is one-stop shop for automotive solutions. Tata Elxsi’s
in-house concept demonstrator vehicle has been developed using AEye’s iDAR™
platform and Tata Elxsi’s autonomous stack. iDAR is the first fully software-definable
smart sensor that supports dynamic ROI and cueing of sensors, improving the reliability
of detection and classification, while extending the range at which objects can
be detected, classified and tracked to enhance safe, reliable vehicle autonomy.
The fully autonomous vehicle, fitted with AEye’s iDAR encounters various scenarios
such as cross-traffic detection at a junction and round-about, follow the road ahead,
and cueing the sensor with HD maps and V2X information. Tata Elxsi’s RoboTaxi,
built on top of its software middleware platform Autonomai, with deep learning and
AI capabilities has been used to conceptualize the RoboTaxi feature. The feature
allows the user to travel in a RoboTaxi from their current location to the user’s
selected destination with the press of a button on the screen. Tata Elxsi is responsible
for iDAR integration into the vehicle, interfacing with the AD stack, simulation,
vehicle testing and demonstration for AEye.
Exhibit No 5: Robo taxi

Media & Communication is the new avenue for healthy growth:
Tata
Elxsi has made significant in-roads in the Media & Communication sector, which
offers the company an attractive growth opportunity. The company develops the technology
platform for FTH & DTH and OTT service providers in order to improve the viewing
experience for their customers. The company has tie-ups with different players such
as OEMs (Original Equipment Manufacturers), Digital Content Providers (DCPs), Software
Vendors for addressing their needs to digitally connect consumers using DTH, IPTVs
(Internet Protocol TVs), and OTA (Over-the-Air) technology. With the penetration
of high-speed internet, smart devices and content flooding the market, the borders
between entertainment, media, and telecommunications have dissolved. New services
such as smart, connected homes and OTT are creating new revenue opportunities for
operators and broadcasters. TELX works with leading broadcasters and operators to
create solutions for smarter living, engaged entertainment and a digital future
driven by IoT, analytics and artificial intelligence thereby enabling new revenue
streams and enhanced customer experience.
5G - the new era for growth:
IHS a research entity has forecasted that
the 5G market will grow to $19.3 bn by 2022 from $758.8 mn in 2018, at a CAGR of
124.6%. The market for 5G phones is likely to be quite small initially since large
players like Samsung, Oneplus, Huawei and LG have recently launched their flagship
phones with 5G technology. IHS projected a total of 720,336 global subscribers in
2019, but rising rapidly to 37.4 mn in 2020 and is further expected to grow to 1.3
bn by 2023. However, the market for 5G is much larger than the traditional handsets,
and the artificial intelligence (AI) is the major beneficiary. Further, the worldwide
installed base of connected Internet of Things (IoT) devices is expected to exceed 31
billion devices by the end of 2020. This IoT device base is expected to unlock
a variety of new services and applications, such as smart cities, connected homes
and connected cars. As consumer appetite for this new technology and service grows,
5G capabilities will continue to proliferate. 5G will be the connective tissue
for the Internet of Things (IoT), autonomous vehicles, and mobile media.
The driving force behind this development are technologies like Software Defined Networking technologies (SDN) and Network Function Virtualization (NFV), which are now recognized as being two of the key technology enablers for realizing 5G networks, and which have introduced a major change in the way network services are deployed and operated.
In FY19, Tata Elxsi collaborated with Airtel as a technology partner to develop and integrate key software components for its Internet TV by upgrading OTA module, improving UI (User Interface), and optimizing software for its smooth execution. Tata Elxsi has a comprehensive portfolio of software development network (SDN) based services that enable global customers to deliver business service agility in their next generation networking technology solutions. The company’s focus to meet consumer needs by delivering good technology solutions enables Tata Elxsi to be a core service provider.
Robust growth potential in healthcare business:
Typically, healthcare
business contracts are long-term businesses with 1-3 year contracts having healthy
TCVs. Currently, the US and Europe are driving robust growth in the healthcare segment.
Margins too are better in this segment as compared to transportation and media &
communication verticals. Though the healthcare business vertical is small in size
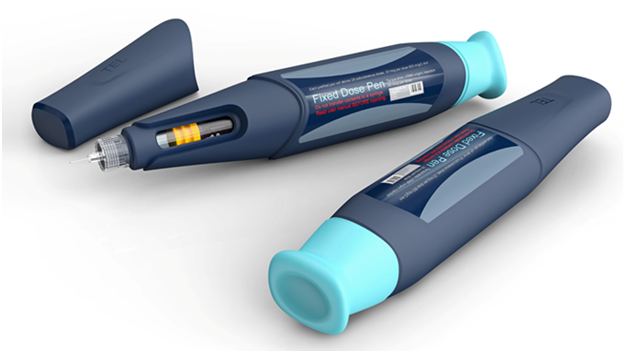
currently, it offers tremendous opportunities going forward. The Medical Device
Regulation (MDR) is driving the healthcare business in the Euro-zone. The management
expects the overall revenue contribution from the healthcare space to grow to 20-25%
in the next three years. Tata Elxsi's Medical Device and Healthcare practice
segment has worked with leading medical device OEMs and technology companies for
market research and human factor engineering, hardware and software engineering,
verification and validation, regulatory standards and compliance requirements along
with technologies such as artificial intelligence, cloud and IoT.
Exhibit No 6: Fixed dosage pen
Financials
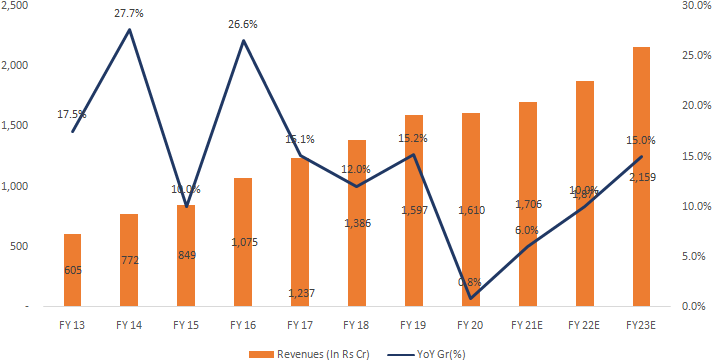
Revenue is expected to grow @~8% CAGR over FY20-FY23E
We expect TELX’s revenues to grow at 8% CAGR over FY20-FY23E to Rs. 2159 crores
by FY23E on the back of new client additions in new geographies. The company has
grown its revenues by 5% CAGR during FY18-FY20. We expect revenues to remain soft
for FY21 and project it to grow by 6% yoy to Rs. 1706 crores, mainly due to impact
of Covid-19 induced disruption and re-allocation in R&D spends of its key customers.
We believe there would be revival in FY22E led by pent-up demand across verticals
to some extent.
Exhibit no 7: Revenue trends (In Rs Cr)
Source: Ace equity, StockAxis Research
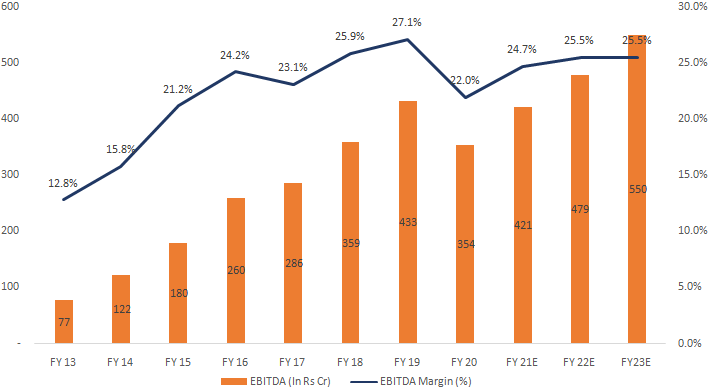
EBITDA margins are expected to expand by ~350 bps over FY20-FY23E
We expect EBITDA to grow at CAGR of ~12% over FY20-FY23E, and EBITDA margins to
expand by ~350 bps over FY20-FY23E due to improvement in utilization rates and operational
efficiencies. Strong sales, high operating leverage and proper offshore-onsite mix
will aid margin expansion in future. We expect EBITDA margins to expand by ~270
bps yoy to 24.7% in FY21E.
Exhibit No 8: EBITDA and EBITDA margin trend (In Rs Cr)
Source: Ace equity, StockAxis Research
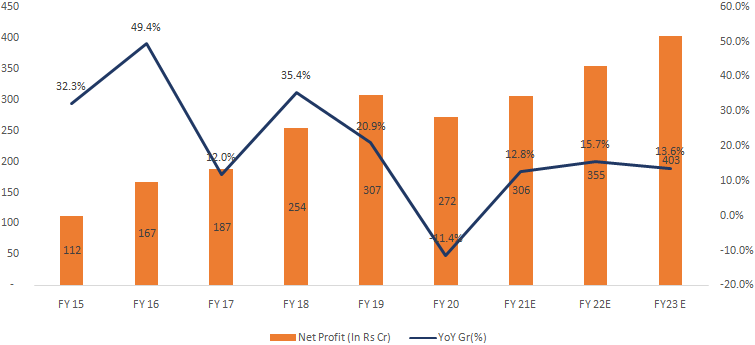
Net profit is expected to grow at ~10% CAGR
We expect net profit to grow @ ~10% CAGR over FY20-23E on the back of high operational
efficiency and lower tax rates. The company grew its net profit by 2% CAGR during
FY18-FY20. In the last 3 years (FY18-20), the company was not able to grow its profits
majorly due to deferment of deals and reduction in R&D spend of its key customer
(JLR). We see tapering of other operating costs (primarily travelling expenses)
and better utilization rates will aid margin expansion. As we have expected Other
Income to remain constant for FY22E & FY23E, the clear benefit of EBITDA margin
expansion is not visible in profits.
Exhibit No 9: Net profit trend (In Rs Cr)
Source: Ace equity, StockAxis Research
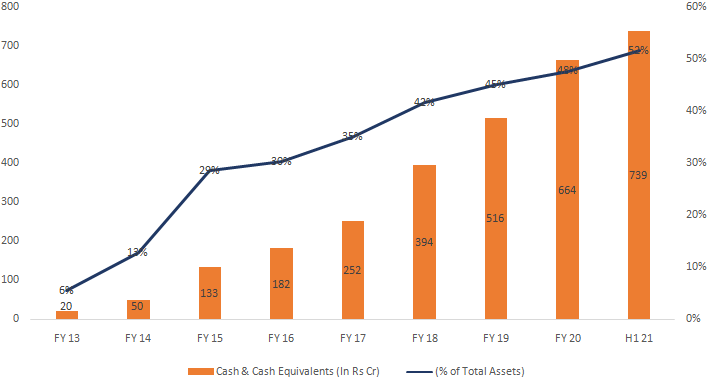
Improving cash generation
Despite headwinds in the past, the company has been able to maintain cash rich status.
Despite de-growth in profits, TELX has improved its cash generation. High cash generation
strengthens the balance sheet and clearly indicates operational efficiency. We believe
the company will utilize the cash surplus for in-organic growth opportunities.
Exhibit No 10: Cash & Cash equivalents
Industry
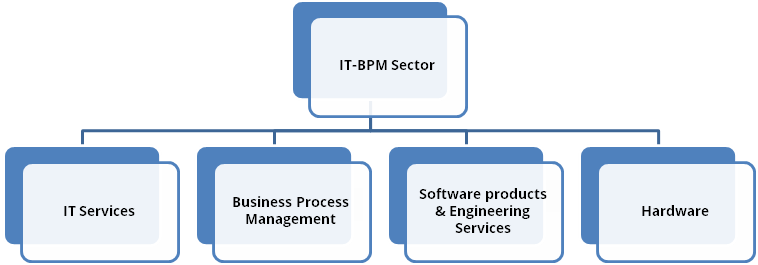
According to NASSCOM, India’s IT-BPM industry (excl. e-commerce) is expected to grow by 6.1% in FY19 to $ 177 billion. As per current trends, the new age technologies such as robotics, Internet of Things (IoT) and VR/AR are driving large part of the growth. India’s IT & ITeS industry grew to US$ 181 billion in 2018-19. Exports from the industry increased to US$ 137 billion in FY19 while domestic revenues (including hardware) advanced to US$ 44 billion.
According to Gartner study, despite of uncertainties’ and the Covid 19 pandemic, the IT industry is expected to grow by 6% in 2021. Spending is expected on the new age technologies such as Cloud computing and Internet of Things (IoT) devices.
The Indian IT/ITeS industry contributed around 7.7% to the country’s GDP and is expected to contribute 10% to India’s GDP by 2025. The industry is a global powerhouse today, and its impact on India has been incomparable. It has contributed immensely in positioning the country as a preferred investment destination amongst global investors and creating huge job opportunities in India, as well as in the USA, Europe and other parts of the world. Revenue from digital segment is expected to comprise 38 per cent of the forecasted US$ 350 billion industry revenue by 2025.
Exhibit No 11: IT industry structure
India, having proven its capabilities in delivering both on-shore and off-shore services to global clients, emerging technologies now offer an entire new gamut of opportunities. The country's cost competitiveness, which is ~3-4 times cheaper than the US, continues to be its USP in the global sourcing market. The industry offers cost-effectiveness, great quality, high reliability, speedy deliveries and, above all, the use of state-of-the-art technologies globally.
Exhibit No 12: Market size of IT industry
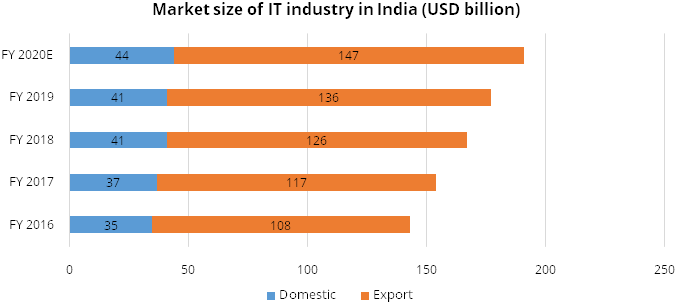
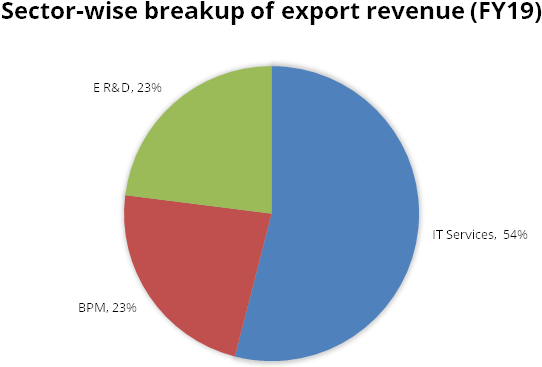
The export sector crossed USD 147 billion in revenue in FY 2020, growing at 8.1%. E R&D market is expected to grow to USD 42 billion by 2022 from USD 28 billion currently.
Exhibit No 13: Revenue segmentation
Disruptive technologies such as cloud computing, social media and data analytics are offering new avenues of growth across verticals for IT companies. Large players in the Industry with a wide range of capabilities are gaining ground as they move from being simple maintenance providers to full-service players, offering infrastructure, system integration and consulting services.
Growth in Automotive Vertical:
The automobile industry has witnessed several incredible technological advances
over the last century. Right from the arrival of engines that used fossil fuels
to power transportation, the impact of technology in shaping the automobiles over
the course has been enormous. Some of the greatest minds in the tech industry have
joined forces with automotive companies in order to improve the way vehicles operate.
AI and machine learning play an important role in the future of the automotive industry as predictive capabilities are becoming more prevalent in cars. Manufacturers are applying algorithms that use data to automate the process of setting up a vehicle, including infotainment system and its application preferences. Vehicles are becoming IoT devices which can connect to smartphones and take voice commands, changing the user interface. The rise of self-driving vehicles and the potential of CaaS as a mobility service will save consumers greatly, while also increasing their safety.
The future of the automotive world is moving towards electric, digital and shared solutions and how R&D teams are preparing for these multiple and simultaneous disruptions. Energy transformation, asymmetric competition, safety, autonomous vehicles, material science, connectivity software and digital are six significant trends that are going to impact the R&D function. The emergence of hybrid and electric vehicles, connected and autonomous cars, digital technologies as well as increasingly stringent emission and safety regulations are also driving global R&D activity and vehicle manufacturers are looking to stay ahead of the curve by investing in new technologies and coming up with innovations.
As per the recent data from Statista, total global R&D spending on automotive in 2019 is USD 103.1 billion vs. USD 99.8 billion in 2018. ER&D outsourcing continues to be underpenetrated with large growth opportunities across industries supported by businesses moving to platforms, data monetization.
R&D spend has increased from 4.7% to 5.4% of revenue over CY 2014-2018. As the targeted R&D% for leading auto OEMs are near the current levels, R&D growth is expected to converge with overall revenue growth. Leading auto ancillary continental expects software function in vehicles to increase by 10x as the use of Electric vehicle is expected to increase. The dominant trends of Autonomous, Connected, Electric, and Shared Mobility (ACES) in the automotive market, are enabled by the advancement of technology in electronics and software. TELX is investing in strengthening capabilities in the development of Electric vehicles, including control software development, battery management systems, and validation.It plans to increase its software professionals substantially. Auto majors require faster time to market for their products which supports the growth opportunity for service providers.
Growth in Media & Broadcasting Industry:
Media broadcasting industry finds application in areas such as Broadcaster, Studios
and Creators, Distributors, OTT, IPTV, among others. With the penetration of high-speed
internet, smart devices and content flooding in the market, the borders between
entertainment, media, and telecommunications have dissolved. New services such as
smart, connected homes & OTT are creating new revenue opportunities for operators
and broadcasters.
Excellent user experience and content are becoming the key drivers to customer engagement and loyalty. The increased use of machine learning and contextual information will help in delivering content recommendations and personalized video experience. The media and telecom service providers are coming together to take-on pure-play OTT service providers. With the industry undergoing consolidation, tapping into synergies will help to reduce expenditure on re-engineering effort needed to create optimized networks.
Exhibit No 14: OTT Service Framework
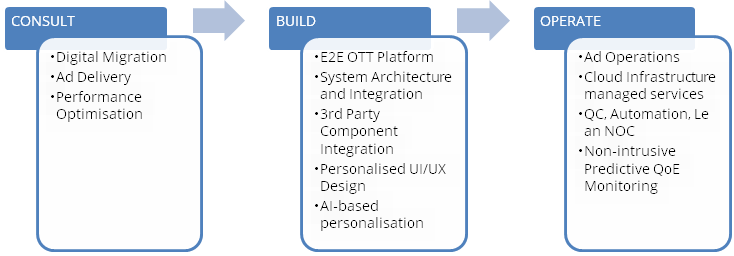
With advancements in the communication sector, the world has become more linked. As broadcasting companies aim to provide customers with seamless communication experience, the industry is likely to experience major developments in the coming years. As per the recent report by experctmarketresearch (EMR), the global broadcast and media (solutions and services) technology market size will grow by USD 116 billion during the forecast period of 2020 – 2025, growing at a CAGR of 42%. Further, the rollout of 5G wireless technology by telecommunication companies is expected to bring at least USD 10 billion global business to Indian IT firms by 2019–25.
Growth in Healthcare vertical:
Miniaturization and integration of technologies are two of the leading innovation
themes in the industry. Companies are increasingly focusing on launching holistic
solutions with medical devices, which can be seamlessly integrated into the consumer’s
workflow to enhance user experience and improve operational efficiency. While regulatory
bodies have become more receptive to innovations, they still require comprehensive
risk management to ensure critical aspects such as patient safety, data security,
device reliability, etc. to be thoroughly addressed.
Healthcare industry is also witnessing a new wave of AI-fuelled technology innovation, primarily due to the advancements in computing infrastructure and deep learning architectures, delivering reliable performance comparable to human experts. The advancements in AI technologies have led the industry to explore AI for improving their internal processes, as well as adding value to their customer-facing products. This has resulted in an increase in the development of AI-based Software as a Medical Device (SaMD).
As per the recent report by The Business Research Company, the global medical devices market reached a value of nearly USD 456.9 billion in 2019. The market is expected to decline to USD 442.5 billion in 2020 mainly due to lockdowns imposed by the governments across the world. However, the market is expected to recover and grow at a CAGR of 6.1% from 2021 and reach USD 603.5 billion in 2023.
Exhibit No 15: Market Size of other progressing verticals by 2020 (USD billion)

Source: Company, IBEF, Gartner
Risks & Concerns
- Slowdown in the global economy especially in the automotive industry might affect growth momentum.
- Currency risks; Tata Elxsi’s overseas revenue is mainly distributed across Euro, British Pound and US dollar currencies. Any geopolitical issues between countries can affect the revenues of the company.
- Deferment of deals and slower addition of clients may impact the business in the near term.
Outlook & valuation
Tata Elxsi provides design and technology services for product engineering and solutions across industries including Broadcast, Communications and Automotive. Tata Elxsi has developed good presence in the Media & Communication space. FTH and 5G have opened up new opportunities for service providers like Tata Elxsi. We also expect a revival in the auto sector which will lead to higher growth for Tata Elxsi going forward. Global OEMs will continue outsourcing design services supported by higher ER&D investments, which is also a positive development for the company. Tata Elxsi has also entered into different verticals and now has a diversified business model. The company is net debt-free with a cash surplus of Rs. 7 billion. We re-initiate a “Buy” on the stock. At CMP of Rs. 1760, the stock trades at PE multiples of 30x/26x of our FY22E/ FY23E EPS estimates. We apply a PE multiple of 38.6x to the FY23E EPS to arrive at a TP of Rs 2550 per share.
Financial Statement
Profit & Loss statement
| Year End March(In Rs Cr) | 2018 | 2019 | 2020 | 2021E | 2022E | 2023E |
|---|---|---|---|---|---|---|
| Net Sales | 1386.00 | 1597.00 | 1610.00 | 1706.00 | 1877.00 | 2159.00 |
| Expenditure | 1027.00 | 1164.00 | 1256.00 | 1285.00 | 1398.00 | 1608.00 |
| Employee Cost | 749.00 | 843.00 | 951.00 | 973.00 | 1061.00 | 1220.00 |
| Other Expenses | 279.00 | 321.00 | 305.00 | 312.00 | 338.00 | 389.00 |
| EBITDA | 359.00 | 433.00 | 354.00 | 421.00 | 479.00 | 550.00 |
| EBITDA Margin | 25.90% | 27.10% | 22.00% | 24.70% | 25.50% | 25.50% |
| Depreciation & Amortization | 25.00 | 25.00 | 43.00 | 50.00 | 43.00 | 50.00 |
| EBIT | 334.00 | 408.00 | 310.00 | 372.00 | 436.00 | 500.00 |
| Other Income | 45.00 | 43.00 | 65.00 | 45.00 | 45.00 | 45.00 |
| Interest Expense | 1.00 | 1.00 | 7.00 | 7.00 | 7.00 | 7.00 |
| Share of Associates | - | - | - | - | - | - |
| Profit Before Tax - Before Exceptional | 378.00 | 450.00 | 368.00 | 410.00 | 474.00 | 538.00 |
| Exceptional Items | - | - | - | - | 1.00 | 2.00 |
| Profit Before Tax | 378.00 | 450.00 | 368.00 | 410.00 | 474.00 | 538.00 |
| Tax Expense | 124.00 | 143.00 | 96.00 | 103.00 | 119.00 | 136.00 |
| Net Profit | 254.00 | 307.00 | 272.00 | 306.00 | 355.00 | 403.00 |
| Net Profit Margin | 18.30% | 19.20% | 16.90% | 18.00% | 18.90% | 18.70% |
| Adjusted EPS | 39.00 | 47.00 | 41.00 | 49.20 | 56.90 | 64.70 |
Balance Sheet
| Year End March (In Rs Cr) | 2018 | 2019 | 2020 | 2021E | 2022E | 2023E |
|---|---|---|---|---|---|---|
| Share Capital | 62.00 | 62.00 | 62.00 | 62.00 | 62.00 | 62.00 |
| Total Reserves | 676.00 | 880.00 | 1028.00 | 1186.00 | 1399.00 | 1641.00 |
| Share Warrants & Outstandings | - | - | - | - | 1.00 | 2.00 |
| Shareholders' Funds | 738.00 | 943.00 | 1090.00 | 1249.00 | 1461.00 | 1703.00 |
| Total Non-current Liabilities | 15.00 | 6.00 | 73.00 | 73.00 | 73.00 | 73.00 |
| Deferred Tax Assets / Liabilities | -4.00 | -6.00 | -9.00 | -9.00 | -9.00 | -9.00 |
| Long Term Borrowing | - | - | 45.00 | 45.00 | 45.00 | 45.00 |
| Long Term Provisions | 19.00 | 12.00 | 37.00 | 37.00 | 37.00 | 37.00 |
| Total Current Liabilities | 188.00 | 188.00 | 217.00 | 225.00 | 229.00 | 237.00 |
| Trade Payables | 45.00 | 55.00 | 47.00 | 55.00 | 59.00 | 66.00 |
| Other Current Liabilities | 116.00 | 107.00 | 123.00 | 123.00 | 123.00 | 123.00 |
| Short Term Borrowings | - | - | 13.00 | 13.00 | 13.00 | 13.00 |
| Short Term Provisions | 27.00 | 26.00 | 34.00 | 34.00 | 34.00 | 34.00 |
| Total Equity & Liabilities | 941.00 | 1137.00 | 1380.00 | 1546.00 | 1763.00 | 2013.00 |
| ASSETS | ||||||
| Total Non-Current Assets | 136.00 | 129.00 | 179.00 | 184.00 | 196.00 | 201.00 |
| Net Block | 94.00 | 101.00 | 147.00 | 152.00 | 164.00 | 169.00 |
| Capital Work in Progress | 2.00 | 0.00 | 1.00 | 1.00 | 1.00 | 1.00 |
| Long Term Loans & Advances | 37.00 | 25.00 | 29.00 | 29.00 | 29.00 | 29.00 |
| Other Non Current Assets | 2.00 | 3.00 | 2.00 | 2.00 | 2.00 | 2.00 |
| Total Current Assets | 805.00 | 1008.00 | 1201.00 | 1362.00 | 1567.00 | 1812.00 |
| Sundry Debtors | 307.00 | 357.00 | 392.00 | 373.00 | 403.00 | 453.00 |
| Cash and Bank | 394.00 | 516.00 | 664.00 | 847.00 | 1022.00 | 1216.00 |
| Other Current Assets | 96.00 | 117.00 | 129.00 | 129.00 | 129.00 | 129.00 |
| Short Term Loans and Advances | 8.00 | 17.00 | 14.00 | 14.00 | 14.00 | 14.00 |
| Total Assets | 941.00 | 1137.00 | 1380.00 | 1546.00 | 1763.00 | 2013.00 |
Cash Flow Statement
| Year End March (In Rs Cr) | 2018 | 2019 | 2020 | 2021E | 2022E | 2023E |
|---|---|---|---|---|---|---|
| Profit After Tax | 254.00 | 307.00 | 272.00 | 306.00 | 355.00 | 403.00 |
| Depreciation | 25.00 | 25.00 | 43.00 | 50.00 | 43.00 | 50.00 |
| Operating Cash Flow before Working Capital Changes | 279.00 | 332.00 | 315.00 | 356.00 | 398.00 | 453.00 |
| Working Capital Changes | ||||||
| Trade & Other receivables | -62.00 | -50.00 | -36.00 | 20.00 | -30.00 | -51.00 |
| Inventories | - | -2.00 | 0.00 | 2.00 | - | - |
| Trade & Other payables | -1.00 | 11.00 | -8.00 | 7.00 | 4.00 | 7.00 |
| Others | 6.00 | -36.00 | 25.00 | - | - | - |
| Changes In working Capital | -57.00 | -77.00 | -19.00 | 29.00 | -26.00 | -43.00 |
| Cash Flow after changes in Working Capital | 222.00 | 255.00 | 296.00 | 385.00 | 372.00 | 410.00 |
| Cash From Operating Activities | 197.00 | 215.00 | 256.00 | 385.00 | 372.00 | 410.00 |
| Cash Flow from Investing Activities | -247.00 | -159.00 | 39.00 | -55.00 | -55.00 | -55.00 |
| Purchase of Fixed Assets | -12.00 | -32.00 | -23.00 | -55.00 | -55.00 | -55.00 |
| Sale of Fixed Assets | - | 0.00 | 0.00 | - | - | - |
| Free Cash Flows | 185.00 | 183.00 | 233.00 | 330.00 | 317.00 | 355.00 |
| Cash from Financing Activites | -60.00 | -83.00 | -124.00 | -148.00 | -142.00 | -161.00 |
| Increase / (Decrease) in Loan Funds | - | - | -22.00 | - | - | - |
| Equity Dividend Paid | -60.00 | -83.00 | -102.00 | -123.00 | -142.00 | -161.00 |
| Net Cash Inflow / Outflow | -110.00 | -26.00 | 171.00 | 183.00 | 175.00 | 194.00 |
| Opening Cash & Cash Equivalents | 191.00 | 83.00 | 54.00 | 228.00 | 411.00 | 586.00 |
| Closing Cash & Cash Equivalent | 83.00 | 54.00 | 228.00 | 411.00 | 586.00 | 780.00 |
Key Ratios
| Year End March | 2018 | 2019 | 2020 | 2021E | 2022E | 2023E |
|---|---|---|---|---|---|---|
| Basic EPS | 40.70 | 49.30 | 43.60 | 49.20 | 56.90 | 64.70 |
| Diluted EPS | 40.70 | 49.30 | 43.60 | 49.20 | 56.90 | 64.70 |
| Book value (Rs/share) | 118.60 | 151.40 | 175.00 | 200.50 | 230.00 | 263.50 |
| DPS | 11.00 | 13.50 | 16.50 | 19.70 | 22.80 | 25.90 |
| Return Ratios | ||||||
| ROE (%) | 39.20% | 36.50% | 26.70% | 26.20% | 26.40% | 26.20% |
| ROCE (%) Post Tax | 39.20% | 36.60% | 26.50% | 25.40% | 25.70% | 25.60% |
| Turnover Ratios | ||||||
| Sales/Total assets (x) | 1.70 | 1.50 | 1.30 | 1.20 | 1.10 | 1.20 |
| Sales/Net FA (x) | 13.70 | 16.30 | 13.00 | 11.40 | 11.90 | 13.00 |
| Sales/Gross FA (x) | 10.00 | 9.90 | 7.50 | 6.20 | 5.70 | 5.60 |
| Liquidity Ratios | ||||||
| Debt/EBITA | - | - | 0.20 | 0.10 | 0.10 | 0.10 |
| EBITDA/Intt. | 448.70 | 416.20 | 51.90 | 61.90 | 70.30 | 80.80 |
| Working Capital Ratios | ||||||
| Receivable Days | 73.00 | 76.00 | 85.00 | 82.00 | 75.00 | 72.00 |
| Inventory Days | - | 0.00 | 0.00 | 0.00 | - | - |
| Payable Days | 12.00 | 11.00 | 12.00 | 11.00 | 11.00 | 11.00 |
| Working Capital (days) | 61.00 | 64.00 | 74.00 | 71.00 | 64.00 | 62.00 |
| Valuation Ratios | ||||||
| PE | 25.60 | 20.70 | 14.40 | 35.00 | 30.30 | 26.60 |
| EV/EBITDA | 16.00 | 12.70 | 8.70 | 23.60 | 20.50 | 17.50 |
| P/BV | 8.30 | 6.40 | 3.40 | 8.60 | 7.50 | 6.50 |
| P/Sales | 4.40 | 3.80 | 2.30 | 6.30 | 5.70 | 5.00 |
| P/FCF | 33.10 | 32.70 | 15.80 | 32.50 | 33.90 | 30.30 |
| Operating Cash Flow/PAT | 0.80 | 0.70 | 0.90 | 1.30 | 1.00 | 1.00 |