
Tata Consumer Products Ltd
Consumer Food
Tata Consumer Products Ltd
Consumer Food
Stock Info
Shareholding Pattern
Price performance
Indexed Stock Performance
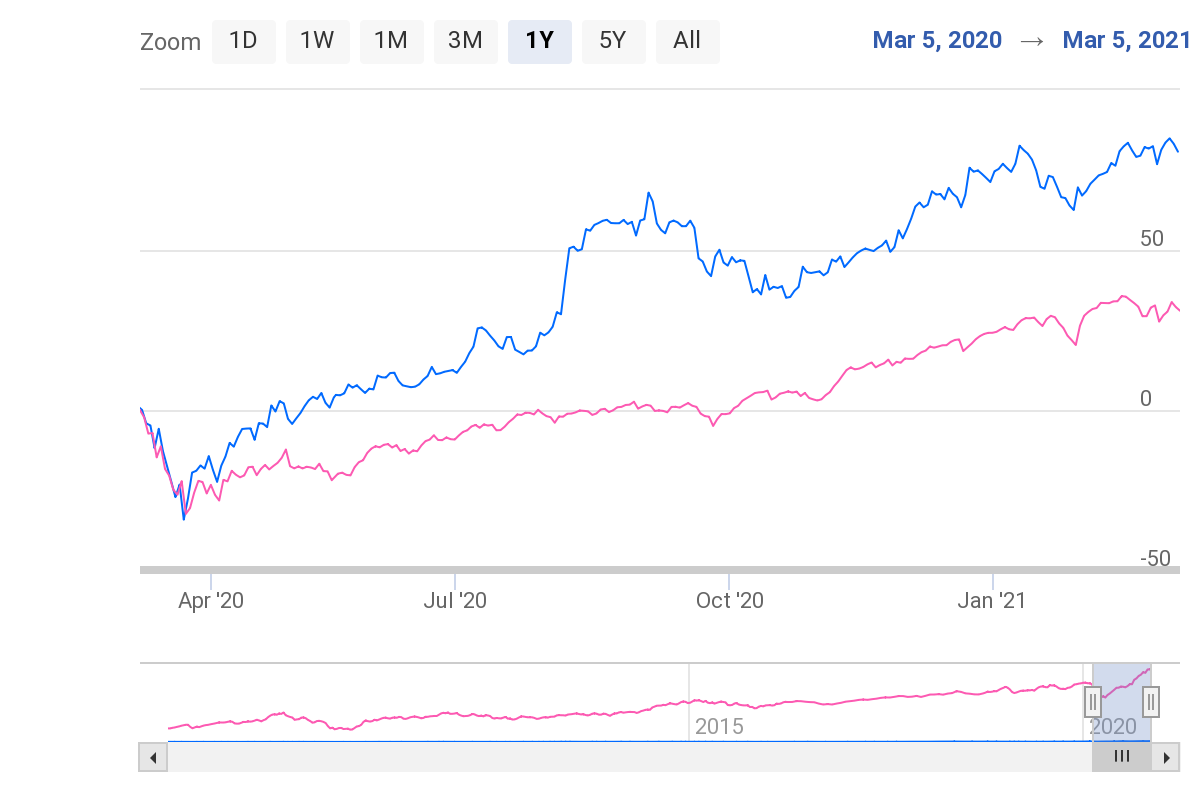
Tea and Coffee continue to remain most preferable & durable beverage choice globally.
Profile:
Tata Consumer Products limited (TCPL) is a focused consumer products company uniting
the food and beverage interests of the Tata Group under one umbrella. It is home
to key brands such as Tata Tea, Tetley, Tata Salt and Tata Sampann. With a combined
reach of over 200 million households in India, it has an unparalleled ability to
leverage the Tata brand in consumer products.
In the Beverages business, Tata Consumer Products is the 2nd largest player in branded tea in the world with over 330 million servings everyday across the world. Their brands include Tata Tea, Tetley, Vitax, Eight O’Clock Coffee, Himalayan Natural Mineral Water, Tata Coffee Grand and Joekels.
Beginning with the iconic Tata Salt that pioneered the crusade for iodisation in India, their Foods business is one of the most trusted food brands in India and they have extended the portfolio to include salt variants and nourishing food items. With Tata Sampann they bring the traditional wisdom of Indian food in a contemporary package to deliver the best of taste, nutrition and convenience.
Tata Consumer Products has grown through innovation, strategic alliances and acquisitions, and organic growth. The Company has a joint venture with Starbucks called Tata Starbucks Limited, to own and operate Starbucks cafés in India. Since the inauguration of the flagship store in Mumbai in October 2012, this 50:50 JV has expanded to 209 stores in 12 cities, with many more Starbucks stores planned across the country.
The Company also has a subsidiary called NourishCo, which produces non-carbonated ready-to-drink beverages that focus on health and enhanced wellness. NourishCo produces and markets Tata Water Plus — India’s first nutrient water, and Tata Gluco Plus — an energizing, glucose-based flavoured drink. Himalayan water is also marketed and distributed through NourishCo.
The high-growth contemporary 'single-serve' business is also an important play for Tata Consumer Products. In the USA they have an agreement with Green Mountain Coffee Roasters’ Keurig single-serve machines for Eight O'Clock Coffee, with K-Fee for MAP Coffee in Australia, and with Tassimo in Canada for Tetley tea.
Source: Company, StockAxis Research
Investment Rationale:
Indian Tea business will continue to post steady growth:
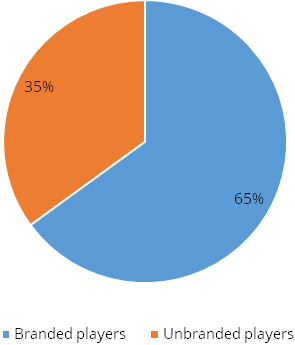
The Indian branded packaged tea market is Rs. 260bn and dominated by two players:
HUL and TCPL, with HUL no. 1 by value and TCPL no. 1 by volume. As much as 35% of
the overall tea market is still in the loose form. We have been noticing a shift
from loose to packaged forms in all other foods segments, and we are convinced a
similar shift is underway in the tea segment as well. The unbranded players have
consistently lost the market share over last decade. As per IBEF, the current scenario
the market share of Branded players is at~65% from ~50% over last decade. High growth
of Branded players is at the cost of unbranded players bleeding out market share.
Merger has unlocked resilient synergies:
TCPL’s (Pre-merger) 90% revenues comprises from banded category. TCPL’s
Tetley is the oldest and well known tea brand globally. The company was predominantly
present in the business of hot beverages with some presence in the packaged water.
Post-acquisition of consumer products portfolio of Tata Chemicals, it is also present
in salt, pulses and spices & now the revenue share of India business in TCPL
is >60%. We believe the acquisition will improve TCPL’s standing in the
trade and strengthen the moats in the business &help in widening distribution
reach for their consumer products.
Premiumization a key growth driver for its Branded portfolio:
TCPL’s focus has shifted from base products to valued added products in each
category. This would not only drive revenues but also expand margins. The company
has launched Tata Tea Tulsi, Tetley green tea Immune, Tata tea Gold care, Tata Sampann
Poha (thin) & Tata Tea Quick chai (Ready To Drink tea) in India in last few
months.
Strategic JV’s, Associations and Inorganic acquisitions to fuel growth in
near term:
TCPL has entered into a 50:50 JV with Starbucks. The number of Starbucks retail
outlets in India has grown to 209 as at Dec’20-end post commencement in FY12.
We also note Starbucks has steadily expanded to 12 cities now. The losses of the
business are also reducing on per store basis. We believe the mature outlets (>3-year
old) are generating healthy EBITDA at the store level.
Food business to act as a key catalyst for growth:
TCPL’s strategy is to leverage the Tata brand equity to scale up in a large
unorganised market and to leverage the reach of its existing food distribution business,
which includes established brands such as Tata Tea and Tata Salt. TCPL has launched
its brand “TATA Sampann” for its food division. Under the mother brand
Tata Sampann, TCPL is looking to offer the entire range of staple foods, including
pulses, spices, condiments, snacks, ready-to-cook, etc. Most importantly, it marks
the company’s entry into a large category with huge growth potential.
Enhancing product portfolio in Water business:
In India, water is the second largest beverage sub-category after tea. The current
size of the packaged water market in the country is Rs. ~170bn, expanding at a CAGR
of 12%. Fruit-based beverages is a Rs. ~82.5bn category, increasing at a CAGR of
10%. Overall, within the water category, the company offers natural mineral water,
nutrient water and ready-to-serve drinks. It has three brands in this category:
Himalayan, Tata Gluco+ and Tata Water+. In order to focus keenly on the water segment,
the company has bought out 50% of PepsiCo’s stake in NourishCo. Now, NourishCo
is a wholly owned subsidiary of the company.
Change in management at top level:
TCPL has appointed Mr Sunil D’Souza (current MD of Whirlpool India) as its
next MD and CEO from April 2020. This change in management will lead to shape and
drive TATA group’s FMCG ambitions. Mr Sunil comes with a cross-functional
experience of more than 25+ years; in past Mr Sunil has worked with big MNC’s
such as Pepsico, Coca Cola, and Brooke Bond Lipton India. We believe this will help
company to grow well in new FMCG categories.
Outlook & Valuation:
TCPL is a flagship company of TATA group; TCPL has a wide geographical reach and has a huge diversified business. We believe TCPL will continue to drive business well on the back of strong fundamentals, good brand recall, discontinuation of less profitable business and new management personnel. We expect that merger of Tata chemical’s food business will help in unlocking synergies such as expanding distribution reach, product portfolio and operational efficiencies. At CMP of Rs. 596 the stock trades at PE of 50x/42x on our FY22E and FY23E EPS estimates. We initiate a Buy on TCPL for long term perspective.
Consolidated Financial Statements
| Rs in Cr | Net Sales | EBITDA | EBITDAM | PAT | EPS | ROE | P/E | EV/EBITDA |
|---|---|---|---|---|---|---|---|---|
| FY18 | 6815.40 | 838.90 | 12.30% | 495.60 | 7.80 | 6.20% | 32.90 | 18.60 |
| FY19 | 7251.50 | 785.90 | 10.80% | 408.20 | 6.40 | 4.90% | 31.40 | 15.80 |
| FY20 | 9637.40 | 1292.20 | 13.40% | 459.80 | 5.00 | 3.10% | 59.10 | 20.10 |
| FY21E | 10408.40 | 1571.70 | 15.10% | 927.20 | 10.00 | 6.00% | 57.90 | 34.60 |
| FY22E | 11553.30 | 1837.00 | 15.90% | 1166.80 | 12.60 | 7.20% | 48.00 | 29.40 |
| FY23E | 12593.10 | 2052.70 | 16.30% | 1397.40 | 14.60 | 8.00% | 40.90 | 25.60 |
Investment Rationale
Indian Tea business will continue to post steady growth:
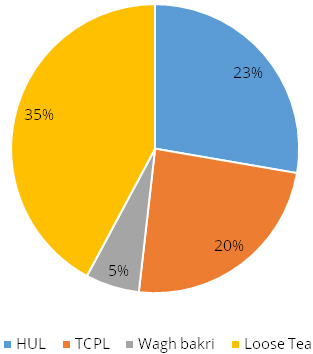
The Indian packaged branded tea market is Rs. 260bn and dominated by two players:
HUL and TCPL, with HUL no. 1 by value and TCPL no. 1 by volume. As much as 35% of
the overall tea market is still in the loose form. We have been noticing a shift
from loose to packaged forms in all other foods segments, and we are convinced a
similar shift is underway in the tea segment as well. The unbranded players have
consistently lost the market share over last decade. As per IBEF, the current scenario
the market share of Branded players is at~65% from ~50% over last decade. High growth
of Branded players is at the cost of unbranded players. TCPL is been consistent
in having a huge chunk of market share in tea segment. Currently, TCPL has 20% market
share in the branded tea segment in India. TCPL continues to retain this market
share as well as it expects it to increase in upcoming years with the help of new
product launches, and increased reach of their premium products such as Chakra gold,
Activ+, Tata gold etc.
TCPL is no. 2 branded tea company in the world with a portfolio of global leading brands. Its range of tea includes black tea, specialty tea, cold infusions, ices tea, ready to drink tea, etc. TCPL’s strength lies in: i) being the no. 1 in the category by volume and no. 2 by value; and ii) the Tetley brand’s no. 1 position in Canada and no. 3 in UK.
Company has now also started new initiatives such as providing out of home tea stores named TATA Cha, it has opened till date 6 stores in Bangalore.
Packaged tea in India is the largest business for TCPL; it contributed ~57.7% of its standalone revenue in FY20. This is also a profitable business with FY20 India beverages segment EBIT margin at 13.8% against total branded business EBIT margin of 12.6%. Over the decade TCPL’s Tea business has consistently posted revenue growth every single year despite headwinds. We believe this shift together with premiumisation and an expanded distribution network will enable TCPL to clock a CAGR of 8.5% over FY20–23E in its base tea business.
Exhibit No 1: TCPL Tea product portfolio

Source: Company, Stockaxis Research
Exhibit No 2: Market segmentation of Indian Tea Industry
Source: Company, Stockaxis Research
Exhibit No 3: Market share of Branded Players
Source: Company, Stockaxis Research
Over the years, TCPL has positioned itself well with a few national as well as regional brands. In the tea business, regional brands are as much important as national brands since they have an appeal of region-specific taste and flavour. The national brand does the job of creating brand equity while catering to the needs of people that have migrated and are accustomed to sipping a national brand. This way TCPL is competing across levels.
In order to further tap into regional markets, TCPL has acquired Kala Ghoda and Lal Ghoda tea brands from Dhunseri. These brands have a strong market presence in Rajasthan. The acquisition, thereby, strengthens presence of TCPL in Rajasthan.
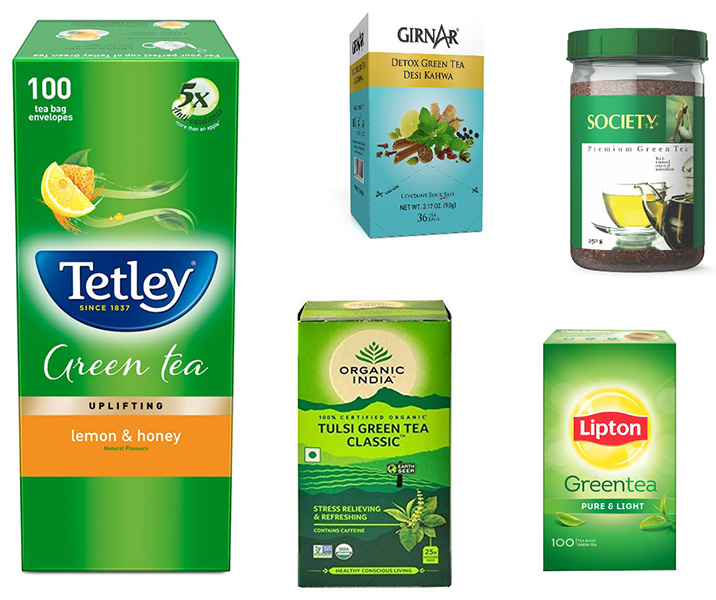
Green Tea is a next opportunity for growth
The next big growth area for tea companies is the green tea segment. This is currently
about Rs. 6bn only. But the bigger point is the potential it can reach going ahead.
As per statista, the Green tea category is estimated to clock growth of 15–20%
over the next four–five years; hence this category is slated to touch a market
size of Rs. 12.5bn by FY25E. Within green tea too, while most tea players have entered
this category, just like in black tea HUL and TCPL continue to dominate with ~70%
market share put together. In terms of launches too, both the companies are quite
dominant and thus they would continue to dominate the market share. The key, however,
is green tea has superior realisation (per kg), which will help TCPL in improving
overall realisation.
Exhibit No 4: Green Tea players
Source: Company, Stockaxis Research
Merger has unlocked resilient synergies:
TCPL’s (Pre-merger) 90% revenues comprises from banded category. TCPL’s
Tetley is the oldest and well known tea brand globally. TCPL is largely present
in the business of hot beverages with some presence in the packaged water segment
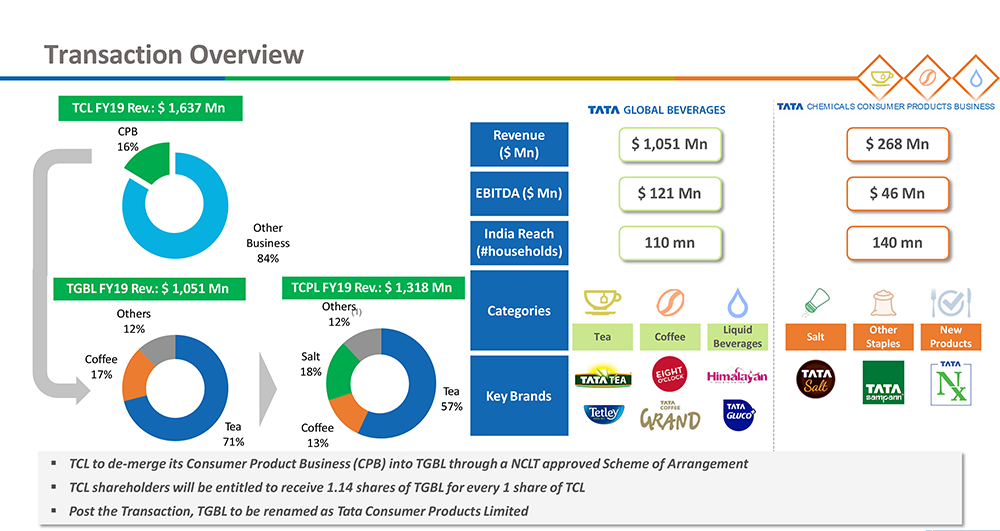
too. Post-acquisition of the consumer business of Tata Chemicals, the revenue share
of India business in TCPL is >60%. We also believe the acquisition will improve
TCPL’s standing in the trade and strengthen the moats in the business. TCL’s
consumer products business portfolio includes TATA salt, blended spices, pulses,
ready to eat mixed and other nutrition products. This merger has helped in widening
distribution reach for their consumer products.
Exhibit No 5: Transaction overview
Source: Company, Stockaxis Research
With the help of this merger the company has become a major FMCG player in the market. TCPL has two strong legs in the India business - Tata Tea and Tata Salt - by which it is targeting lower double-digit growth, driven by cross-selling between Tata Chemicals and TCPL's distribution channels, and expansion into new geographies.
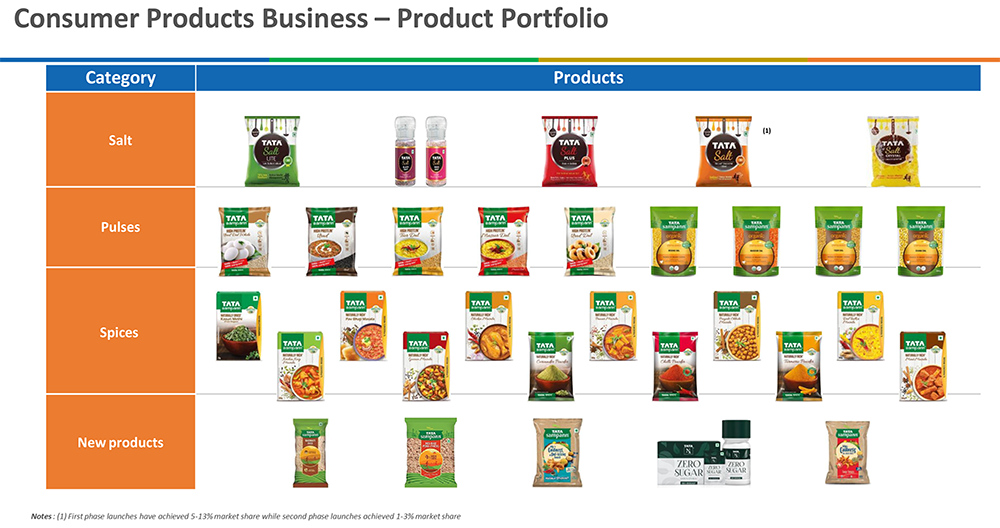
The consumer product portfolio of Tata Chemicals consists of Tata Salt, Tata Sampann and other smaller products. Salt business accounted for 80% of the revenues of Tata Chemicals’ consumer products portfolio. Revenues from this portfolio have grown at a CAGR of 3.2% over FY17-FY20 and EBITDA margin has expanded from 11.8% in FY17 to 17.1% in FY20.
As per Management, TCPL will launch new products and expand its product portfolio in food segment. As per the management, the focus remains on growth led by premiumization.
Exhibit No 6: Consumer product portfolio of Tata Chemicals
Source: Company, Stockaxis Research
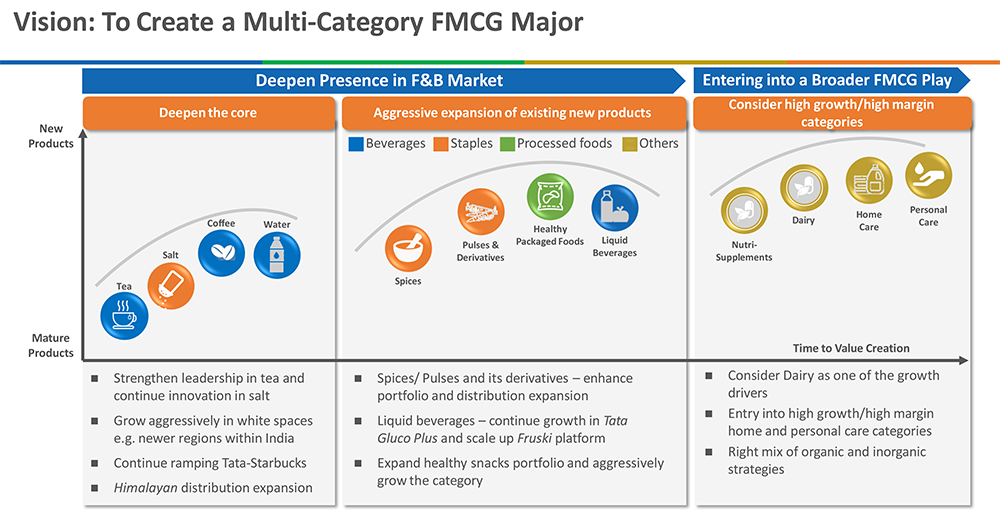
Exhibit No 7: Synergies from acquisition
Source: Company, Stockaxis Research
Synergy benefits
- Expansion of distribution network
- Better bargaining power with distributors / retail outlets
- Media buying and packaging material sourcing
- Launches of other brands
Expansion of distribution network:
TCPL retail network is spread across ~2mn outlets and that of the consumer business
of Tata Chemicals across ~1.5mn outlets. While some outlets will be common, we estimate
the combined distribution network to comprise ~2.5mn outlets. The acquisition will
thus bring about a sharp jump in distribution for both the businesses.
The new segments of Tata chemical’s consumer business such as branded pulses have just 1% market penetration and are available in less than 0.2mn retail outlets. The branded spices and condiments are present in less than 0.1mn retail outlets with penetration of just ~10%. We believe expanded distribution network can help to drive growth of these product categories.
Better bargaining power with the trade:
Tata Salt is the market-leading salt brand with c.25% market share in India
whereas Tata Tea is largest tea brand in volume terms. Combined distribution
of these two brands along with other brands will provide a larger scale to the distributors.
We believe the distributors will be able to generate better return on investments
post-merger of these distribution networks, which will also increase TCPL’s
bargaining power with the distributors. We expect lower trade spends and/or lower
credit to trade from FY21 onward as a result of the acquisition.
Synergy benefits in media buying and commodity sourcing: Synergy benefits are expected in three departments: 1) media buying, 2) raw material sourcing (largely packaging materials), and 3) freight. We expect combined savings of at least 50bps under these three expense heads.
Launches of other brands:
A larger distribution network and enhanced budget for ad-spend will also allow launch
of other brands. TCPL has already listed five growth areas post-merger: 1) Tata
Sampann – staples and packaged foods, 2) Tata Fruski –
umbrella brand for liquid beverages, 3) Good earth teapigs – youth-focused
international tea brand, 4) Tata Nx – nutri-supplements and sweeteners,
and 5) Tata Cha as out-of-home tea consumption centers.
We note that TCPL’s brand architecture and that of the consumer business of Tata Chemicals are similar. The similarities are as follows:
- Both businesses are from Tata group (same culture)
- Both Tata Tea and Tata Salt will benefit from shift from unorganised to organised
- Both the businesses are focusing on ‘Health’ platform
- Premiumisation is the key growth driver for both businesses
Considering the similarities in the brand architecture and similar growth path, we believe there is strong potential for growth together – in addition to the higher potential for synergies.
Premiumization a key growth driver for its Branded portfolio:
TCPL’s focus has now shifted from base products to valued added products in
each category. This would not only drive revenues but also expand margins. It has
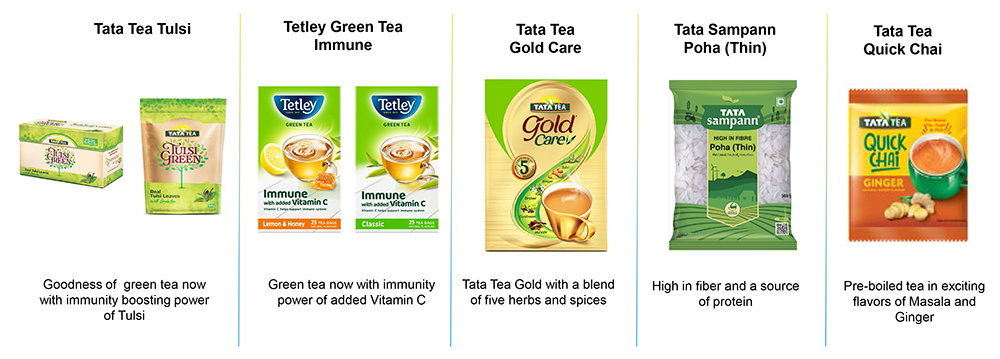
launched Tata Tea Tulsi, Tetley green tea Immune, Tata tea Gold care, Tata Sampann
Poha (thin) & Tata Tea Quick chai (RTD tea) in India. It also launched many
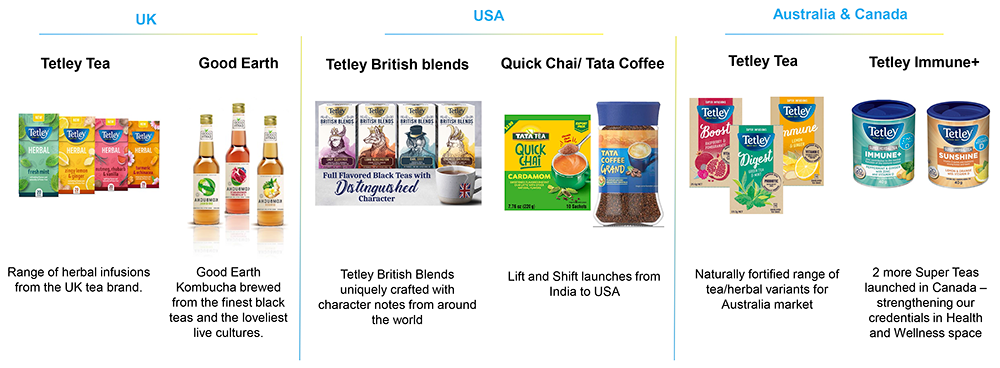
new product based on health & immunity in International geographies. Further,
high margin products (Tata Salt Lite, Tata Sampann) are growing much faster compared
to base brands. In order to differentiate and maintain consumer engagement, TCPL
is steadily introducing new products. We believe steady flow of new products will
help to differentiate from base commodities ‘tea and coffee’. The new
product launches also fetch better realizations and boost the margins.
TCPL is focusing on premiumisation led growth, as current key brands/products Tata Salt/Tata Tea the markets are penetrated well.
TCPL is pursuing similar strategy in other markets as reflected in recently launched Tetley super teas in Canada. Tetley super teas are fortified with vitamins and minerals. This product was also able to gain market share of 1.6% of non-black tea quickly. Similarly in UK TCPL’s Tetley launched cold infusion products which can be brewed with cold water. Tetley continues to expand its portfolio in non-black tea by launching excited products.
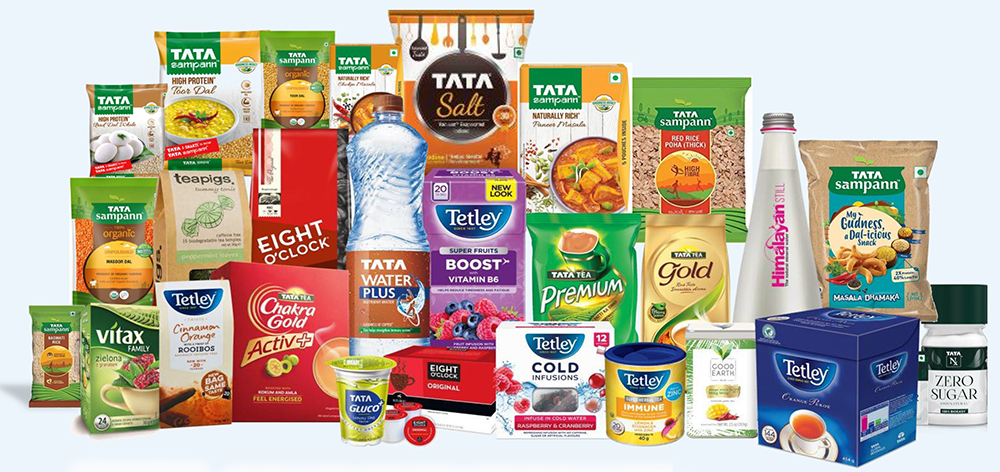
Exhibit no 8: Branded product portfolio
Source: Company, Stockaxis Research
Due to rising health awareness, consumers prefer healthier variants of salt. We believe Tata Salt is well positioned to capture the trend of premiumization in India. While the volume growth will be achieved via taking share from unorganised, we expect the company to also benefit with higher realization from premiumization.
Exhibit no 9: Value added Salt portfolio

Source: Company, Stockaxis Research
Exhibit No 10: Premium Products in India
Source: Company, Stockaxis Research
Exhibit No 11: Premium Products in International market
Source: Company, Stockaxis Research
Strategic JV’s, Associations and Inorganic acquisitions to fuel growth in
near term:
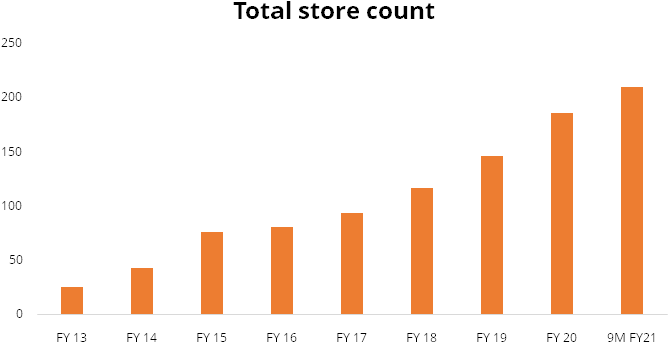
TCPL has entered into a 50:50 JV with Starbucks. The number of Starbucks retail
outlets in India has grown to 209 as at Dec’20-end post commencement in FY12.
We also note Starbucks has steadily expanded to eleven cities now. The losses of
the business are also reducing on per store basis. We believe the mature outlets
(>3-year old) are generating healthy EBITDA at the store level.
Starbucks coffee is best place to have coffee among millennials. Pre-covid-19, the coffee culture was nicely burgeoning. Add to it, other competing players were anyway struggling – earlier Barista and then CCD. In metros, other prominent coffee joints are Coffee Beans & Tea Leaf and Costa Coffee; however, their store count and brand affinity are nothing to write home about. This makes Starbucks almost a monopoly.
The major cities in India where Starbucks outlets are present are: Mumbai, Pune, Chandigarh, New Delhi, Gurgaon, Kolkata, Bengaluru, Ahmedabad, Surat, Vadodara and Chennai. The company plans to steadily add new outlets in other regions. It has also started highway stores on the Mumbai-Pune Expressway and Bengaluru-Tirupati highway.
Starbucks is premier marketer and retailer of specialty coffee operating in 81 countries. It generated 69% revenues from America, 23% from International markets and 8% from channel development. At end of Sept 2020, the company had total 31,256 stores worldwide (15,834 own stores and 15,422 licensed stores). Starbucks operates the India stores on licensed basis with Tata group.
While India business is still in investment phase, we note the Starbucks business generates healthy profitability at the parent level. Once the India business matures, we expect India business profit margins to move closer to global margins.
Exhibit No 12: Starbucks Total Number of stores
Source: Company, Stockaxis Research
TCPL is been ahead in inorganic growth; TCPL has done a few acquisitions previously and been able to run those companies efficiently. Recently TCPL had acquired Dhunseri tea & industries Limited for the amount of Rs 101 crores. Dhunseri tea has 2 major brands i.e. Lal Ghoda and Kala Ghoda tea which has 6% market share in Rajasthan. This acquisition enables TCPL to enter markets of Rajasthan which has a few local players with large chunk of market share.
Exhibit No 13: Dhunseri Tea Brands

Source: Company, Stockaxis Research
Recently TCPL has acquired a snack food company known as “Kottaram Agro Foods Private Limited” (KAFPL). The company sells its products under the brand name of “Soulful”. Soulful is a strong brand built in select urban markets with a reach of 15,000 outlets, offering significant potential for geographic expansion. KAFPL will become a 100% subsidiary of TCPL after integrating its Sales & Distribution system.
Exhibit no 14: Soulfull brands

Source: Company, Stockaxis Research
This acquisition will help company to expand its Snack-food product portfolio and we believe the acquisition is in-line with the company’s strategy to expand its food segment.
Food business to act as a key catalyst for growth:
TCPL’s strategy is to leverage the Tata brand equity to scale up in a large
unorganised market and to leverage the reach of its existing food distribution business.
Under the brand Tata Sampann, TCPL is looking to offer the entire range of staple
foods, including pulses, spices, condiments, snacks, ready-to-cook, etc. Most importantly,
it marks the company’s entry is into a large category with huge growth potential.
Here company doesn’t face any stiff competition and company enjoys leadership
position in the organised market.
Pulses and derivatives:
This is a Rs. ~1500bn category with branded penetration currently of 1%, implying
a hugely untapped market. Unlike other categories, there are barely any national
brands in this category. Competition is largely from regional players or private
labels of modern trade and e-commerce companies.
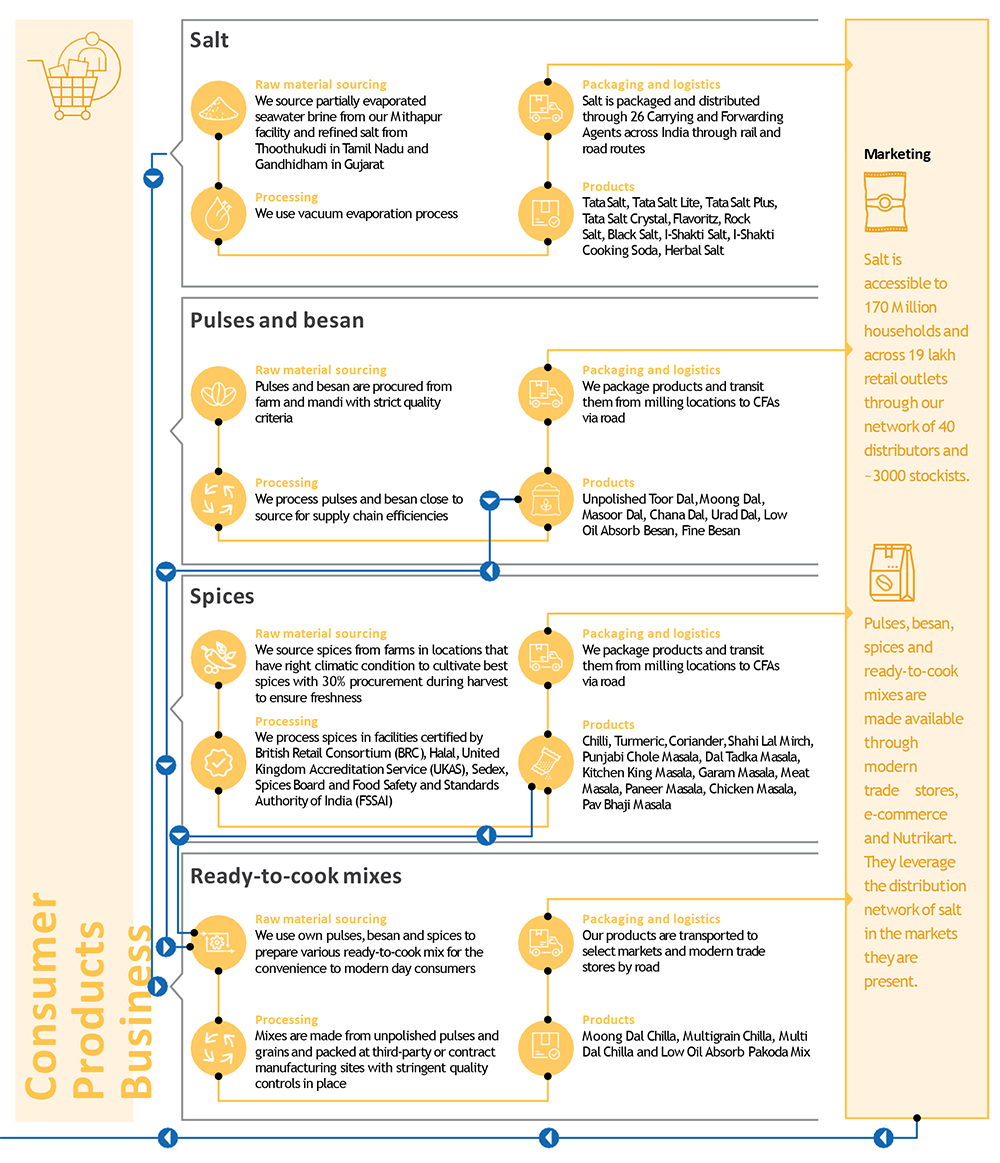
Fully-integrated operations:
For any long-term player, the foremost thing is to establish backend operations
with capacity expansion and volume scale-up is unified. Furthermore, as volumes
pick up, operating leverage would take care of a lot of cost items. With this in
mind, TCPL has created fully-integrated backend operations. This offers assurance
in procurement and quality. There is a higher ability to experiment in ready-to-eat
with different options of pulses/besan, which leads to differentiated products.
The company now has nine packing centre’s for pulses, which are the same ones it uses for packing salt. The company sells unpolished pulses; hence the focus is on procuring high quality pulses, maintaining their quality and ensuring the products are packed and reach the outlets at the earliest as the shelf life of pulses is eight–nine months.
Spices:
This is a Rs. ~600bn category with branded penetration of 30%. In this category,
unlike pulses, there is competition from established players such as Everest, MDH,
Sunrise, etc. But most of the spices players are strong in specific regions.
The overall reach for Tata Sampann in pulses is 40,000–50,000 outlets; in spices, the reach is about 30,000. The company’s combined reach is 2.5mn outlets, so the potential for distribution multiplier effect is huge.
Spices is a profitable category with gross margins of 35-40% and EBITDA margins of 15–20%. Pulses, on the other hand, will take a long time and sustained effort to clock double-digit EBITDA margin.
Exhibit No 15: Food Business & Integrated operations
Source: Company, Stockaxis Research
Enhancing product portfolio in Water business:
Water is the second largest beverage sub-category after tea in India. As per company,
the current size of the packaged water market in the country is Rs. ~170bn, expanding
at a CAGR of 12%. Fruit-based beverages is a Rs. ~82.5bn category, increasing at
a CAGR of 10%. Overall, within the water category, the company offers natural mineral
water, nutrient water and ready-to-serve drinks. It has three brands in this category:
Himalayan, Tata Gluco+ and Tata Water+. In order focus keenly on the water segment,
the company has bought out 50% of PepsiCo’s stake in NourishCo. Now, NourishCo
is a wholly owned subsidiary of the company.
Although for TCPL, the packaged water segment is very nascent at present, it is likely to grow steadily considering the rising health consciousness and patchy availability of safe drinking water in India.
Exhibit No 16: Nourishco Product portfolio
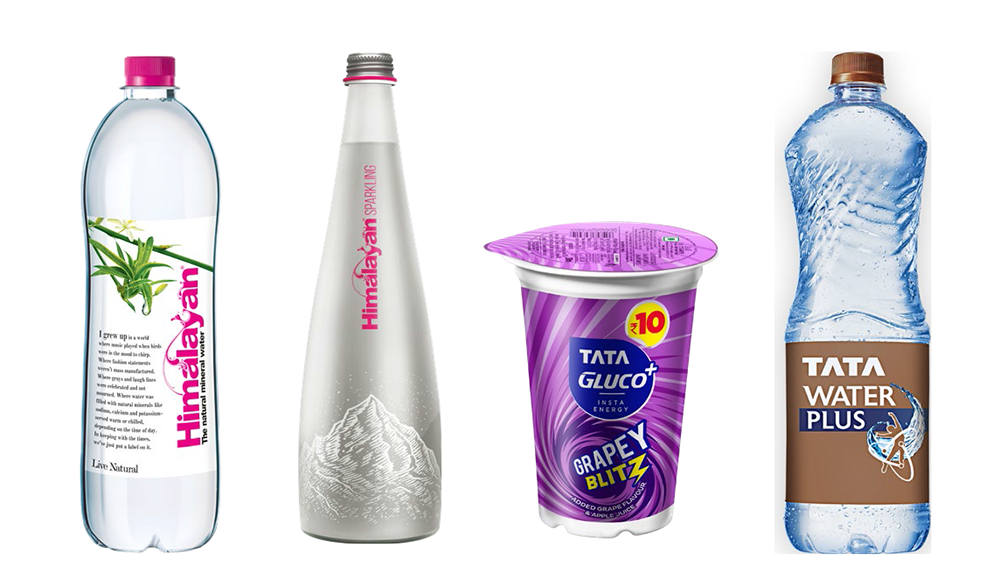
Exhibit no 17: Product competition of TCPL’s Water products
| Company | Brand | Price Per Litre |
|---|---|---|
| TCPL | Himalayan | Rs. 65 |
| TCPL | Tata Water plus | Rs. 20 |
| PepsiCo | Aquafina | Rs. 20 |
| Parle | Bisleri | Rs. 20 |
| Coca Cola | Kinley | Rs. 20 |
Change in management at top level:
TCPL has appointed Mr Sunil D’Souza (current MD of Whirlpool India) as its
next MD and CEO from April 2020. This change in management will lead to shape and
drive TATA group’s FMCG ambitions. Mr Sunil comes with a cross-functional
experience of more than 25+ years; in past Mr Sunil has worked with big MNC’s
such as Pepsico, Coca Cola, and Brooke Bond Lipton India. We believe this will help
company to grow well in new FMCG categories. The appointment of new MD Mr. Sunil
D’Souza, who comes in with a vast experience in the consumer goods space,
and the Tata Group’s focus on having a large presence in consumer goods imply
TCPL has building blocks in place to take advantage of the huge opportunity in the
Indian consumer goods sector.
In effect, all of these implied only one thing for TCPL: to make it leaner as an organisation with management focusing on key business verticals (food and beverages) and deriving more bang for the buck, i.e. improving return ratios.
Few examples were in change in management was successful for the company. For example, Mr. Varun Berry joined Britannia, Mr Suresh Narayanan Nestle India and Mr Pratik Pota Jubilant FoodWorks: each of these management changes made these companies a force to reckon with in their respective categories. This was possible because of a strategic and fresh look at problems as well as organic/inorganic opportunities by the new MD and/or CEO.
Brief profile about Mr, Sunil D’Souza
- Mr. Sunil Alaric D’Souza has 26 years of rich experience in the consumer goods industry, and in-depth understanding of the foods and beverages categories.
- Prior to joining TCPL, he served as the MD of Whirlpool India and worked in several leadership roles at PepsiCo.
- With Mr. D’Souza now taking over, a strong focus on strategy, growth and execution, including inorganic growth should come about.
- Mr. D’Souza is an alumnus of IIM – Calcutta and an engineering graduate from the University of Madras.
Financials
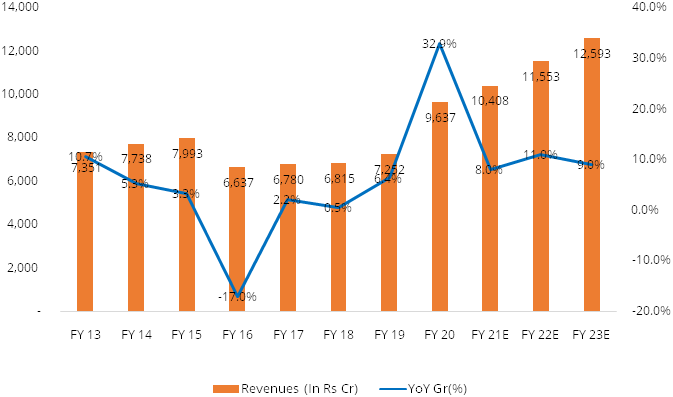
Revenue is expected to grow @~9% CAGR over FY20-FY23E
The company reported revenue CAGR of 5% over FY07-20. Steady growth in India business
and acquisitions of some businesses globally has helped the company to report steady
revenue growth. With acquisition of consumer product portfolio of Tata chemicals,
we expect the company to report revenue CAGR of 9% over FY20-23E driven by widening
distribution reach, cross-selling of products, robust growth in pulses and spices
division and shift from unbranded to branded players.
Exhibit No 18: Revenue trends (In Rs Cr)
Source: Ace equity, StockAxis Research
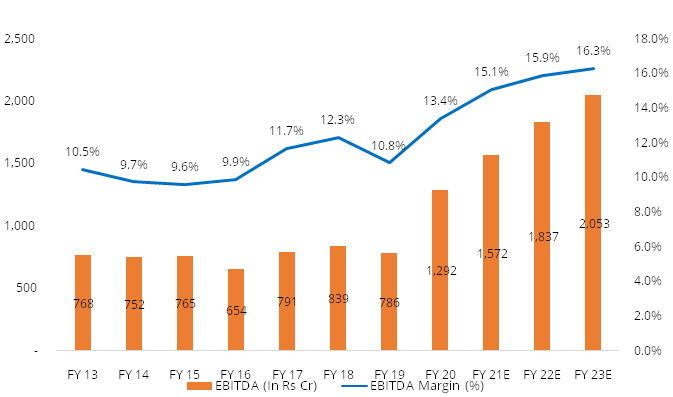
EBITDA margins are expected to expand by ~290 bps over FY20-FY23E
We expect EBITDA to grow at CAGR of ~12% over FY20-FY23E mainly due to improved
higher sales of premium products and continued lower SG&A spend. The company
averaged an EBITDA margin of ~11% from FY13–19. Considering the margin-accretive
nature of the merger TCPL’s EBITDA margin rose to 13.4% in FY20. We expect
it to rise further by 290 bps by FY23E. We believe Premiumisation is a potent margin
lever in both tea and salt. 95–96% of Tata Salt sold is the base variant;
hence, there is great room for premiumisation. The leading national tea players,
HUL and TCPL, have a range of brands. There is a large price ladder, implying immense
room for upgrading the consumer buying lower variant tea to much more premium offerings.
TCPL has guided for 2–3% of revenue as synergy gains from the merger of the
salt and tea businesses, which would come from various sources, including lower
ad rates (higher media buying), cheaper raw material sourcing (especially packaging
cost), leveraging fixed cost (higher scale) and better terms of trade (wider portfolio).
Exhibit No 19: EBITDA and EBITDA margin trend (In Rs Cr)
Source: Ace equity, StockAxis Research
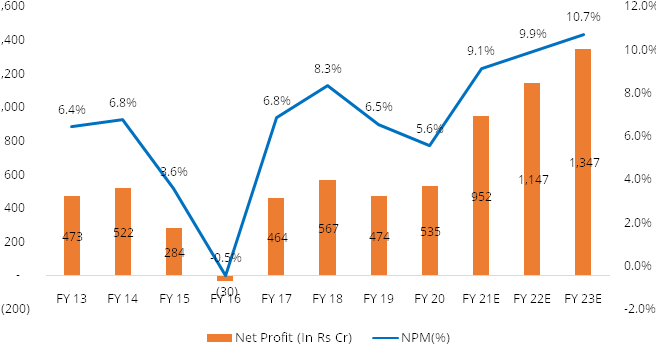
Net profit is expected to grow at ~24% CAGR
We expect net profit to grow @ ~24% CAGR over FY20-23E. We believe multiple drivers
of near-term earnings momentum include an uptick in food division, higher sales
of premium products and operational efficiencies will lead to improve profitability.
In FY20 due to merger, there was one-time exceptional g/w write off worth Rs. 275
crores which in result has reduced PAT to Rs. 535 crores.
Exhibit No 20: Net profit trend (In Rs Cr)
Source: Ace equity, StockAxis Research
Working capital cycle improving
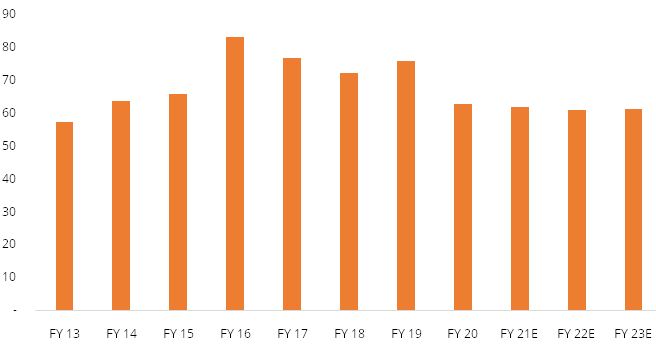
Working capital: TPCL’s cash conversion cycle has been constantly improving,
coming down from 77 days in FY17 to 65 days in FY20. This was driven by the reduction
in inventory days from 83 days in FY17 to 63 days in FY20. We expect the CCC to
improve to 61 days by FY23.
Exhibit No 21: Working capital cycle
Source: Ace equity, StockAxis Research
Return Ratios to expand in future
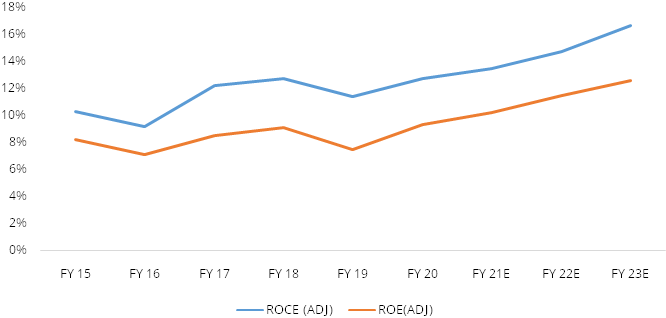
FY20 RoE and RoCE at 4.7% and 6.8%, respectively, look subdued. This is due to the
increase in capital employed following the increase in goodwill and intangible assets
on the balance sheet due to merger with TCL’s consumer business in FY20 and
some past acquisitions that have now been completed. Adjusting for goodwill and
intangible assets, the company’s FY20 RoE and RoCE stand at 9.3% and 12.8%,
respectively.
Going forward, considering the synergy benefits, lower capex requirements and potential revenue momentum, we expect adjusted RoE and RoCE would improve to 12.6% and 16.7%, respectively, by FY23.
Exhibit No 22: Return Ratios
Source: Ace equity, StockAxis Research
Industry
The Fast-moving consumer goods (FMCG) sector is the fourth largest sector of Indian economy. Broadly, the sector comprises of three key segments – Food & Beverages, Healthcare and Household & Personal Care. Amongst these key segments, Household & Personal Care contributes almost half in sector’s revenue as detergents, toiletries, oral care products, cosmetics, etc. are the products which dominate the market.
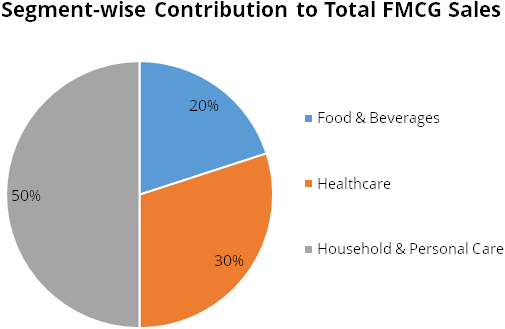
Further, the industry is divided into demographics of rural and urban. Urban segment, being the largest contributor to overall revenue generation, accounts for ~55%. However, the rural segment is witnessing a faster growth than the urban segment led by combination of factors such as increase in income, government support and improved distribution channels of FMCG companies in these areas. A few industry experts believe that the recent Union Budget’s focus on the agriculture sector will help increase rural consumption and sustain the growth momentum.
The industry is largely operating through two primarily channels – general stores and modern trade (supermarkets, e-commerce, etc). The former continues to dominate the industry but over the last few years the modern trade is witnessing rapid growth. Within modern trade, e-commerce plays a vital role to industry’s growth. The e-commerce contribution is higher in metro cities; however, other cities are also extending with an increase in the adoption of modern trade, internet infrastructure, and e-commerce platforms. The e-commerce is expected to contribute exponentially to the overall FMCG sales on account of higher internet penetration, growing number of smartphone users, safety consciousness on the backdrop of covid-19 pandemic, etc.
As per the data available on the website of Statista, the revenue of FMCG industry is expected to reach at USD 103.7 billion in 2020 compared to USD 47.3 billion in 2015, thereby registering a CAGR of 17%. This growth could be on account of increase in per capita income, favourable demographics, rise in rural income, increasing distribution reach of FMCG players in tier-II, tier-III areas, favourable government initiatives, etc.
Key Growth Drivers and Recent Trends in Indian FMCG Industry
Untapped Rural Market
Currently, more than half of overall revenue of the industry is contributed by urban
markets although major part of India’s population lives in rural areas. Factors
such as government’s push to improve rural infrastructure, increase in distribution
network, availability of lower unit packs, higher farm income, direct benefit transfers,
etc. are expected to push the demand in rural areas. During the covid-19 pandemic,
rural markets outperformed urban markets and became critical for FMCG players. During
the H1FY21, the industry witnessed a double digit growth in rural India, while the
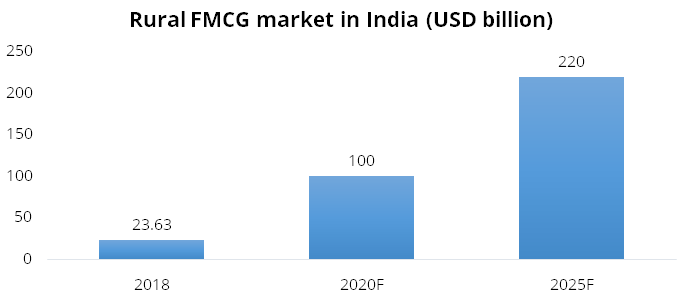
urban India played catch-up. The rural FMCG market is expected to grow to USD 220
billion by 2025 (refer the chart below).
Source: IBEF
Growing E-commerce
Currently, the share of traditional trade stands at 89%, which is expected to shrink
to 85% by 2022. In same period, the contribution by modern trade is expected to
contribute 10% to FMCG sales. In modern trade, E-commerce is expected to reach at
USD 4 billion in 2022 led by increasing penetration of smartphones, growing data
consumption and efforts by large companies to make their products available online
(Source: Nielsen). Further, on account of covid-19 pandemic, there is a
shift towards online shopping and due to which many FMCG players are accelerating
the launch of digital-first brands and rolling out more online-specific
SKUs. Technology innovations such as digital payments, hyper-local logistics, analytics-driven
customer engagement and digital advertisements will likely support growth.
Change in Consumer Behaviour
The pandemic has changed the behaviour of consumers in terms of what they buy and
how they buy. The consumers have become health and hygiene conscious and therefore
the demand in this category is expected to surge. Also, amid lockdown, people have
migrated towards e-commerce platforms and as a result the players in the industry
are witnessing a steep rise in their online sales. A survey conducted by research
agency, Mintel, has come up interesting statistics which states that 41% of the
respondents which were in the age range of 35 – 54 had adopted the online
mode of shopping post-lockdown - showing that people who were previously averse
to the idea of e-commerce have embraced it in the current scenario.
Focus on Health and Hygiene
The global pandemic has changed the demand dynamics in FMCG industry. To meet the
growing demand for products in categories such as home cleaning, disinfectants and
personal care, the players in the industry have rolled out range of new products.
These players are launching products to satisfy the evolving needs of the consumers
and in last few months, they have launched gadget disinfectants, vegetable cleaners,
hand sanitisers, liquid handwash, immunity-boosting products, etc. This trend may
continue in near to medium-term and could witness a growth in demand which could
help the companies in the industry to boost their revenue.
Surge in Demand for Immunity-boosting Products
Earlier, this segment of the industry received a demand from high-end urban population.
However, due to increase in priority for health and immunity, health supplements
are being treated as essential products. Anything and everything sold as immunity
boosters are flying off the shelves in the current time of pandemic. Every third
customer has been ordering an immunity-boosting product on e-commerce websites (Source:
outlookindia). Seeing the growing opportunity, many players in the industry
have started adding the products in their product portfolio which are centred around
health and immunity.
Indian Tea and Coffee Industry
Globally, India is the second-largest producer of tea. States such as Assam, Uttar
Pradesh, Bihar, West Bengal, Maharashtra, Gujarat, Tamil Nadu, Kerala, and Karnataka
are the leading regions in the industry, with Assam accounting for the largest market
share. The country is also the largest consumer of the beverage, with about 80%
of the total production consumed domestically. India’s tea consumption has
grown at a CAGR of 3.67% from 2015 – 2020.
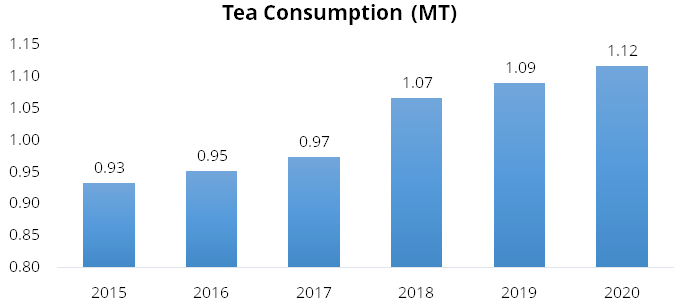
Source: Statista
Nearly 1.12 million tons of tea was consumed in India in 2020 and is projected to grow at 4.2% CAGR from 2021 – 2026 to reach at 1.4 million tons (Source: expertmarketresearch). The industry is being driven by the high penetration of the beverage across socio-economic classes. The country’s economic growth, rapid urbanisation and growth in disposable income are acting as a catalyst for the growth of the industry as people are preferring premium brands. Increasing demand for packaged tea in both urban as well as in rural areas on account of lesser probability of adulteration, convenient storage, and comparatively superior quality is further aiding the growth in the industry. It is witnessed that middle-class is experimenting with more tea blends, therefore, providing the impetus for the growth of segments such as herbal, fruit and other such speciality verity. The convenience of distribution channels such as local kirana stores and supermarkets along with the growing online channel, also expected to aid the industry growth further.
India is one of the largest producers of the coffee in the world, representing ~4.6% of the world coffee exports in 2019 (Source: indiacoffee). According to the reports of Statista, the Indian coffee segment has grown at a CAGR of 1.8% from USD 752 million in 2016 to USD 808 million in 2020. Further, the segment is expected to grow at a CAGR of 8.9% between 2020 – 2025 and reach at USD 1,240 million.
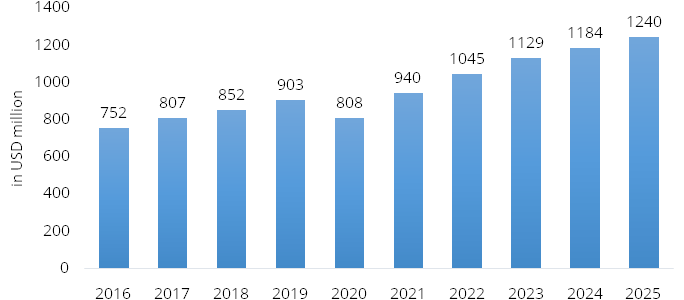
Source: Statista
Factors like growing urbanization, changing culture, and westernisation along with rising demand of a young demographic in line with increasing disposable income are going to act as a key role in driving the Indian coffee market in coming years. Further, the growth will also be backed by the rising coffee brands set up in India such as Starbucks, Barista cafes, among others.
Rural India is slowly evolving in every aspect. They’re not shying away from trying new things, be it online shopping or digital banking. If brands are able to create a connection with rural India, then we would see exponential growth in the overall consumption of coffee in the country. However, the negative impact of the ongoing coronavirus pandemic could be felt in the segment as well due to major disruption in the global demand and supply chain and prolonged shutdown of restaurants, hotels, and cafes across the country.
Indian Pulses Market
India is the largest producer and consumer of pulses in the world, contributing
nearly ~25% of the global production and ~27% of the global consumption. Currently,
there isn’t enough production of pulses in the country which could fulfil
the demand of 26-27 million tonnes per year, and therefore India has to rely on
imports to bridge this gap. In 2020, India produced 23.15 MMT (22.08 MMT in 2019)
of pulses and the imports value of the pulses stood at Rs. 102.2 billion (Rs. 80.35
billion in 2019). The area under pulses has increased from 24.9 million hectares
in 2016 to 29.4 million hectares in 2020, however pulses productivity in India is
very low and has not allowed the level of production to match up to the growth in
demand thereby has increased the dependency on imports.
Indian population is expected to exceed 1.5 Billion by 2030, which in turn, create a huge demand for food, thereby driving the consumption of pulses in the country. Additionally, pulses have found applications in the food processing industry and the pulses flour is considered to be healthier compared to the alternative like wheat flour. Therefore, pulse flour is acting as a replacement in making snacks and confectionary items to produce healthier food options for health-conscious consumers. Similarly, pulses are also being increasingly used in the ready to eat and snack food industry
Indian Salt Market
India is the third-largest salt producer in the world after China and the USA. Since
2014, India export of salt (including solution, salt water) grew 12.7% YoY. At USD
222.5 in 2019, India ranked third among other countries. The Indian salt market
is estimated to be ~Rs. 7,000 crores. The major part of the market is unorganised;
however, it is expected that the edible salt market to be 100% branded in coming
4–5 years. The growth drivers for branded play remains the increasing awareness
of better product quality, visible purity and iodine content. The market for value-added
salt category, accelerated by the covid-19 pandemic, will also gain a lot more visibility.
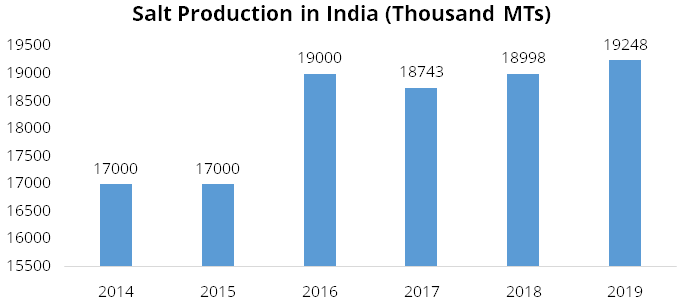
Source: U.S. Geological Survey
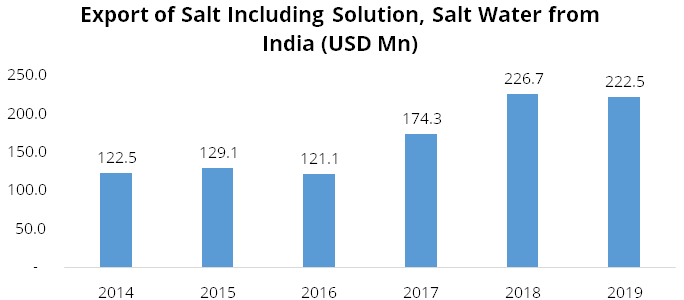
Source: U.S. Geological Survey
Conclusion
Despite short-term slowdown in the economy and impact of covid-19 pandemic, the
long-term outlook remains optimistic for FMCG industry in India. Favourable demographics,
rising disposable income, product premiumisation are some of the factors that may
drive the growth in urban areas. Whereas, increasing farm income, government initiatives
for increasing jobs in rural areas (MGNREGA), direct fund transfers, availability
of small unit packs, etc. are some of the factors that may drive the growth in rural
areas. Other factors which may help the FMCG industry to grow in India are growth
in e-commerce, growth in modern retail, improving supply chains of FMCG players,
new and innovative product launches, promotions and offers, etc.
Source: Company, Staista, IBEF, Euromonitor
Risks & Concerns
Steep increase in competitive pressures: While TCPL ranks among top three in most of its categories, competitive intensity among existing players is on the rise, either via launches or price points. This could lead to short-term margin pressure.
Input price volatility: While the company has strong backend synergistic relationships with vendors, it remains susceptible to raw material price volatility. Ability to pass through is partly a function of competitive intensity; usually pass-through of rising raw material prices is likely to happen with a lag.
Slower than expected shift: Tata Sampann is still a very small brand. So, the primary risk associated with is scaling it up. The other risk is the conversion from unbranded/loose players to branded players especially in the pulses and spices categories.
Economic slowdown: While the bulk of TCPL’s product range is essential in nature, an overall economic slowdown may push consumers into downtrading, which would drive lower value growth than we build in.
Competition from private labels of channel partners: In the foods segments, TCPL is likely to face competition from private labels of Reliance Retail, Avenue Supermarts, Amazon, etc.
Outlook & valuation
TCPL is a flagship company of TATA group; TCPL has a wide geographical reach and has well diversified business. We believe TCPL will continue to drive business well on the back of strong fundamentals, good brand recall, discontinuation of less profitable business and new management personnel. We expect that merger will help in unlock synergies such as expanding distribution reach, product portfolio and operational efficiencies etc. At CMP of Rs. 596 the stock trades at PE of 50x/42x at our FY22E and FY23E EPS estimates. We initiate a Buy on TCPL for long term perspective.
Financial Statement
Profit & Loss statement
| Yr End March (Rs Cr) | 2018 | 2019 | 2020 | 2021E | 2022E | 2023E |
|---|---|---|---|---|---|---|
| Net Sales | 6815.40 | 7251.50 | 9637.40 | 10408.40 | 11553.30 | 12593.10 |
| Growth % | 0.50% | 6.40% | 32.90% | 8.00% | 11.00% | 9.00% |
| Expenditure | ||||||
| Material Cost | 3699.30 | 4007.60 | 5410.70 | 5807.90 | 6412.10 | 6951.40 |
| Employee Cost | 821.40 | 806.30 | 884.80 | 968.00 | 1109.10 | 1234.10 |
| Other Expenses | 1455.80 | 1651.70 | 2049.80 | 2060.90 | 2195.10 | 2354.90 |
| EBITDA | 838.90 | 785.90 | 1292.20 | 1571.70 | 1837.00 | 2052.70 |
| Growth % | 6.00% | -6.30% | 64.40% | 21.60% | 16.90% | 11.70% |
| EBITDA Margin | 12.30% | 10.80% | 13.40% | 15.10% | 15.90% | 16.30% |
| Depreciation & Amortization | 116.00 | 122.60 | 241.70 | 327.50 | 336.10 | 347.60 |
| EBIT | 722.90 | 663.30 | 1050.40 | 1244.20 | 1500.90 | 1705.10 |
| EBIT Margin % | 10.60% | 9.10% | 10.90% | 12.00% | 13.00% | 13.50% |
| Other Income | 94.20 | 157.10 | 111.60 | 111.60 | 111.60 | 111.60 |
| Interest & Finance Charges | 42.80 | 52.50 | 77.90 | 83.30 | 79.90 | 82.90 |
| Profit Before Tax - Before Exceptional | 774.30 | 768.00 | 1084.20 | 1272.50 | 1532.60 | 1783.80 |
| Profit Before Tax | 753.10 | 734.70 | 809.40 | 1272.50 | 1532.60 | 1783.80 |
| Tax Expense | 185.90 | 260.90 | 274.20 | 320.30 | 385.80 | 436.40 |
| Effective Tax rate | 24.00% | 34.00% | 25.30% | 25.20% | 25.20% | 24.50% |
| Exceptional Items | -21.10 | -33.30 | -274.80 | - | - | - |
| Net Profit | 567.30 | 473.80 | 535.20 | 952.20 | 1146.80 | 1347.40 |
| Growth % | 22.30% | -16.50% | 12.90% | 77.90% | 20.40% | 17.50% |
| Net Profit Margin | 8.30% | 6.50% | 5.60% | 9.10% | 9.90% | 10.70% |
| Consolidated Net Profit | 495.60 | 408.20 | 459.80 | 927.20 | 1166.80 | 1397.40 |
| Growth % | 27.20% | -17.60% | 12.60% | 101.70% | 25.80% | 19.80% |
| Net Profit Margin after MI | 7.30% | 5.60% | 4.80% | 8.90% | 10.10% | 11.10% |
Balance Sheet
| Yr End March (Rs Cr) | 2018 | 2019 | 2020 | 2021E | 2022E | 2023E |
|---|---|---|---|---|---|---|
| Share Capital | 63.10 | 63.10 | 92.20 | 92.20 | 92.20 | 92.20 |
| Total Reserves | 6968.50 | 7268.60 | 13722.70 | 14330.40 | 15090.00 | 16093.10 |
| Shareholders' Funds | 8040.60 | 8359.40 | 14907.30 | 15515.00 | 16274.60 | 17277.80 |
| Minority Interest | 1009.00 | 1027.70 | 1092.50 | 1092.50 | 1092.50 | 1092.50 |
| Non Current Liabilities | ||||||
| Long Term Burrowing | 656.00 | 787.20 | 794.70 | 918.60 | 968.60 | 1018.60 |
| Deferred Tax Assets / Liabilities | -0.30 | 87.40 | 286.50 | 286.50 | 286.50 | 286.50 |
| Long Term Provisions | 161.20 | 169.10 | 200.10 | 200.10 | 200.10 | 200.10 |
| Current Liabilities | ||||||
| Short Term Borrowings | 400.20 | 329.70 | 387.80 | 387.80 | 387.80 | 387.80 |
| Trade Payables | 705.70 | 664.90 | 944.00 | 823.80 | 902.50 | 992.30 |
| Other Current Liabilities | 361.30 | 397.90 | 520.80 | 446.90 | 446.90 | 446.90 |
| Short Term Provisions | 129.40 | 77.50 | 126.00 | 126.00 | 126.00 | 126.00 |
| Total Equity & Liabilities | 10460.40 | 10880.70 | 18473.00 | 19010.60 | 19898.90 | 21041.80 |
| Assets | ||||||
| Net Block | 4747.90 | 4861.70 | 11606.00 | 11751.50 | 11915.40 | 12067.80 |
| Non Current Investments | 643.10 | 656.10 | 539.30 | 539.30 | 539.30 | 539.30 |
| Long Term Loans & Advances | 277.60 | 139.70 | 204.80 | 204.80 | 204.80 | 204.80 |
| Current Assets | ||||||
| Currents Investments | 568.50 | 583.20 | 833.60 | 833.60 | 833.60 | 833.60 |
| Inventories | 1448.30 | 1609.90 | 1712.00 | 1784.90 | 1955.50 | 2150.00 |
| Sundry Debtors | 648.30 | 680.60 | 922.40 | 878.70 | 962.70 | 1058.50 |
| Cash and Bank | 1238.10 | 1033.60 | 1621.50 | 1984.30 | 2454.10 | 3154.40 |
| Short Term Loans and Advances | 360.60 | 296.20 | 196.20 | 196.20 | 196.20 | 196.20 |
| Total Assets | 10460.40 | 10880.70 | 18473.00 | 19010.60 | 19898.90 | 21041.80 |
Cash Flow Statement
| Yr End March (Rs Cr) | 2018 | 2019 | 2020 | 2021E | 2022E | 2023E |
|---|---|---|---|---|---|---|
| Profit After Tax | 567.30 | 473.80 | 535.20 | 952.20 | 1146.80 | 1347.40 |
| Depreciation | 116.00 | 122.60 | 241.70 | 327.50 | 336.10 | 347.60 |
| Others | -55.70 | -186.90 | -17.10 | - | - | - |
| Changes in Working Capital | -138.90 | -421.50 | -82.00 | -149.40 | -175.80 | -200.50 |
| Cash From Operating Activities | 355.60 | 209.90 | 1082.20 | 1130.30 | 1307.10 | 1494.50 |
| Purchase of Fixed Assets | -358.80 | -282.30 | -159.60 | -250.00 | -500.00 | -500.00 |
| Free Cash Flows | -3.20 | -72.40 | 922.70 | 880.30 | 807.10 | 994.50 |
| Others | 275.90 | 329.90 | -522.00 | - | - | - |
| Cash Flow from Investing Activities | -74.10 | 73.30 | -672.80 | -250.00 | -500.00 | -500.00 |
| Increase / (Decrease) in Loan Funds | 216.00 | 35.80 | 32.10 | 50.00 | 50.00 | 50.00 |
| Equity Dividend Paid | -211.80 | -215.80 | -221.60 | -285.70 | -321.10 | -285.40 |
| Others | -34.70 | -43.70 | -118.80 | - | - | - |
| Cash from Financing Activities | -30.40 | -223.70 | -308.30 | -294.50 | -337.30 | -294.20 |
| Net Cash Inflow / Outflow | 251.10 | 59.40 | 101.10 | 585.80 | 469.80 | 700.30 |
| Opening Cash & Cash Equivalents | - | 698.20 | 737.50 | 1398.50 | 1984.30 | 2454.10 |
| Closing Cash & Cash Equivalent | 698.20 | 737.50 | 889.30 | 1984.30 | 2454.10 | 3154.40 |
Key Ratios
| Yr End March | 2018 | 2019 | 2020 | 2021E | 2022E | 2023E |
|---|---|---|---|---|---|---|
| Basic EPS | 7.80 | 6.40 | 5.00 | 10.00 | 12.60 | 14.60 |
| Diluted EPS | 7.80 | 6.40 | 5.00 | 10.00 | 12.60 | 14.60 |
| Cash EPS (Rs) | 9.70 | 8.40 | 7.60 | 13.60 | 16.30 | 18.40 |
| DPS | 2.50 | 2.50 | 2.70 | 3.10 | 3.50 | 3.10 |
| Book value (Rs/share) | 127.00 | 132.10 | 161.50 | 168.10 | 176.30 | 187.20 |
| ROCE (%) Post Tax | 7.30% | 5.80% | 6.80% | 6.20% | 7.00% | 7.60% |
| ROE (%) | 6.20% | 4.90% | 3.10% | 6.00% | 7.20% | 8.00% |
| Inventory Days | 77.70 | 77.00 | 62.90 | 61.30 | 59.10 | 59.50 |
| Receivable Days | 33.20 | 33.40 | 30.40 | 31.60 | 29.10 | 29.30 |
| Payable Days | 38.70 | 34.50 | 30.50 | 31.00 | 27.30 | 27.50 |
| PE | 32.90 | 31.40 | 59.10 | 57.90 | 48.00 | 40.90 |
| P/BV | 2.00 | 1.50 | 1.80 | 3.60 | 3.40 | 3.20 |
| EV/EBITDA | 18.60 | 15.80 | 20.10 | 34.60 | 29.40 | 25.60 |
| Dividend Yield (%) | 1.00% | 1.20% | 0.90% | 0.50% | 0.60% | 0.50% |
| P/Sales | 2.40 | 1.80 | 2.80 | 5.30 | 4.80 | 4.40 |
| Net debt/Equity | - | - | - | - | - | - |
| Net Debt/ EBITDA | -0.90 | -0.60 | -0.90 | -0.40 | -0.60 | -1.30 |
| Sales/Net FA (x) | 1.50 | 1.50 | 1.20 | 0.90 | 1.00 | 1.10 |