
Tata Consultancy Services Ltd
IT - Software Services
Tata Consultancy Services Ltd
IT - Software Services
Stock Info
Shareholding Pattern
Price performance
Indexed Stock Performance

Start of multi-year technology transformation cycle
Profile:
Tata Consultancy Services (TCS) is an IT services, consulting and business solutions
organization that has been partnering with many of the world’s largest businesses
in their transformation journeys for over 50 years. TCS offers a consulting-led,
cognitive powered, integrated portfolio of business, technology and engineering
services and solutions. This is delivered through its unique Location Independent
AgileTM delivery model, recognized as a benchmark of excellence in software development.
Investment Rationale:
Robust deal wins and healthy pipeline
Q2 FY21deal wins were strong across products and services. The management indicated
that deal signings were more mid-small sized deals than large deals. Deal wins for
Q2 stood at $8.6 billion, up 24.6% QoQ and up 34.4% YoY. This includes the Phoenix-
Standard Life deal ($2.5bn), which was announced in the earlier quarter.
Strong EBIT margin expansion
TCS delivered 26.2% operating margins in Q2 FY2021, which is an expansion of 220
bps YoY and 260 bps QoQ. Margin improvement was led by cost control initiatives
like discretionary cost cutting in travel, marketing and better onsite mix. We believe
some of these changes are structural in nature and are not going to reverse very
soon, as work from home is here to stay for the long term.
Beginning of multi-year technology transformation cycle
The management believes that they are currently at the start of the first phase
of a multi-year technology transformation cycle. Currently, enterprises are building
a cloud-based foundation; subsequent phases will see new technologies willbe leading
to new business models and differentiated customer experiences.
Structural changes in the IT industry
We believe that to navigate businesses through the current crisis, digitization
and use of technology will be of prime importance. There is high demand for services
like i) digital transformation, ii) cyber security, iii) cloud. The pandemic has
positively impacted the IT industry, with more and more organizations globally having
realized the importance of technology and increased their spending on digital transformation.
Outlook & Valuation
We prefer TCS on account of a strong business model, stable management, strong execution,
sustainable margin; beneficiary of strong vendor consolidation and healthy free
cash flows (FCF) generation. We expect TCS’ revenue and earnings to clock
a CAGR of 9% and 9.7% respectively over FY2021-23E. At CMP of Rs2,650, the stock
is trading at P/E multiple of 25.9X/22.9X on the basis of FY2022E/FY2023E earnings,
which is justified given potential strong earnings growth, leadership in digital
competencies and a strong dividend payout policy.
Consolidated Financial Statements
| Rs in Cr | Net Sales | EBITDA | EBITDAM | PAT | EPS | ROE | P/E | EV/EBITDA |
|---|---|---|---|---|---|---|---|---|
| FY18 | 1,23,104.00 | 32,517.00 | 26.40% | 25,827.00 | 135.21 | 30.10% | 21.50 | 15.41 |
| FY19 | 1,46,463.00 | 39,506.00 | 36.10% | 31,472.00 | 83.93 | 36.10% | 24.90 | 17.97 |
| FY20 | 1,56,949.00 | 42,108.00 | 26.80% | 32,339.00 | 86.24 | 47.30% | 20.50 | 15.54 |
| FY21E | 1,66,738.40 | 45,859.71 | 27.50% | 34,449.99 | 93.11 | 40.20% | 28.46 | 20.56 |
| FY22E | 1,82,774.68 | 50,648.01 | 27.70% | 37,801.70 | 102.17 | 39.20% | 25.94 | 18.29 |
| FY23E | 2,03,491.20 | 56,393.40 | 27.70% | 42,744.76 | 115.53 | 36.60% | 22.94 | 16.10 |
Investment Rationale
Robust deal wins and healthy pipeline
Q2FY21deal wins were strong across products and services. The management indicated
that deal signings were across mid-small sized deals as compared to large deals.
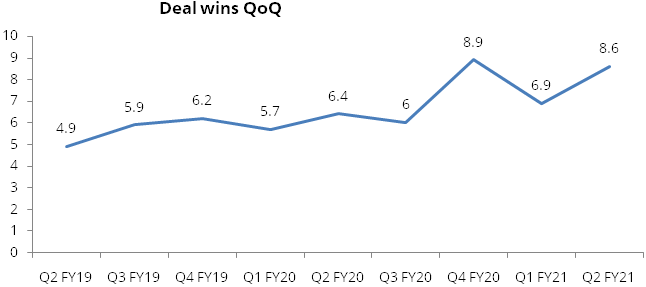
Deal wins for Q2FY21stood at $8.6billion, up 24.6% QoQ and up 34.4% YoY. This includes
the Phoenix- Standard Life deal ($2.5bn), which was announced in the earlier quarter.
Of the total TCV, North America accounted for $2.3 billion among geographies while
segment wise $1.7 billion was from BFSI and $1 billion in retail.
The management indicated that they are seeing healthy deal pipeline and there is no delay in decision making from organisations. We believe TCS is better placed to gain market share as compared to peers, as organisations are looking at vendor consolidation.
The company added two $100 million+ clients to reach 49 such clients. Three clients were added in the US$20 million+ and 44 in the US$1 million+ revenue bucket taking the total to 1076 clients.
| No. of large clients | Q3FY19 | Q4FY19 | Q1FY20 | Q2FY20 | Q3FY20 | Q4FY20 | Q1FY21 | Q2FY21 |
|---|---|---|---|---|---|---|---|---|
| USD1m+ | 996 | 1008 | 1014 | 1032 | 1053 | 1072 | 1066 | 1076 |
| USD5m+ | 519 | 532 | 551 | 554 | 557 | 565 | 564 | 565 |
| USD10m+ | 370 | 371 | 384 | 398 | 395 | 391 | 382 | 386 |
| USD20m+ | 211 | 215 | 219 | 225 | 232 | 240 | 230 | 228 |
| USD50m+ | 99 | 99 | 100 | 101 | 102 | 105 | 100 | 97 |
| USD100m+ | 45 | 44 | 44 | 47 | 47 | 49 | 48 | 49 |
Strong EBIT margin expansion
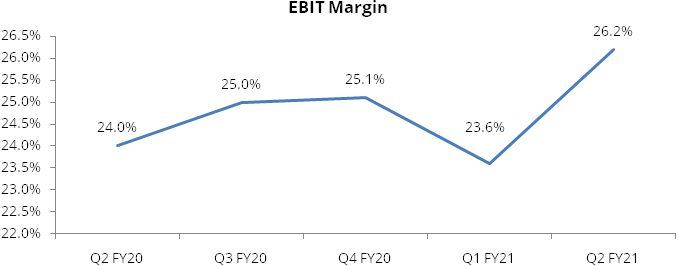
TCS delivered 26.2% operating margins in Q2 FY2021, which is an expansion of 220
bps YoY and 260 bps QoQ. Margin improvement was led by cost control initiatives
like discretionary cost cutting in travel, marketing and better onsite mix. We believe
some of these changes are structural in nature and are not going to reverse very
soon, as work from home is here to stay for the long term.
Beginning of multi-year technology transformation cycle
Management believes that they are currently at the start of the first phase of a
multi-year technology transformation cycle. Currently, enterprises are building
a cloud-based foundation, in subsequent phases will see new technologies will lead
to new business models and differentiated customers’ experiences. TCS’s
investments in research & innovation and in industry specific solutions will
make it a key beneficiary of this secular demand growth in coming years. We believe
TCS will benefit disproportionately due to robust growth in global digital technologies.
Structural changes in the IT industry
We believe that to navigate businesses through the current crisis, digitization
and use of technology will be of prime importance. There is high demand for services
like i) digital transformation, ii) cyber security, iii) cloud.
It is evident that companies that have previously digitized their operations have been more resilient. The pandemic has positively impacted the IT industry, with more organizations globally having realized the importance of technology and increased their spending on digital transformation. Consequently, in the medium to long term, it is very likely that businesses will continue to spend on technology related initiatives with a greater focus on automation, remote working, cloud-based applications, optimization of legacy technology costs, etc. Several sectors are also seeking technology-based solutions immediately to tackle the health and economic crises – notably in healthcare, life sciences, banking, telecommunications and essential retail.
On the cost side, work from home, reduction in discretionary spends like branding, marketing, re-negotiation of rents and no travel costs are improving margins. Voluntary attrition rate has been at a multi-quarter low at 8%.
Strong partnerships to drive growth-
Below are key partnerships that TCS has successfully signed up:
Partnership with B3i to Launch Innovative Blockchain Solutions for the Insurance Industry: TCS has partnered with B3i Services AG, a global industry-led blockchain initiative, to design, develop and launch ecosystem innovations based on distributed ledger technology (DLT) for the insurance industry. This partnership leverages TCS’ innovation capabilities and B3i’s industry-leading production DLT platform, to accelerate the digitization of insurance for faster and more efficient delivery of tailored solutions to support risk managers, insurers, brokers, reinsurers, and industry service providers.
AG Selects TCS as a Strategic Partner for its Digital Transformation- TCS has been selected as a strategic partner for managed IT services by AG, a leading Belgian insurer, to help enhance the latter’s digital channels and modernize its IT systems, leveraging TCS’ Machine First™ approach. TCS will also creatively leverage its investments in research and innovation around technologies like IoT, big data, blockchain, machine learning and AI to help AG reimagine products, processes and services.
Equinor Collaborates with TCS to accelerate its Transformation into a Digital Energy Company- TCS has been selected as a strategic partner by Equinor, the Norway-headquartered global energy company, to accelerate its digitalization journey and help realize its vision of becoming a digital energy company. TCS will help Equinor to achieve Data Democratization across its core operations and harness the power of machine learning and Leverage Advanced Analytics to help Equinor achieve its growth and transformation objectives.
Volt partners with TCS to Expand Payment Offerings- TCS announced that Volt, Australia's first neobank, has partnered with TCS to power Volt 2.0, its next-generation banking as a Service (BaaS) platform. Set to launch in 2021, Volt 2.0 will leverage TCS BaNCS™, a global payments solution, to expand the bank's offerings to include NPP, BPAY and DE, enabling full-service banking capabilities for all its customers. Volt will work closely with TCS to incorporate the real-time capabilities of TCS BaNCS for payments, along with API-based access to open banking components that are not dependent on traditional legacy structures. The end-to-end solution provides full back-end support, the flexibility to integrate leading technologies, and connect with an extended ecosystem to offer innovative new products and services.
Institutionalized Secure Borderless Workspaces (SBWS) model:
TCS had adopted the SBWS model during Q4FY2020 as it makes physical location irrelevant
because work from home has replaced in-person interactions with virtual collaboration.
This virtualization blurs the traditional divide between onsite and offshore. Management
foresees that the virtualization of many activities with SBWS will reduce the need
for travel and co-location even further, results in savings cost. Also, adoption
of SBWS model will help at societal level, as young people will eventually have
the option of pursuing their careers in TCS without uprooting themselves from their
home towns as long as they have good connectivity. Over the past few months, TCS
has also been helping its clients adapt to this new working model using SBWS™.
This product has now become a significant part of its go-to-market discussion. The
company has also been strengthening to cover broad range of activities, including
- customer engagement, on boarding of new projects, etc.
Financials
Financial performance
We expect Revenue / EBIT / PAT to grow at 9% / 10.3% / 9.7% CAGR for FY20-23 E;
Revenue growth will be led by large deal wins, increased adoption of cloud, cyber
security and digital transformation. We expect margins to improve from 24.6% in
FY20 to 25.4% in FY23E, led by cost control initiatives and rupee depreciation.
Revenue by geographic segments (% of Revenue)
| Particulars | FY 2016 | FY 2017 | FY 2018 | FY 2019 | FY 2020 |
|---|---|---|---|---|---|
| Americas | 55.2% | 56.0% | 53.7% | 53.0% | 52.2% |
| Europe | 26.8% | 25.5% | 27.7% | 29.7% | 30.6% |
| India | 6.2% | 6.3% | 6.4% | 5.7% | 5.7% |
| Others | 11.8% | 12.2% | 12.1% | 11.6% | 11.4% |
Revenues by Verticals
| Particulars | FY 2016 | FY 2017 | FY 2018 | FY 2019 | FY 2020 |
|---|---|---|---|---|---|
| BFSI | 40.6% | 40.3% | 39.3% | 39.6% | 38.9% |
| Communication, Media &Technology (CMT) | 16.6% | 16.5% | 17.2% | 16.3% | 16.6% |
| Retail & Consumer Business | 17.7% | 17.3% | 17.1% | 17.2% | 16.7% |
| Manufacturing | 10.0% | 10.6% | 10.9% | 10.7% | 10.5% |
| Others | 15.0% | 15.3% | 15.5% | 16.2% | 17.3% |
Currency mix (% of revenue)
| Particulars | FY 2016 | FY 2017 | FY 2018 | FY 2019 | FY 2020 |
|---|---|---|---|---|---|
| USD | 57.0% | 57.0% | 54.6% | 53.6% | 53.0% |
| GBP | 14.0% | 12.1% | 12.4% | 13.9% | 14.0% |
| EUR | 7.7% | 8.0% | 9.4% | 10.1% | 10.7% |
| OTHERS | 21.3% | 22.9% | 23.6% | 22.4% | 22.3% |
Margins by verticals
| Particulars | FY 2016 | FY 2017 | FY 2018 | FY 2019 | FY 2020 |
|---|---|---|---|---|---|
| BFSI | 29.0 | 27.6 | 26.9 | 27.8 | 27.7 |
| Communication, Media &Technology (CMT) | 28.6 | 28.4 | 27.4 | 27.8 | 29.7 |
| Retail & Consumer Business | 27.6 | 28.1 | 26.5 | 27.3 | 26.1 |
| Manufacturing | 26.7 | 28.6 | 27.7 | 27.5 | 27.0 |
| Others | 26.1 | 23.7 | 22.7 | 23.4 | 22.6 |
Forex Sensitivity Analysis
| Particulars (in cr) | 2021E | 2022E | 2023E |
|---|---|---|---|
| Bear Case | |||
| $ rate assumptions | 72.0 | 73.5 | 74.0 |
| Revenue | 1,64,454.3 | 1,81,539.7 | 2,00,778.0 |
| EPS | 89.3 | 100.0 | 110.8 |
| Bull Case | |||
| $ rate assumptions | 73.5 | 74.5 | 76.0 |
| Revenue | 1,67,880.4 | 1,84,009.6 | 2,06,204.4 |
| EPS | 95.0 | 104.3 | 120.2 |
| Base Case | |||
| $ rate assumptions | 73.0 | 74.0 | 75.0 |
| Revenue | 1,66,738.4 | 1,82,774.7 | 2,03,491.2 |
| EPS | 93.1 | 102.2 | 115.5 |
Industry
Software and computing technology is transforming businesses in every industry around the world in a profound and fundamental way. The continued reduction in the unit cost of hardware, the explosion of network bandwidth, advanced software technologies and technology-enabled services are fueling the rapid digitization of business processes and information. The digital revolution is cascading across industries, redefining customer expectations, automating core processes and enabling software-based disruptive market offerings and business models. This disruption is characterized by personalized user experiences, innovative products and services, increased business agility, extreme cost performance and a disintermediation of the supply chain.
Leveraging technologies and models of the digital era to both extend the value of existing investments and, in parallel, transform and future-proof businesses, is increasingly becoming a top strategic imperative for business leaders.
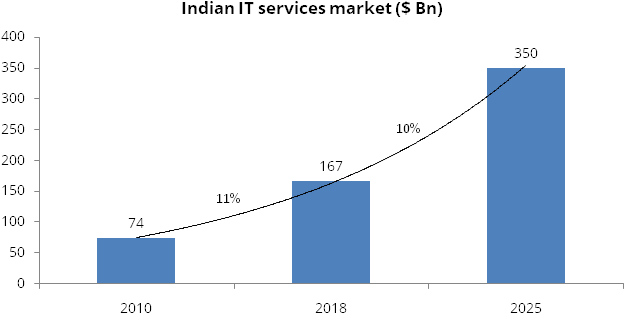
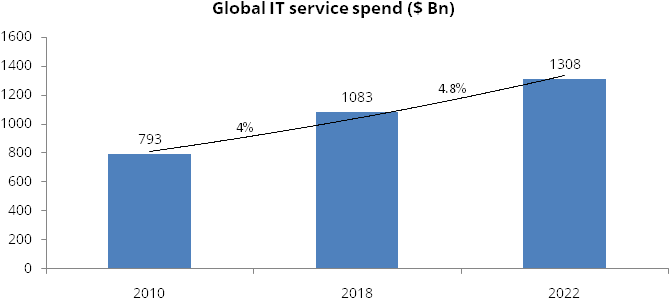
The Indian IT services market is expected to grow at 10% CAGR over 2019-2025 and generate revenues of $ 350 billion, while global IT services spend is expected to grow at 4.8% CAGR over 2019-2022 according to Gartner report on Trends, Disruptors and the Future of Business & IT Services.
The fast pace of technology change and the need for technology professionals who are highly skilled in both traditional and digital technology areas are driving businesses to rely on third parties to realize their business transformation. Several new technology solutions and service providers have emerged over the years, offering different models for clients to consume their solutions and service offerings such as data analytics companies, software-as-a-service businesses, digital design boutiques, and specialty business process management firms.
The COVID-19 pandemic has disrupted demand and supply chains across industries, negatively impacting the business of companies. However, it is becoming evident that companies that have previously digitized their operations have been more resilient. Consequently, in the medium to long term, it is very likely that businesses will continue to spend on technologyrelated initiatives with a greater focus on automation, remote working, cloud-based applications, optimization of legacy technology costs, etc. Several sectors are also seeking technology-based solutions immediately to tackle the health and economic crises – notably in healthcare, life sciences, banking, telecommunications and essential retail.
Peer comparison:
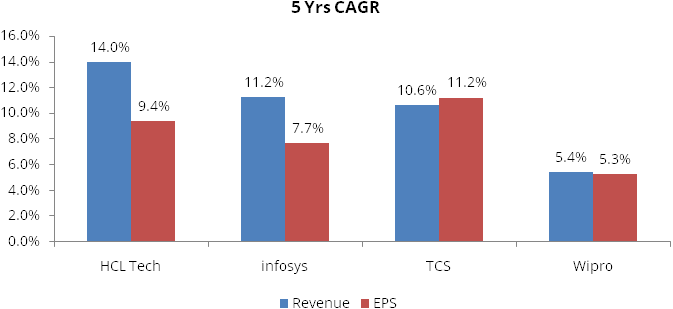
Below tables showcases last 5 years financials and valuation for top 4 IT companies.
Below chart shows that TCS has the highest 5-year CAGR EPS growth among peers at 11.2%. It has consistently outperformed its peers w.r.t. margins and profitability.
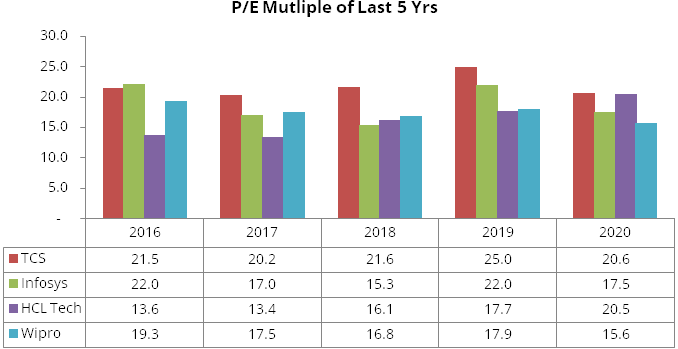
Below chart shows that TCS clearly stands out amongst peers, as it has always traded as premium valuation.
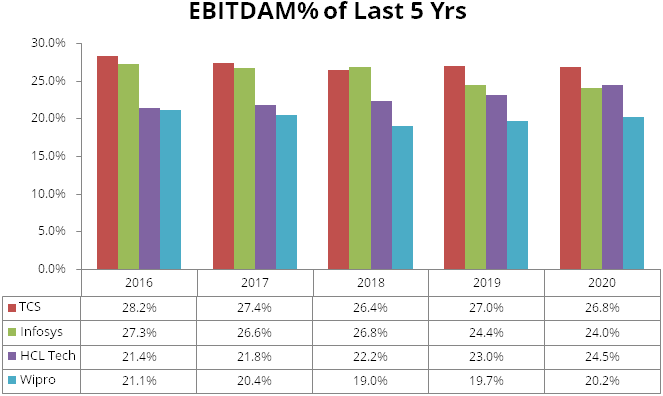
Below chart shows that TCS has consistently delivered better margins than its peers.
Covid-19 impact on the IT sector
Covid-19 has provided an opportunity for IT vendors to become more resilient and
innovative. In the post-coronavirus world, businesses will undergo a transition,
and the biggest gainer could be the IT industry. Many IT companies have digitised
all their processes and invested in cutting edge infrastructure and collaboration
tools to support their location-independent agile delivery models and secure borderless
workspaces. Businesses, mainly those in the services sector like banking & other
financial services, education, retail, healthcare, food & grocery delivery,
will further embrace technology and automation to better leverage growth. Many organisations,
through the rapid adoption of digital transformation, have already embraced cloud
and mobility trends. The expanding IT industry, along with the rising trend of digitalisation,
is one of the key factors that will continue to drive the growth of IT companies.
As the ‘work from home’scenario is beginning to become the new normal,
more workload will be migrated to the cloud to ensure that businesses can function
as usual. Almost all sectors will move towards digitisation and automation, and
going forward, digitisation, cloud computing, machine learning, and artificial intelligence
will dominate the technology space.
Risks & Concerns
- Foreign currency exposure: Foreign currency forwards and options contracts are entered into to mitigate the risk of changes in exchange rates on foreign currency exposures.
- Global economic recession: Clients’ business operations may be negatively impacted due to the economic downturn – resulting in postponement, termination, suspension of some ongoing projects and / or reduced demand for services and solutions.
- Cyber Security and Data privacy breach: Due to large number of employees working remotely, exposure to cyber security and data privacy breach incidents has increased.
- Legislation and Regulatory compliance: Government may enact restrictive legislation that could limit companies in those countries from outsourcing work.
Outlook & valuation
Outlook &Valuation
We prefer TCS on account of a strong business model, stable management, strong execution,
sustainable margin; beneficiary of strong vendor consolidation and healthy free
cash flows (FCF) generation.
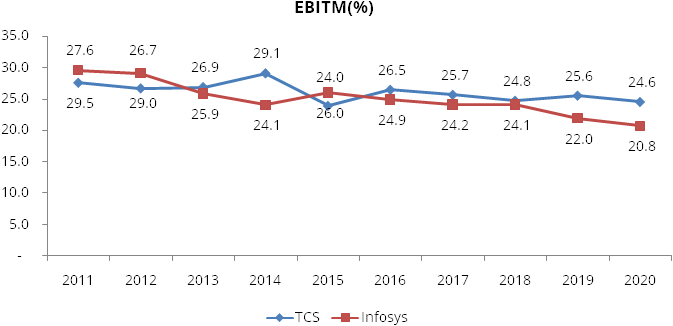
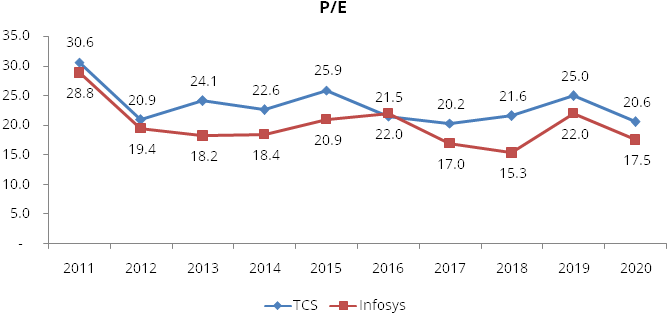
TCS has always outperformed peers in past w.r.t. margins and growth. This has led
to better perception and valuation to TCS as compared to its peers. In below table
of EBITM%, we can see that TCS margins are higher than Infosys in past 7 out of
10 years. While in P/E table, TCS is trading at higher valuation parameter in 9
out of last 10 years.
We believe that the pandemic has become the catalyst with strong acceleration of tech spending on digital transformation. With an increase in adoption of online solutions across verticals, recovery in BFSI and retail, strong deal wins and anticipation of start of multiyear technology transformation cycle, we expect TCS’ revenue and earnings would clock a CAGR of 9%/ 9.7%over FY2021-23E. At CMP of Rs 2,650, the stock is trading at P/E multiple of 25.9X/22.9X on the basis of FY2022E/FY2023E earnings, which is justified given potential strong earnings growth, leadership in digital competencies and a strong dividend payout policy.
Financial Statement
Profit & Loss statement
| Yr End March (Rs Cr) | FY18 | FY19 | FY20 | FY21E | FY22E | FY23E |
|---|---|---|---|---|---|---|
| Net Sales | 123104.00 | 146463.00 | 156949.00 | 166738.40 | 182774.70 | 203491.20 |
| Growth % | 19.00% | 7.20% | 6.20% | 9.60% | 11.30% | |
| Expenditure: | ||||||
| Raw Material | 85.00 | 40.00 | 18.00 | 16.70 | 18.30 | 20.30 |
| Employee Costs | 66396.00 | 78246.00 | 85952.00 | 90348.90 | 98843.40 | 109635.10 |
| Other Expenses | 24106.00 | 28671.00 | 28871.00 | 30513.10 | 33265.00 | 37442.40 |
| EBITDA | 32517.00 | 39506.00 | 42108.00 | 45859.70 | 50648.00 | 56393.40 |
| Growth % | 21.50% | 6.60% | 8.90% | 10.40% | 11.30% | |
| EBITDA Margin % | 26.40% | 27.00% | 26.80% | 27.50% | 27.70% | 27.70% |
| Depreciation | 2014.00 | 2056.00 | 3529.00 | 3623.80 | 4138.80 | 4691.50 |
| EBIT | 30503.00 | 37450.00 | 38579.00 | 42235.90 | 46509.20 | 51701.90 |
| EBIT Margin % | 24.80% | 25.60% | 24.60% | 25.30% | 25.40% | 25.40% |
| Other Income | 3642.00 | 4311.00 | 4592.00 | 4217.80 | 4360.30 | 5680.30 |
| Interest | 52.00 | 198.00 | 924.00 | 924.00 | 924.00 | 924.00 |
| PBT | 34093.00 | 41563.00 | 42247.00 | 45529.60 | 49945.60 | 56458.20 |
| Tax | 8212.00 | 10001.00 | 9801.00 | 10972.60 | 12036.90 | 13606.40 |
| Effective Tax Rate % | 24.10% | 24.10% | 23.20% | 24.10% | 24.10% | 24.10% |
| Extraordinary Items | - | - | - | - | - | - |
| Net Profit | 25827.00 | 31472.00 | 32339.00 | 34450.00 | 37801.70 | 42744.80 |
| Growth % | 21.90% | 2.80% | 6.50% | 9.70% | 13.10% | |
| PAT Margin % | 21.00% | 21.50% | 20.60% | 20.70% | 20.70% | 21.00% |
| Reported PAT | 25827.00 | 31472.00 | 32339.00 | 34450.00 | 37801.70 | 42744.80 |
| Growth % | 21.90% | 2.80% | 6.50% | 9.70% | 13.10% |
Balance Sheet
| Yr End March (Rs Cr) | FY18 | FY19 | FY20 | FY21E | FY22E | FY23E |
|---|---|---|---|---|---|---|
| Share Capital | 191.00 | 375.00 | 375.00 | 370.00 | 370.00 | 370.00 |
| Reserves & Surplus | 84937.00 | 89071.00 | 83751.00 | 86698.50 | 105599.30 | 126971.70 |
| Net Worth | 85128.00 | 89446.00 | 84126.00 | 87068.50 | 105969.30 | 127341.70 |
| Minority Interest | 402.00 | 453.00 | 623.00 | 623.00 | 623.00 | 623.00 |
| Non Current Liabilities | ||||||
| Long Term Borrowings | 54.00 | - | - | - | - | - |
| Deffered Tax Liabilities | -2279.00 | -1614.00 | -2049.00 | -3064.00 | -3064.00 | -3064.00 |
| Long Term Provisions | 316.00 | 556.00 | 643.00 | 643.00 | 643.00 | 643.00 |
| Current Liabilities | ||||||
| Short Term Borrowings | 181.00 | - | - | - | - | - |
| Trade Payables | 5094.00 | 6292.00 | 6740.00 | 6651.10 | 7181.80 | 7937.00 |
| Other Current Liabilities | 8874.00 | 10530.00 | 13566.00 | 13566.00 | 13566.00 | 13566.00 |
| Short Term Provisions | 3679.00 | 5262.00 | 6754.00 | 6754.00 | 6754.00 | 6754.00 |
| Total Equity & Liabilities | 102847.00 | 112287.00 | 118071.00 | 119909.60 | 139341.10 | 161468.70 |
| Assets: | ||||||
| Net Block | 11973.00 | 12290.00 | 20928.00 | 21804.20 | 22365.40 | 22573.90 |
| Non Current Investments | 301.00 | 239.00 | 216.00 | 216.00 | 216.00 | 216.00 |
| Long Term Loans & Advances | 6991.00 | 5188.00 | 3480.00 | 3480.00 | 3480.00 | 3480.00 |
| Current Assets | ||||||
| Current Investmets | 35707.00 | 29091.00 | 26140.00 | 26140.00 | 26140.00 | 26140.00 |
| Inventories | 26.00 | 10.00 | 5.00 | 8.90 | 9.60 | 10.60 |
| Sundry Debtors | 24943.00 | 27346.00 | 30532.00 | 29708.30 | 32078.60 | 35451.80 |
| Cash & Bank Balance | 7161.00 | 12848.00 | 9666.00 | 11448.30 | 27947.60 | 46492.40 |
| Loans & Advance | 3647.00 | 13553.00 | 13220.00 | 13220.00 | 13220.00 | 13220.00 |
| Total Assets | 102847.00 | 112287.00 | 118071.00 | 119909.60 | 139341.10 | 161468.70 |
Cash Flow Statement
| Yr End March (Rs Cr) | FY18 | FY19 | FY20 | FY21E | FY22E | FY23E |
|---|---|---|---|---|---|---|
| PAT | 25827.00 | 31472.00 | 32339.00 | 34450.00 | 37801.70 | 42744.80 |
| Depreciation | 2014.00 | 2056.00 | 3529.00 | 3623.80 | 4138.80 | 4691.50 |
| Other non cash charges | -2565.00 | -2766.00 | 1168.00 | - | - | - |
| Changes in Working Capital | -209.00 | -2169.00 | -4667.00 | 730.90 | -1840.30 | -2619.00 |
| Cash Flow From Operations | 25067.00 | 28593.00 | 32369.00 | 38804.80 | 40100.10 | 44817.20 |
| Capital Expenditure | -1862.00 | -2231.00 | -3249.00 | -4500.00 | -4700.00 | -4900.00 |
| Free Cash Flow | 23205.00 | 26362.00 | 29120.00 | 34304.80 | 35400.10 | 39917.20 |
| Others | 4748.00 | 3827.00 | 11814.00 | - | - | - |
| Cash Flow From Investments | 2886.00 | 1596.00 | 8565.00 | -4500.00 | -4700.00 | -4900.00 |
| Equity Capital Raised / (Buyback) | - | - | - | -16000.00 | - | - |
| Loans avialed or (repaid) | -43.00 | -194.00 | -1062.00 | - | - | - |
| Dividend Paid (incl tax) | -10760.00 | -11424.00 | -37634.00 | -15502.50 | -18900.90 | -21372.40 |
| Others | -16082.00 | -16279.00 | -1219.00 | - | - | - |
| Cash Flow From Financing | -26885.00 | -27897.00 | -39915.00 | -31502.50 | -18900.90 | -21372.40 |
| Net Change in Cash | 1068.00 | 2292.00 | 1019.00 | 2802.30 | 16499.30 | 18544.90 |
| Cash at the beginning of the year | 3597.00 | 4883.00 | 7224.00 | 8646.00 | 11448.30 | 27947.60 |
| Cash at the end of the year | 4665.00 | 7175.00 | 8243.00 | 11448.30 | 27947.60 | 46492.40 |
Key Ratios
| Yr End March | FY18 | FY19 | FY20 | FY21E | FY22E | FY23E |
|---|---|---|---|---|---|---|
| EPS (Rs) Core | 135.20 | 83.90 | 86.20 | 93.10 | 102.20 | 115.50 |
| EPS (Rs) Reported | 135.20 | 83.90 | 86.20 | 93.10 | 102.20 | 115.50 |
| DPS (Rs) | 50.00 | 30.00 | 73.00 | 41.90 | 51.10 | 57.80 |
| BVPS (Rs) | 223.10 | 238.00 | 222.20 | 235.30 | 286.40 | 344.20 |
| ROCE % (Post Tax) | 30.20 | 36.30 | 38.20 | 41.20 | 40.00 | 37.30 |
| ROE % | 30.10 | 36.10 | 37.30 | 40.20 | 39.20 | 36.60 |
| Inventory Days | 0.07 | 0.04 | 0.02 | 0.02 | 0.02 | 0.02 |
| Sundry Debtors Days | 70.50 | 65.20 | 67.30 | 67.00 | 67.00 | 67.00 |
| Trade Payble Days | 14.80 | 14.20 | 15.20 | 15.00 | 15.00 | 15.00 |
| Adjusted P/E (X) | 21.60 | 25.00 | 20.60 | 28.50 | 25.90 | 22.90 |
| P/BV(X) | 6.40 | 8.40 | 8.20 | 11.30 | 9.30 | 7.70 |
| EV/EBITDA (X) | 15.40 | 18.00 | 15.50 | 20.60 | 18.30 | 16.10 |
| Dividend Yield (%) | 3.50 | 1.50 | 4.00 | 1.60 | 1.90 | 2.20 |
| M Cap/Sales (X) | 4.40 | 5.10 | 4.40 | 5.90 | 5.40 | 4.80 |
| Net Debt/Equity (X) | - | - | - | - | - | - |
| Net Debt/EBITDA (X) | -1.30 | -1.10 | -0.90 | -0.80 | -1.10 | -1.30 |