
Tarsons Products Ltd
Plastic Products
Tarsons Products Ltd
Plastic Products
Stock Info
Shareholding Pattern
Price performance
Indexed Stock Performance
Leading player in Labware Manufacturing
Tarsons Products Limited is an Indian labware company engaged in the designing, development, manufacturing and marketing of consumables, reusables and others including benchtop equipment, used in various laboratories across research organizations, academia institutes, pharmaceutical companies, Contract Research Organizations (CROs), Diagnostic companies and hospitals.
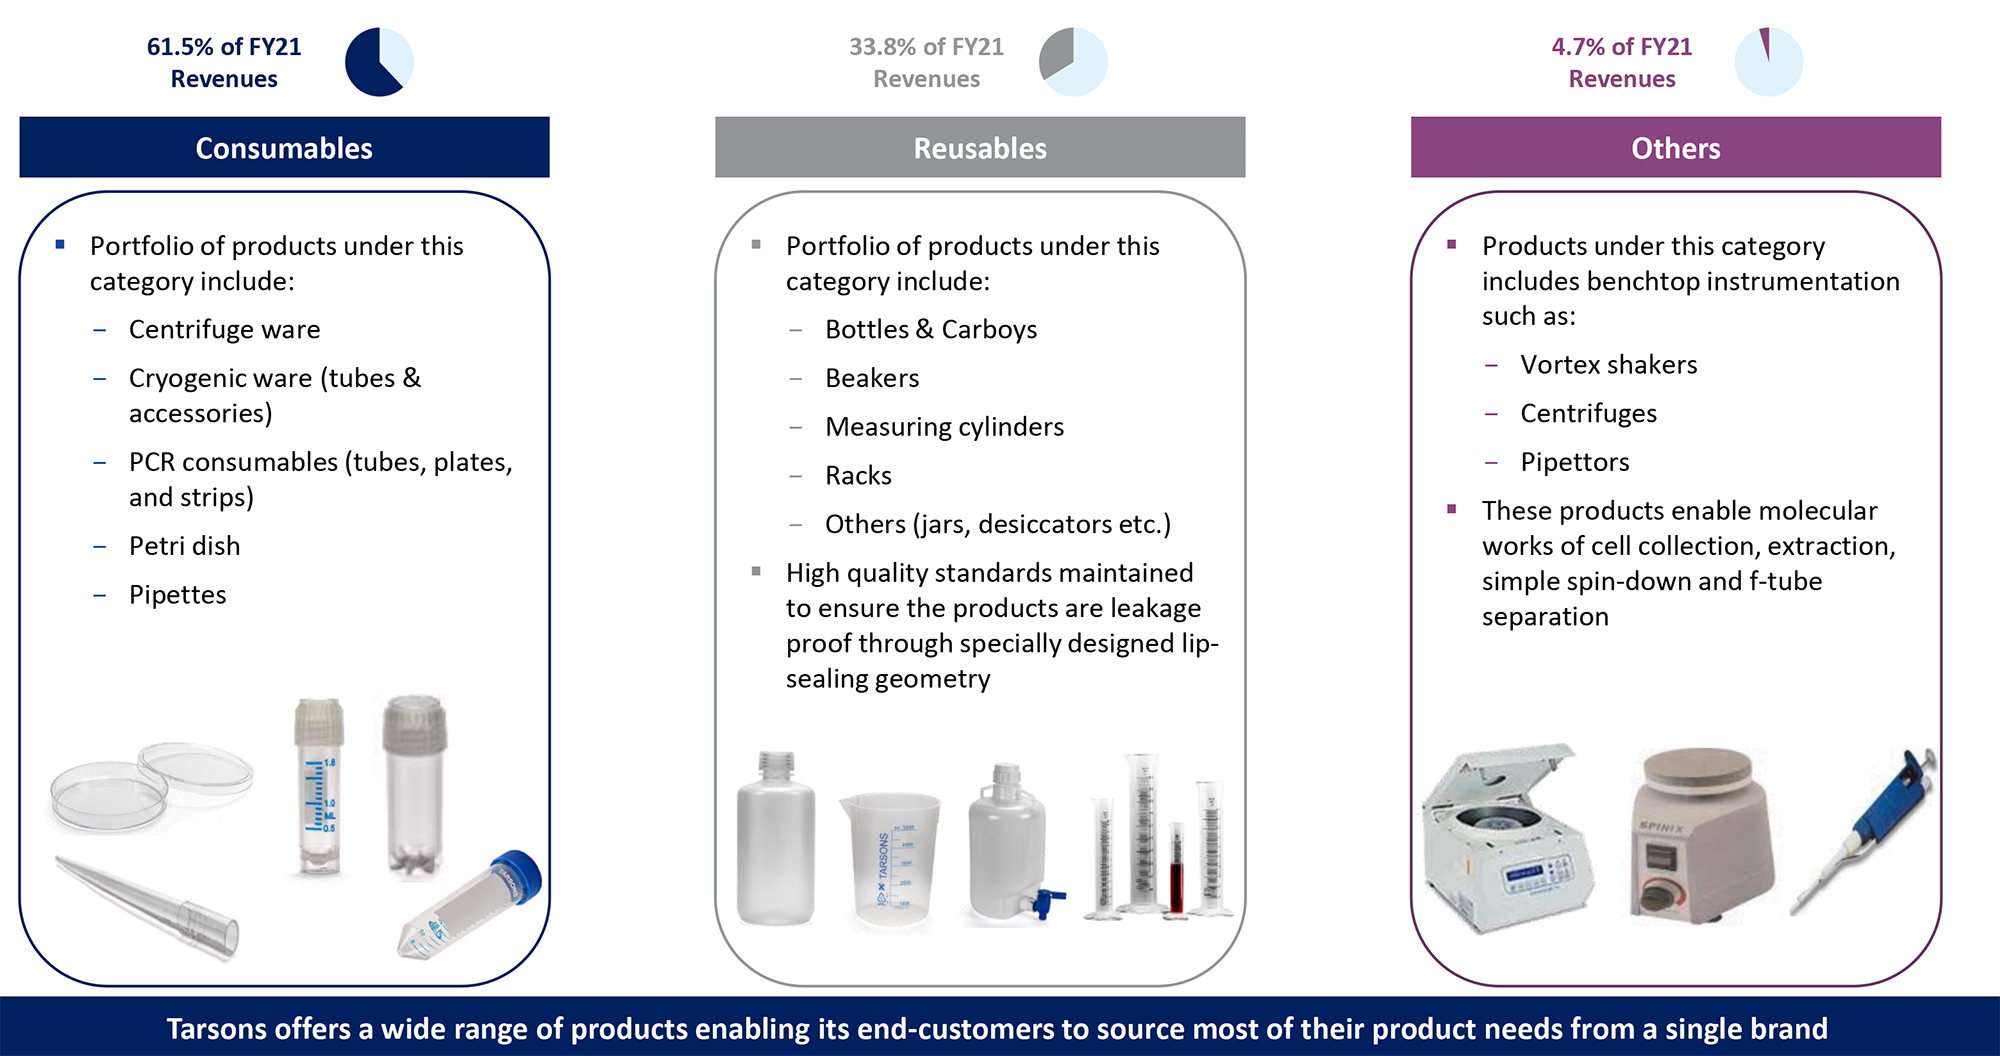
Their product portfolio is classified into 3 categories: Consumable, Reusable & Others
- Consumables includes products such as centrifuge ware, cryogenic ware, liquid handling, PCR consumables and petri dish, transfer pipettes and others.
- Reusables includes products such as bottles, carboys, beakers, measuring cylinders and tube racks.
- Others includes benchtop instrumentation such as vortex shakers, centrifuges pipettors and others. It has a diversified product portfolio with over 1,700 SKUs across 300 products Company is one of the leading Indian companies in terms of revenue in the plastic labware market in India.
They have over 36 years of experience in life sciences through which they gained expertise in the production of a wide range of labware products. Company have received CE-IVD certificate for their products such as micro and macro tips, cryo vials and centrifuge tubes.
Company supplies their products to over 40 countries across both developed and emerging markets through a blend of branded and ODM sales.
Consolidated Financial Statements
| Rs in Cr | Net Sales | EBITDA | EBITDAM | PAT | EPS | ROE | P/E | EV/EBITDA |
|---|---|---|---|---|---|---|---|---|
| FY19 | 178.75 | 71.67 | 40.00% | 38.96 | 2029.06 | 29.00% | 0.00 | 0.89 |
| FY20 | 175.90 | 69.25 | 39.00% | 40.53 | 2026.55 | 21.00% | 0.00 | 0.14 |
| FY21E | 228.91 | 103.44 | 45.00% | 68.87 | 13.52 | 28.00% | 57.69 | 38.71 |
| FY22E | 274.80 | 133.28 | 49.00% | 85.59 | 16.09 | 19.00% | 48.49 | 30.80 |
| FY23E | 331.90 | 165.94 | 50.00% | 110.74 | 20.81 | 20.00% | 37.48 | 24.40 |
Investment Rationale
Leading supplier to life sciences sector with strong brand visibility:
In the year 2020, Tarsons had a market share of 12% of the labware market in India.
Their end customers associate the brand ‘Tarsons’ with
quality labware and benchtop equipment that incorporates quality, reliability and
value.
Tarsons ‘PUREPACK™’ tips are individually packed to ensure sterility for each pipetting cycle. Some of their key products such as liquid handling ware, centrifuge ware and cryogenics are identified by their brand names including Maxipense, Spinwin, Cryochill, respectively. These brand names have gained prominence over the last few years and recognized by the scientific community in India.
Diverse range of Labware products:
Tarsons is among the Top-3 labware manufacturing companies in India, providing an
extensive range of laboratory consumables, reusables and others
product categories. With their expertise in precision manufacturing technologies,
they have developed a diverse range of labware products such as pipette tips, petri
dish, centrifuge tubes, cryo vials, transfer pipettes, bottles, carboys, measuring
cylinder, desiccators, minicoolers, cryobox and test tube racks. As of June 30,
2021, they had a diversified product portfolio with over 1,700 SKUs products across
300 distinct products.
They have also developed customized products to suit specific requirements of their customers. They manufactured Ria vials for a CRO in India and PCR tube and strips for a diagnostics company in India, customized to their testing kit. They also manufactured a custom heavy duty bottle with capacity of 5 litres for a customer in Israel.
Wide geographic reach through with strong distribution network:
The company also has a comprehensive pan India distribution network with over 25-year
long relationships with the top 10 distributors and has sold its products to over
40 countries via 45+ distributors.
Their distribution network across India comprises over 141 authorized distributors as at June 30, 2021. Most of their key distribution partners have been associated with them for more than the last 2 decades. One of the very few players to have global reach
For the 3 months ended June 30, 2021 and June 30, 2020 and in Fiscals 2021, 2020 and 2019, revenue generated from sales through their Top-10 distributors represented 37.45%, 41.95%, 55.90%, 54.80% and 59.70% of the revenue from operations, respectively.
Increasing Global Footprint:
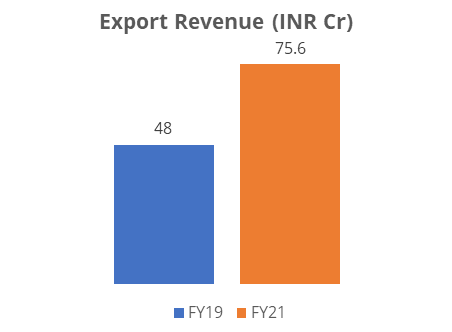
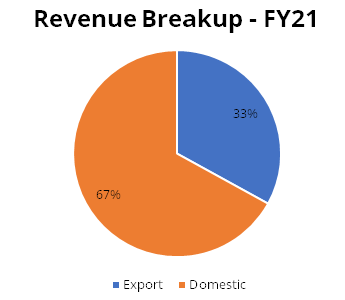
Over the last few years, international business has been a key contributor to the
growth of the Company. In order to serve its existing customer base as well as to
secure new direct end customers, thereby expanding the reach of the products to
new markets, TPL intends to expand its distribution network globally to increase
its share.
Long-Standing Relationships with Customers:
Company caters to a diverse range of end customers across various sectors which
include research organizations, academic institutions, pharmaceutical companies,
CROs, diagnostic companies, and hospitals.
Some of the end customers include customers such as Indian Institute of Chemical Technology, National Centre for Biological Sciences across academic institutes and research organizations;
Dr Reddy's Laboratories, Enzene Biosciences across pharmaceutical sectors; Syngene International, Veeda Clinical Research across CROs
Molbio Diagnostics, Agappe Diagnostic, Metropolis Healthcare, Dr. Lal Path Labs, Mylab Life Solutions across other sectors such as diagnostics.
They distribute the products to these end customers on a pan-India basis through their authorised distributors.

The company is focused on strengthening its customer relationships through various measures like regular feedback on quality and cost, maintaining industry leading standards, customization of products and so on.
Well-Equipped & Automated Manufacturing Facilities:
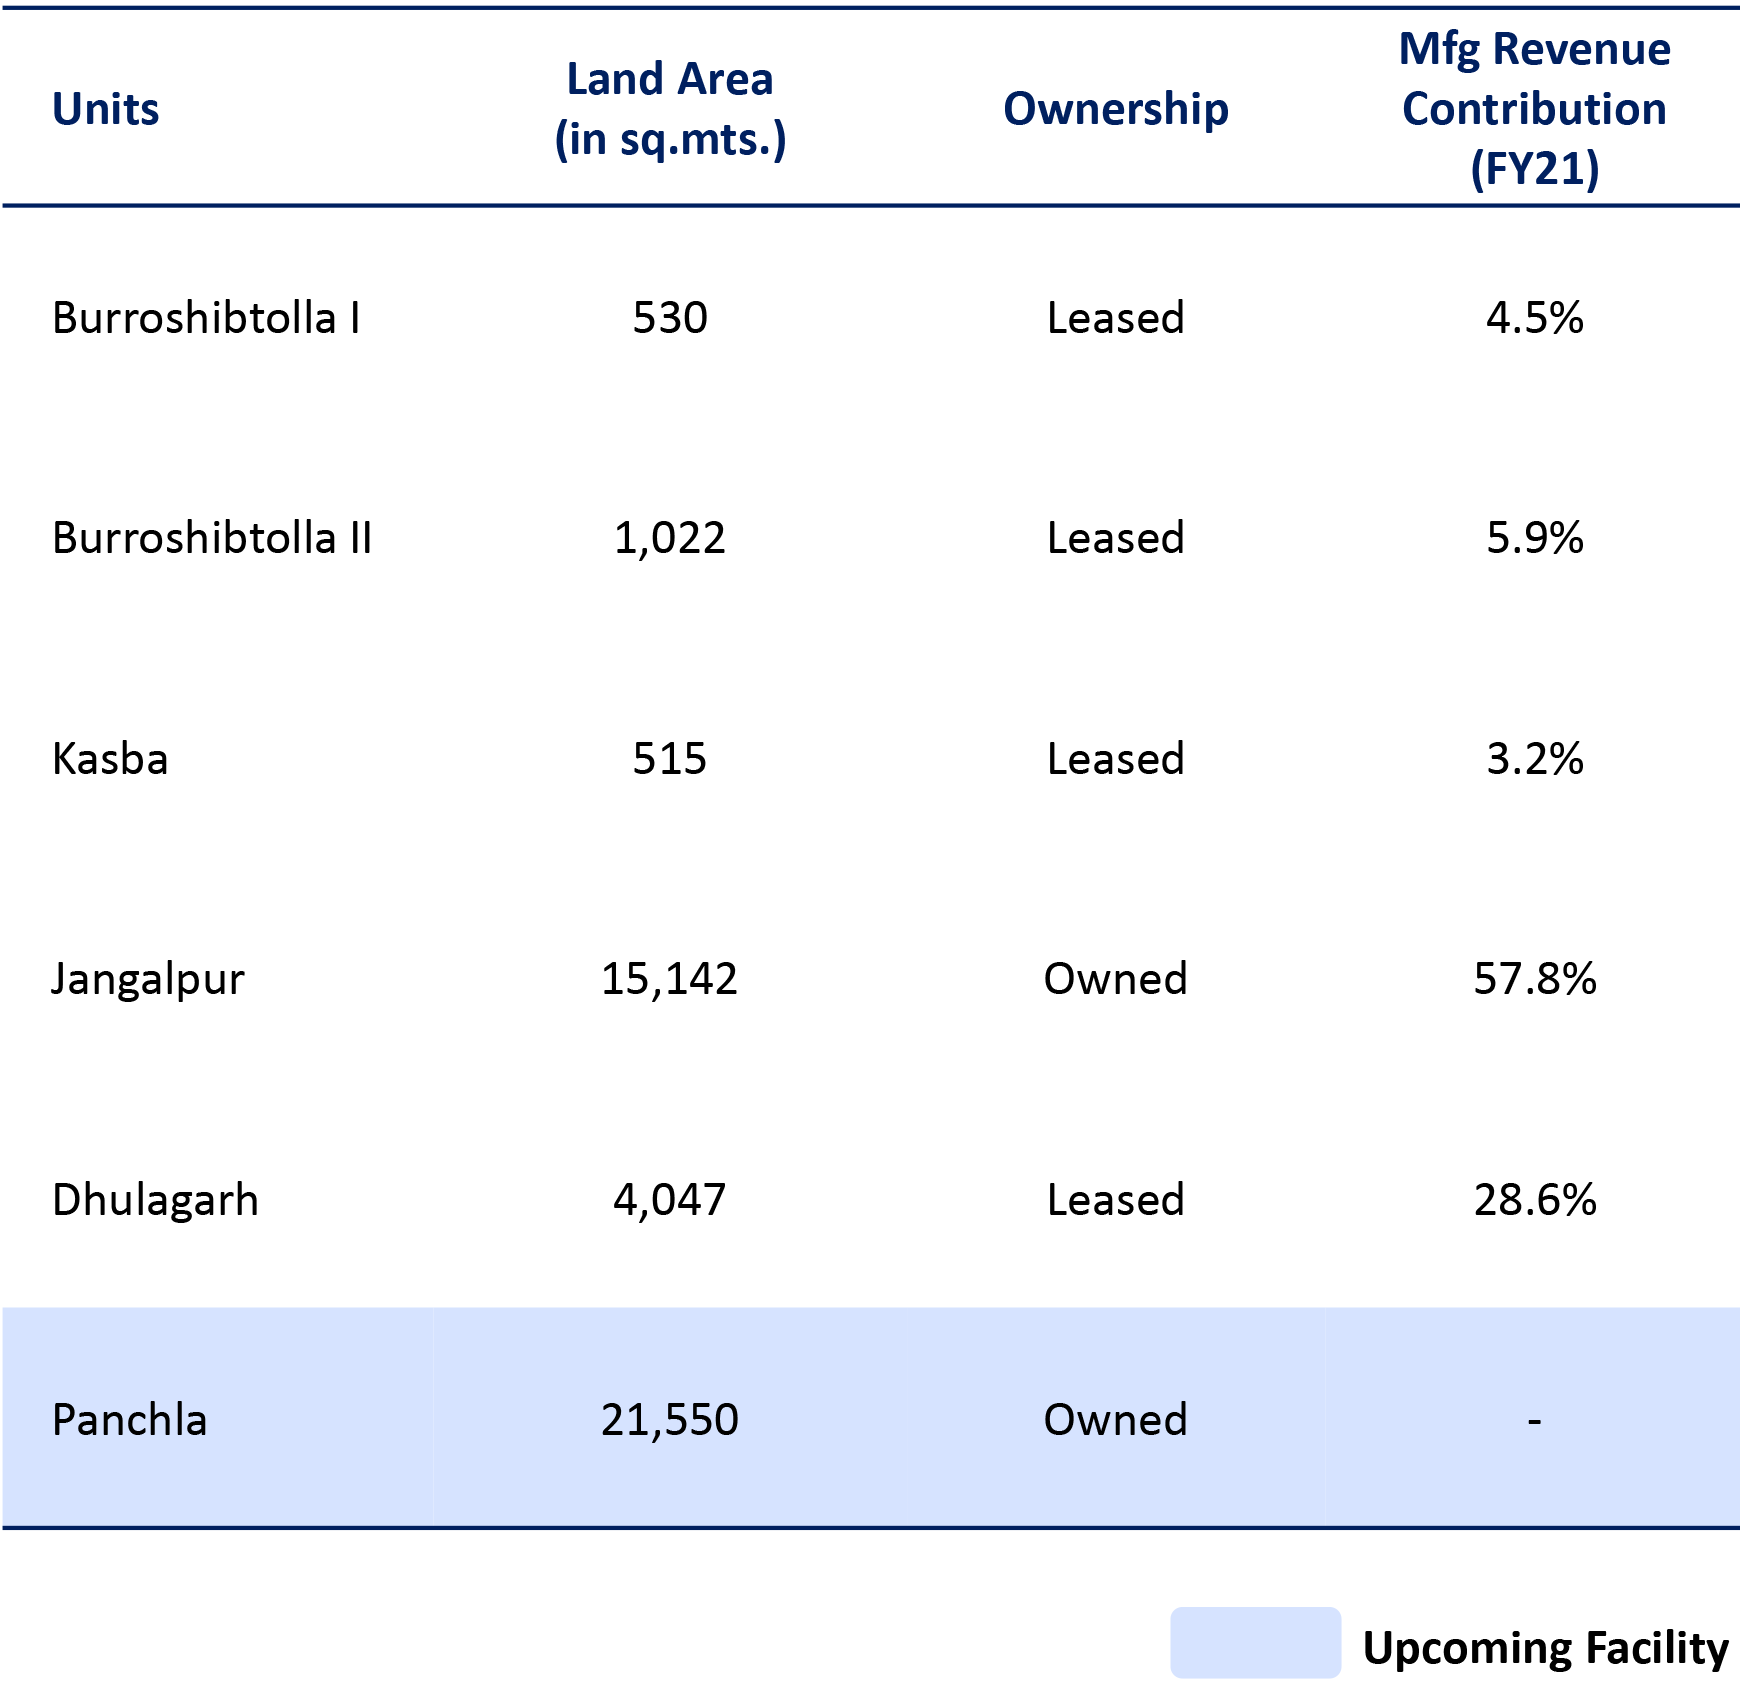
TPL has 5 vertically integrated manufacturing capabilities with design & development
being carried out in-house. Its production process is free from human touch and
thus helps to achieve the desired levels of purity required for use in life sciences
products. The company plans to develop a 6th capacity in Panchla, West Bengal from
part of the proceeds of the IPO and another in Amta, West Bengal which will be a
fulfilment center with in-house sterilization capability both the projects are expected
to complete by middle of 2023.
Financials
The company has shown stable growth in revenue in the last 3 years where they saw a minor dip in FY20 due to COVID-19. Revenue of the company has grown from Rs 178.7 cr to Rs 228.9 cr over the period of FY19 to FY21; during the same period profit has grown from Rs 39 cr in FY19 to Rs 68.9 cr in FY21. EBITDA margin expanded by 510bps from 40.1% in FY19 to 45.2% in FY21. Tarsons has good ROE of 28.2% for FY21 aided by high margins which can sustain with growing scale of operations. Company is also planning for CAPEX which will further increase the revenues.
Industry
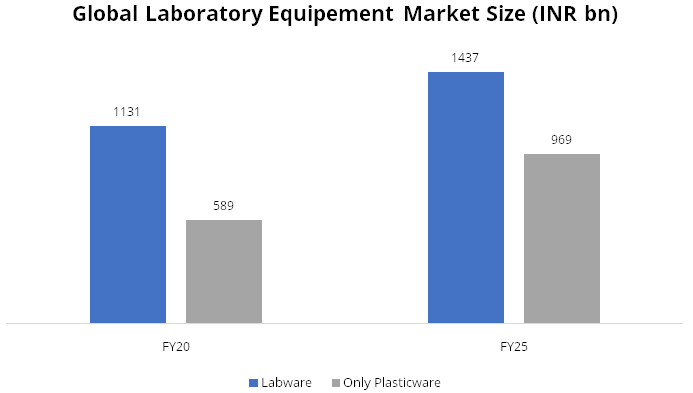
- The global labware market was valued at INR 1131 bn in FY20 and is expected to grow at 4.9% to reach INR 1437 bn by FY25.
- One of the major drivers of this growth is expected increase in investments by pharmaceutical companies to advance research into the treatment of various chronic diseases.
- With high penetration expected in the coming years, plastic labware is expected to replace glassware products by another 15% to reach a market share of approximately 67% in the global laboratory equipment market by Fiscal 2025, given plastic products are superior in terms of shelf life, handling, and safety benefits.
- The global plasticware lab equipment market is expected to grow at 10.5% to reach INR 969 bn by FY25.
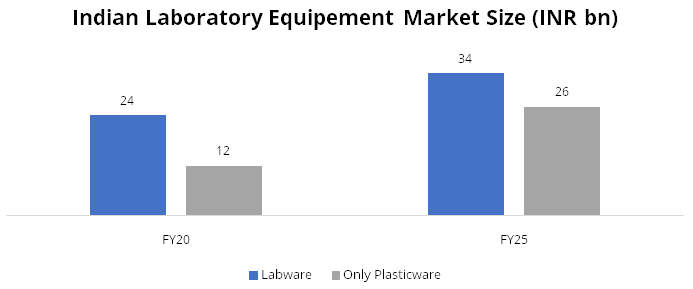
- The Indian labware market is expected to grow at 7.8% and only plasticware is expected to grow at a robust 16.0%.
- Underpenetrated healthcare sector is likely to provide significant room for growth
- The growth in pharmaceutical R&D being outsourced to India will also provide huge catalyst for the labware space.
Outlook & valuation
Tarsons has built a recognized brand in the domestic market with strong market share of 9-12% in India. company is well placed to capture the growth arising from shift from glassware to plastic ware, growth for end users and, continued gains for domestic manufacturers among others. There is a respectable import market for the company to capture and also a huge export opportunity arising from the “China plus one” strategy. As per our estimates, the stock is currently trading at a price of 780 at 38x FY23 EPS. We Initiate coverage on Tarson Products Ltd with a ‘Buy’ rating.
Financial Statement
Profit & Loss statement
| Yr End March (Rs Cr) | 2019 | 2020 | 2021 | 2022E | 2023E |
|---|---|---|---|---|---|
| Net Sales | 178.70 | 175.90 | 228.90 | 274.80 | 331.90 |
| Expenditure | |||||
| Material Cost | 61.70 | 57.90 | 72.70 | 76.90 | 89.60 |
| Employee Cost | 16.10 | 20.10 | 24.40 | 30.50 | 33.20 |
| Other Expenses | 29.30 | 28.70 | 28.30 | 34.10 | 43.10 |
| EBITDA | 71.70 | 69.30 | 103.40 | 133.30 | 165.90 |
| EBITDA Margin | 40.10% | 39.40% | 45.20% | 48.50% | 50.00% |
| Depreciation & Amortization | 14.60 | 14.20 | 13.70 | 21.00 | 25.40 |
| EBIT | 57.10 | 55.10 | 89.80 | 112.30 | 140.50 |
| EBIT Margin % | 31.90% | 31.30% | 39.20% | 40.90% | 42.30% |
| Other Income | 6.00 | 4.20 | 5.40 | 5.30 | 5.40 |
| Interest & Finance Charges | 7.20 | 6.10 | 2.70 | 3.20 | 2.10 |
| Profit Before Tax - Before Exceptional | 55.80 | 53.10 | 92.40 | 114.40 | 143.80 |
| Profit Before Tax | 55.80 | 53.10 | 92.40 | 114.40 | 143.80 |
| Tax Expense | 16.90 | 12.60 | 23.60 | 28.80 | 33.10 |
| Effective Tax rate | 30.20% | 23.70% | 25.50% | 25.20% | 23.00% |
| Net Profit | 39.00 | 40.50 | 68.90 | 85.60 | 110.70 |
| Net Profit Margin | 21.80% | 23.00% | 30.10% | 31.10% | 33.40% |
| Consolidated Net Profit | 39.00 | 40.50 | 68.90 | 85.60 | 110.70 |
| Net Profit Margin after MI | 21.80% | 23.00% | 30.10% | 31.10% | 33.40% |
Balance Sheet
| Yr End March (Rs Cr) | 2019 | 2020 | 2021 | 2022E | 2023E |
|---|---|---|---|---|---|
| Share Capital | 0.20 | 0.20 | 0.20 | 10.60 | 10.60 |
| Total Reserves | 135.10 | 197.40 | 244.10 | 441.70 | 544.70 |
| Shareholders' Funds | 135.30 | 197.60 | 244.30 | 452.30 | 555.30 |
| Minority Interest | - | - | - | - | - |
| Non Current Liabilities | |||||
| Long Term Burrowing | 18.70 | 5.90 | 3.30 | - | - |
| Deferred Tax Assets / Liabilities | 3.90 | 3.20 | 3.30 | 3.30 | 3.30 |
| Current Liabilities | |||||
| Short Term Borrowings | 36.30 | 18.80 | 23.10 | - | - |
| Trade Payables | 2.00 | 5.90 | 6.00 | 3.50 | 4.20 |
| Other Current Liabilities | 13.50 | 14.70 | 11.20 | 4.10 | 4.10 |
| Short Term Provisions | 2.20 | 1.10 | 1.50 | 1.50 | 1.50 |
| Total Equity & Liabilities | 212.00 | 248.70 | 296.00 | 468.00 | 571.70 |
| Assets | |||||
| Net Block | 89.00 | 92.00 | 120.40 | 163.40 | 200.00 |
| Long Term Loans & Advances | 18.80 | 17.50 | 40.40 | 40.40 | 40.40 |
| Current Assets | |||||
| Currents Investments | - | - | - | - | - |
| Inventories | 46.40 | 48.70 | 46.70 | 25.50 | 30.80 |
| Sundry Debtors | 44.60 | 38.20 | 47.00 | 26.20 | 31.60 |
| Cash and Bank | 0.90 | 26.30 | 3.10 | 174.10 | 230.60 |
| Short Term Loans and Advances | 3.50 | 4.80 | 9.80 | 9.80 | 9.80 |
| Total Assets | 212.00 | 248.70 | 296.00 | 468.00 | 571.70 |
Cash Flow Statement
| Yr End March (Rs Cr) | 2019 | 2020 | 2021 | 2022E | 2023E |
|---|---|---|---|---|---|
| Profit After Tax | 39.00 | 40.50 | 68.90 | 85.60 | 110.70 |
| Depreciation | 14.60 | 14.20 | 13.70 | 21.00 | 25.40 |
| Others | 80.20 | -1.60 | -9.20 | - | - |
| Changes in Working Capital | -8.80 | 6.40 | -16.00 | 39.50 | -9.90 |
| Cash From Operating Activities | 51.30 | 64.20 | 68.20 | 146.00 | 126.30 |
| Purchase of Fixed Assets | -33.90 | -26.00 | -61.90 | -64.00 | -62.00 |
| Free Cash Flows | 17.40 | 38.20 | 6.30 | 82.00 | 64.30 |
| Others | 0.10 | 0.60 | -2.20 | - | - |
| Cash Flow from Investing Activities | -33.60 | -25.40 | -63.90 | -64.00 | -62.00 |
| Increase / (Decrease) in Loan Funds | -29.50 | -11.40 | -6.80 | -33.50 | - |
| Equity Dividend Paid | - | - | - | -6.00 | -7.80 |
| Others | 11.30 | -2.40 | -20.50 | - | - |
| Cash from Financing Activities | -18.20 | -13.80 | -27.20 | -39.40 | -7.80 |
| Net Cash Inflow / Outflow | -0.50 | 25.00 | -23.00 | 42.60 | 56.50 |
| Opening Cash & Cash Equivalents | 1.00 | 0.50 | 25.30 | 2.30 | 44.90 |
| Closing Cash & Cash Equivalent | 0.50 | 25.30 | 2.30 | 44.90 | 101.40 |
Key Ratios
| Yr End March | 2019 | 2020 | 2021 | 2022E | 2023E |
|---|---|---|---|---|---|
| Basic EPS | 2029.10 | 2026.60 | 13.50 | 16.10 | 20.80 |
| Diluted EPS | 2029.10 | 2026.60 | 13.50 | 16.10 | 20.80 |
| Cash EPS (Rs) | 2787.60 | 2735.10 | 16.20 | 20.00 | 25.60 |
| DPS | - | - | - | 1.10 | 1.50 |
| Book value (Rs/share) | 7045.50 | 9878.50 | 48.00 | 85.00 | 104.40 |
| ROCE (%) Post Tax | 46.30% | 21.90% | 28.80% | 24.30% | 22.30% |
| ROE (%) | 28.80% | 20.50% | 28.20% | 18.90% | 19.90% |
| Inventory Days | 47.40 | 98.70 | 76.10 | 37.00 | 37.00 |
| Receivable Days | 45.50 | 85.90 | 68.00 | 38.00 | 38.00 |
| Payable Days | 2.10 | 8.20 | 9.50 | 5.00 | 5.00 |
| PE | - | - | 57.70 | 48.50 | 37.50 |
| P/BV | - | - | 16.30 | 9.20 | 7.50 |
| EV/EBITDA | 0.90 | 0.10 | 38.70 | 30.80 | 24.40 |
| Dividend Yield (%) | - | - | 0.00% | 0.10% | 0.20% |
| P/Sales | - | - | 17.40 | 15.10 | 12.50 |
| Net debt/Equity | 0.50 | 0.00 | 0.10 | - | - |
| Net Debt/ EBITDA | 0.90 | 0.10 | 0.30 | -0.30 | -0.60 |
| Sales/Net FA (x) | 4.00 | 1.90 | 2.20 | 1.90 | 1.80 |