Stove Kraft Ltd
Consumer Durables - Domestic Appliances
Stove Kraft Ltd
Consumer Durables - Domestic Appliances
Stock Info
Shareholding Pattern
Price performance
Indexed Stock Performance
High growth to continue with sustainable margins
Company Profile:
Stovekraft (SKL) manufactures cooking appliances under Pigeon and Gilma brands.
The company was founded in 1999 and is headquartered in Bangalore, Karnataka. It
also has an exclusive licensing agreement with Black & Decker for manufacturing
of appliances in the premium category. Stovekraft operates two manufacturing plant
in India located at Bangalore, Karnataka, and Baddi, Himachal Pradesh. At Bengaluru
in Karnataka, the company has an installed annual production capacity of 38.4mn
units, with the capability to manufacture pressure cookers, non-stick cookware (roller
coated and spray coated), LPG stoves, mixer grinders, LED bulbs, iron and induction
cooktops categories. Its Baddi Facility in Himachal Pradesh, has an installed capacity
of 2.8mn units per annum, with the capability to manufacture products such as LPG
stoves and inner lid cooker. SKL operates through 646 distributors, 61400+retail
outlets and 62 exclusive GILMA stores. SKL’s products are exported to 14 countries,
including USA, Mexico and Saudi Arabia. The company also undertakes original equipment
manufacturing for retail chains in the USA.

Consolidated Financial Statements
| Rs in Cr | Net Sales | EBITDA | EBITDAM | PAT | EPS | ROE | P/E | EV/EBITDA |
|---|---|---|---|---|---|---|---|---|
| FY19 | 640.90 | 29.80 | 4.70% | 0.60 | 0.30 | -1.00% | 1783.70 | 47.70 |
| FY20 | 669.90 | 33.80 | 5.00% | 3.20 | 1.30 | -5.30% | 358.30 | 42.50 |
| FY21 | 859.00 | 113.50 | 13.20% | 81.50 | 24.90 | 27.00% | 18.30 | 13.40 |
| FY22E | 1154.00 | 129.20 | 11.20% | 98.50 | 30.00 | 24.60% | 30.40 | 23.00 |
| FY23E | 1419.40 | 180.30 | 12.70% | 125.90 | 38.40 | 23.90% | 23.80 | 16.10 |
Investment Rationale
Diversified product portfolio:
Stove Kraft has a diversified product portfolio comprising of a wide and diverse
suite of kitchen solutions. It is a dominant player in Pressure Cooker and amongst
the market leaders in the sale of free standing Hobs and Cook-tops. The company
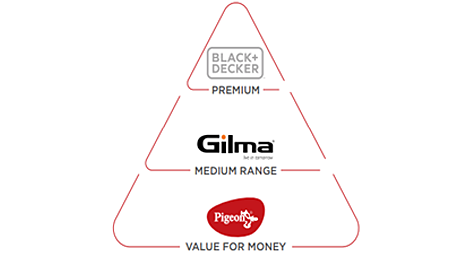
follows a multi-brand approach to capture the entire value chain. It covers the
entire range of value, semi-premium and premium kitchen solutions through Pigeon,
Gilma and BLACK+DECKER brands, respectively. Apart from kitchen solutions, the company
has also started to establish its presence in home solutions by offering consumer
lighting products under the brand ‘Pigeon LED’. Also, the company is
in a sweet spot given ~86% of its revenue is derived from products manufactured
in-house which help in better supply chain management and quicker introduction of
new range/product categories.

“Value-for-money” brand positioning in highly fragmented market:
SKL’s Pigeon (~93% of total FY21 sales) is the preferred brand when a consumer
is shifting from an unorganized brand to an organized brand due to its attractive
price points in a highly fragmented market. The company is a volume leader in the
Gas stove category and among the Top-3 players in Pressure Cooker & Non-stick
Cookware (TTK Prestige & Hawkins are the other two players).
Backward-Integrated Manufacturing Units:
Currently, the company has two active state-of-the-art and backward integrated manufacturing
facilities at Bengaluru, Karnataka and Baddi, Himachal Pradesh which enables it
to manufacture its products (Pigeon and Gilma brands) at low costs while ensuring
high quality assurance. The company has in-house component manufacturing capabilities
for its products. It has the ability to manufacture components such as Bakelite
Handle, Sheet Metal Components, Moulded parts, Die Cast parts, Mould Dyes and Fixtures
in-house for the manufacturing of its products. Backward integration of its manufacturing
facilities has reduced dependence on third-party suppliers and OEMs for such components.
Stove Kraft’s Bengaluru facility is spread over ~43 acres out of which ~25
acres is available for future expansion. SKL is confident of achieving EBITDA margin
guidance of 13-14% as they are focusing more on backward integration.
Industry tailwinds:
Rising disposable incomes and easy access to credit is driving the Indian consumer
appliances market. Tier-II and Tier-III cities will be the upcoming high disposable-income
cities due to greater purchasing power, high internet penetration and increasingly
brand-conscious young population. The presence of e-commerce players such as Amazon,
Flipkart & Paytm provides a huge platform for Consumer Appliance manufacturers
to market & sell products easily. SKL derives 45% of its total revenue from
the e-commerce channel as on Q2FY22. Moreover, shift from unorganized to organized
should help organized players like SKL witness strong topline growth in next three
years.


Source: Company Presentation
Strong distribution network and spending on advertising & marketing to aid
revenue growth
SKL added 8,247 retail outlets in Q2FY22 taking the total number to 63,428 outlets
as of September 2021. Of the total retail touch-points, PIGEON accounts for ~52,000,
GILMA ~10,500 and BLACK & DECKER ~500. The company is focused on increasing
distribution network across the country and bringing more customers onboard through
increasing the number of retail outlets. As per the management estimates, the total
addressable touch-points in PIGEON are 100,000. During Q2FY22, the company increased
spending on branding & marketing through focused and consistent initiatives
to develop brand awareness. We believe these initiatives will help the company to
deliver consistent growth going forward.
Strong operational performance in Q2FY22:
Stove Kraft Limited (SKL) reported strong Q2FY22 numbers whereby revenue increased
by 53% YoY to Rs 362 crores driven by growth across all channels – general
trade, modern retail and e-commerce. Ebitda was up ~15% YoY however margins were
down by ~360 bps 11.2% due to higher raw material costs. PAT was down by ~15% YoY
to Rs 23 crores as the company has started providing for income tax after setting
off accumulated losses brought forward from previous years. During the quarter,
the Company introduced Distributor Management System across 100% of its outlets.
This tool helps improve operations and provide effective sales & inventory management
related only to Pigeon products. SKL added 8,247 retail outlets in the quarter gone
by. In Q3FY22, SKL is planning to launch Plastic Storage Containers. Also, it will
have a full range of LEDs (0.5watt to 50watt) from Q3FY22. In Q2FY22, Pressure Cooker
volume grew by 53% YoY, Gas Cooktop by 31% YoY, Induction Cooktop by 53% YoY, Non-stick
Cookware by 14% YoY, LED by 70% YoY and Small Appliances/Mixer/Others grew by 34%
YoY.
Risks & Concerns
Increase in competitive intensity:
The company operates in an industry where players such as TTK Prestige, Hawkins,
Bajaj Electricals etc have strong presence. These players can easily disrupt the
value for money segment on the back of strong distribution reach and brand awareness.
Slowdown in consumer spending:
Significant slowdown in consumer spending can adversely impact the demand and it
might affect the Stove Kraft’s growth.
The BLACK + DECKER (B&D) Brand License Agreement contains certain provisions
and a failure to comply with any provision could result in termination of brand
license agreement:
SKL is required to get all the products that it intends to sell under the Black
+ Decker Marks approved by B&D at the development stage, maintain certain quality
standards, and achieve minimum total sales per year as laid out in the B&D Brand
License Agreement, failing which B&D may at its sole discretion terminate the
Brand License Agreement.
Rise in key raw material prices:
Rise in key raw material prices could adversely impact the profitability, if not
passed on to the consumers.
Outlook & valuation
The company has transformed from a single brand LPG stove manufacturing company to become one of India’s leading manufacturers of kitchen appliances with a distribution network spread across the entire country. It is well placed to reap the benefits of having a strong presence in Tier-2 and Tier-3 cities and is working to establish its presence in Tier-1 cities too. The management is confident of achieving 20-25% volume growth and 13-14% EBITDA margins on a sustainable basis. We believe the company has taken the right steps towards delivering sustainable growth. Focus on expanding distribution network and introduction of innovative products will be the key growth driver. As per our estimates, the stock is currently trading at ~24x FY23 EPS and we initiate our coverage on Stove Kraft Ltd with a Buy Rating.
Financial Statement
Profit & Loss statement
| Yr End March (Rs Cr) | 2019 | 2020 | 2021 | 2022E | 2023E |
|---|---|---|---|---|---|
| Net Sales | 640.90 | 669.90 | 859.00 | 1154.00 | 1419.40 |
| Growth % | 22.40% | 4.50% | 28.20% | 34.30% | 23.00% |
| Expenditure | |||||
| Material Cost | 438.70 | 441.90 | 558.20 | 763.90 | 922.60 |
| Employee Cost | 68.60 | 82.00 | 80.60 | 108.50 | 134.80 |
| Other Expenses | 103.80 | 112.20 | 106.60 | 152.30 | 181.70 |
| EBITDA | 29.80 | 33.80 | 113.50 | 129.20 | 180.30 |
| Growth % | 199.10% | 13.30% | 235.70% | 13.90% | 39.50% |
| EBITDA Margin | 4.70% | 5.00% | 13.20% | 11.20% | 12.70% |
| Depreciation & Amortization | 12.40 | 12.40 | 14.30 | 17.30 | 20.70 |
| EBIT | 17.40 | 21.40 | 99.20 | 112.00 | 159.60 |
| EBIT Margin % | 2.70% | 3.20% | 11.50% | 9.70% | 11.20% |
| Other Income | 1.70 | 3.10 | 1.50 | 5.00 | 10.00 |
| Interest & Finance Charges | 17.90 | 20.90 | 19.20 | 2.50 | 1.70 |
| Profit Before Tax - Before Exceptional | 1.10 | 3.50 | 81.50 | 114.50 | 167.90 |
| Profit Before Tax | 1.10 | 3.50 | 81.50 | 114.50 | 167.90 |
| Tax Expense | 0.50 | 0.40 | - | 16.00 | 42.00 |
| Effective Tax rate | 43.50% | 10.30% | 0.00% | 14.00% | 25.00% |
| Exceptional Items | - | - | - | - | - |
| Net Profit | 0.60 | 3.20 | 81.50 | 98.50 | 125.90 |
| Growth % | -105.00% | 399.40% | 2468.80% | 20.90% | 27.90% |
| Net Profit Margin | 0.10% | 0.50% | 9.50% | 8.50% | 8.90% |
| Consolidated Net Profit | 0.60 | 3.20 | 81.50 | 98.50 | 125.90 |
| Growth % | -105.00% | 397.80% | 2476.90% | 20.90% | 27.90% |
| Net Profit Margin after MI | 0.10% | 0.50% | 9.50% | 8.50% | 8.90% |
Balance Sheet
| Yr End March (Rs Cr) | 2019 | 2020 | 2021 | 2022E | 2023E |
|---|---|---|---|---|---|
| Share Capital | 24.70 | 24.70 | 32.60 | 32.60 | 32.60 |
| Total Reserves | -87.30 | -85.80 | 267.10 | 365.60 | 491.60 |
| Shareholders' Funds | -62.40 | -60.00 | 301.40 | 399.90 | 525.90 |
| Minority Interest | 0.20 | 0.20 | - | - | - |
| Non Current Liabilities | |||||
| Long Term Burrowing | 210.00 | 204.80 | 20.70 | 0.20 | -4.80 |
| Deferred Tax Assets / Liabilities | - | - | - | - | - |
| Long Term Provisions | 4.60 | 6.30 | 7.20 | 5.00 | 4.90 |
| Current Liabilities | |||||
| Short Term Borrowings | 99.90 | 122.10 | 29.80 | 29.80 | 29.80 |
| Trade Payables | 134.10 | 150.90 | 176.60 | 198.50 | 253.80 |
| Other Current Liabilities | 29.20 | 34.30 | 14.80 | 10.00 | 10.00 |
| Short Term Provisions | 2.00 | 2.00 | 2.20 | 2.20 | 2.20 |
| Total Equity & Liabilities | 427.10 | 471.30 | 569.70 | 662.80 | 838.90 |
| Assets | |||||
| Net Block | 180.50 | 193.20 | 219.60 | 266.90 | 300.20 |
| Non Current Investments | - | - | - | - | - |
| Long Term Loans & Advances | 6.70 | 8.60 | 14.80 | 16.00 | 16.00 |
| Current Assets | |||||
| Currents Investments | - | - | - | - | - |
| Inventories | 97.40 | 116.60 | 156.00 | 157.20 | 197.40 |
| Sundry Debtors | 89.70 | 103.00 | 84.70 | 110.30 | 141.00 |
| Cash and Bank | 31.50 | 19.40 | 37.30 | 53.40 | 125.50 |
| Short Term Loans and Advances | 7.50 | 13.90 | 34.00 | 34.40 | 34.30 |
| Total Assets | 427.10 | 471.30 | 569.70 | 662.80 | 838.90 |
Cash Flow Statement
| Yr End March (Rs Cr) | 2019 | 2020 | 2021 | 2022E | 2023E |
|---|---|---|---|---|---|
| Profit After Tax | 0.60 | 3.20 | 81.50 | 98.50 | 125.90 |
| Depreciation | 12.40 | 12.40 | 14.30 | 17.30 | 20.70 |
| Changes in Working Capital | -18.00 | -27.50 | -8.10 | -4.80 | -15.70 |
| Cash From Operating Activities | 13.20 | 15.60 | 110.00 | 110.90 | 131.00 |
| Purchase of Fixed Assets | -7.40 | -26.10 | -63.40 | -64.60 | -53.90 |
| Free Cash Flows | 5.70 | -10.50 | 46.60 | 46.40 | 77.10 |
| Cash Flow from Investing Activities | -6.80 | -27.30 | -66.40 | -64.60 | -53.90 |
| Increase / (Decrease) in Loan Funds | 40.30 | 16.30 | -100.80 | -22.40 | -5.00 |
| Equity Dividend Paid | - | - | - | - | - |
| Cash from Financing Activities | 21.80 | -1.80 | -29.10 | -22.40 | -5.00 |
| Net Cash Inflow / Outflow | 28.10 | -13.50 | 14.40 | 24.00 | 72.10 |
| Opening Cash & Cash Equivalents | 0.40 | 28.50 | 15.00 | 29.50 | 53.40 |
| Closing Cash & Cash Equivalent | 28.50 | 15.00 | 29.50 | 53.40 | 125.50 |
Key Ratios
| Yr End March | 2019 | 2020 | 2021 | 2022E | 2023E |
|---|---|---|---|---|---|
| Basic EPS | 0.30 | 1.30 | 24.90 | 30.00 | 38.40 |
| Diluted EPS | 0.30 | 1.30 | 24.90 | 30.00 | 38.40 |
| Cash EPS (Rs) | 5.30 | 6.40 | 29.20 | 35.30 | 44.70 |
| DPS | - | - | - | - | - |
| Book value (Rs/share) | -25.20 | -24.60 | 92.00 | 122.00 | 160.40 |
| ROCE (%) Post Tax | 4.70% | 8.50% | 32.50% | 25.70% | 25.90% |
| ROE (%) | -1.00% | -5.30% | 27.00% | 24.60% | 23.90% |
| Inventory Days | 57.70 | 58.30 | 57.90 | 57.00 | 56.00 |
| Receivable Days | 48.20 | 52.50 | 39.90 | 40.00 | 40.00 |
| Payable Days | 79.50 | 77.70 | 69.60 | 72.00 | 72.00 |
| PE | 1783.70 | 358.30 | 18.30 | 30.40 | 23.80 |
| P/BV | -18.20 | -18.60 | 5.00 | 7.50 | 5.70 |
| EV/EBITDA | 47.70 | 42.50 | 13.40 | 23.00 | 16.10 |
| Dividend Yield (%) | 0.00% | 0.00% | 0.00% | 0.00% | 0.00% |
| P/Sales | 1.80 | 1.70 | 1.70 | 2.60 | 2.10 |
| Net debt/Equity | - | - | 0.00 | - | - |
| Net Debt/ EBITDA | 9.70 | 9.40 | 0.10 | -0.20 | -0.60 |
| Sales/Net FA (x) | 3.50 | 3.60 | 4.20 | 4.70 | 5.00 |