
Solar Industries India Ltd
Explosives
Solar Industries India Ltd
Explosives
Stock Info
Shareholding Pattern
Price performance
Indexed Stock Performance

Strong earnings continues
Company Overview:
Solar Industries India is India’s largest manufacturer and exporter of industrial
explosives and initiating systems. Founded in 1995, SIL has evolved from a single
site manufacturing firm to a globally recognized industrial explosives company with
34 manufacturing facilities. It has attained a large presence in global markets
with footprints in 55 countries.
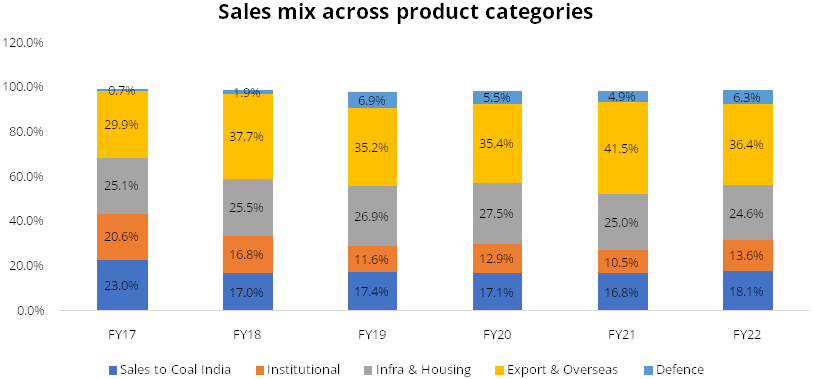
Industrial explosive sector has two components namely bulk explosives and packaged explosives. Bulk explosives are used in coal mining & other deep underground form of mining, where larger intensity of explosion is required. Packaged explosives (also known as cartridge explosives) are used in sectors such as housing, roads and infrastructure, where relatively lesser intensity of explosion is needed during construction.
SIL’s business can be broadly divided in three categories of domestic market, overseas market and defence. The domestic market forms 55% of consolidated sales. SIL is the market leader in the domestic market with 25% market share. SIL has the highest licensed capacity in India’s explosive industry at 450,000 MTPA (total industry capacity is 1.7 mn MTPA). SIL has the largest single location manufacturing capacity for packaged explosives in the world at Nagpur.
The exports and overseas market forms 40% of SIL’s consolidated revenue. Over the past decade, it has set up manufacturing plants in 6 African countries. Now it is in the process of setting up plants in the Asia Pacific region. The current overseas manufacturing capacity of SIL stands at 130,000 MTPA. The defence business currently forms 5%-7% of consolidated sales.
Investment Rationale
Robust market position in the explosives industry
The group is one of India's largest manufacturers and exporters of explosives
and initiating systems, with a market share of around 24% in the explosives industry.
Its Nagpur manufacturing facility is the world's largest single-location cartridge
plant. It is one of the few players with a comprehensive product portfolio and the
ability to develop and supply customised products. In addition to experiencing healthy
growth in the domestic market, it has expanded significantly in the international
market in recent years. It is Coal India Ltd's largest supplier of explosives.
In 2010, the group entered the defence industry, gaining a competitive advantage by establishing manufacturing facilities for high energy explosives, delivery systems, ammunition, rocket/missile integration, pyros, igniters, and fuse. Limited explosive shelf life, continuous consumption by the armed forces, a focus on make in India, and typical long-term defence contracts provide consistent medium-term revenue visibility.
Bulk Explosives
The bulk explosives are used for high-intensity blasting operations. As a result,
mining is the primary end-user industry for bulk explosives. Coal mining is the
largest end-user of bulk explosives in India, accounting for 80% of total off-take,
with Coal India being the largest customer, followed by other miners such as Singareni
Colliers.
Mining companies obtain bulk explosives through the tender process. One tonne of coal requires approximately 1.6kg of explosives. Ammonium nitrate is a critical raw material that accounts for 65% to 70% of total raw material costs. SIL obtains these raw materials primarily from domestic fertiliser companies such as Deepak Fertilizer, GNFC, RCF, and others, with imports accounting for less than 10% of total requirements.
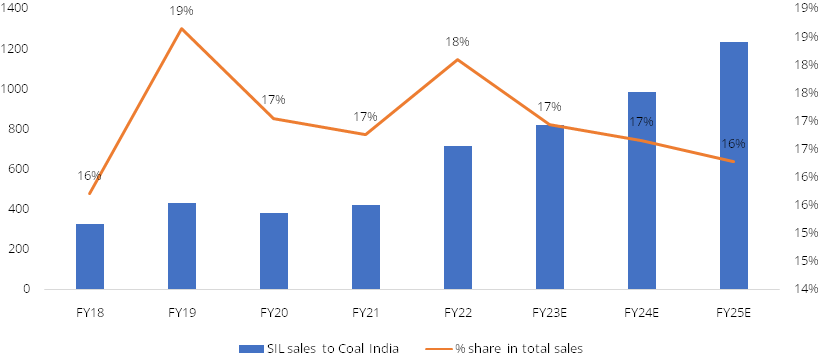
Bulk explosives account for approximately 30% of SIL's total revenue. As of FY22, Coal India accounts for 17% of total sales, while other miners (such as Singareni Colliers) account for 13% of total sales.
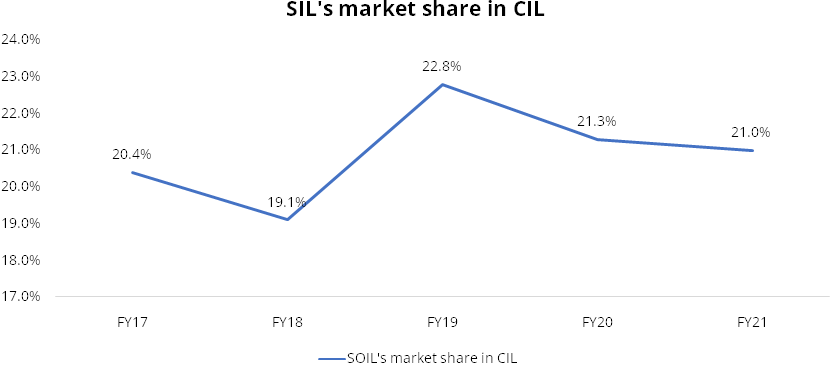
Company has gradually reduced its dependence on Coal India from 31% of total sales in FY14 to 18% in FY22 by scaling up its presence in packaged explosives as well as overseas markets. Company’s market share in explosives supplies to Coal India has remained steady in 20% range.
Reducing dependence on Coal India revenues
Defence - the future growth engine
SIL's core competency is to carve out a dominant position in a highly regulated
industry with a long gestation period and high entry barriers. SIL has consistently
focused on consumable products that have a strong synergy with their existing industrial
explosives business. It first entered the defence market in 2010, and has since
invested Rs. 700 crores in this sector. The defence has an extremely time-consuming
award-winning process that begins with "First Trial," then "RFP,"
and "Qualification Stage" (which includes product development, technical
scrutiny and field trails). Following this, 'Price bidding' begins, followed
by 'Order wins.'
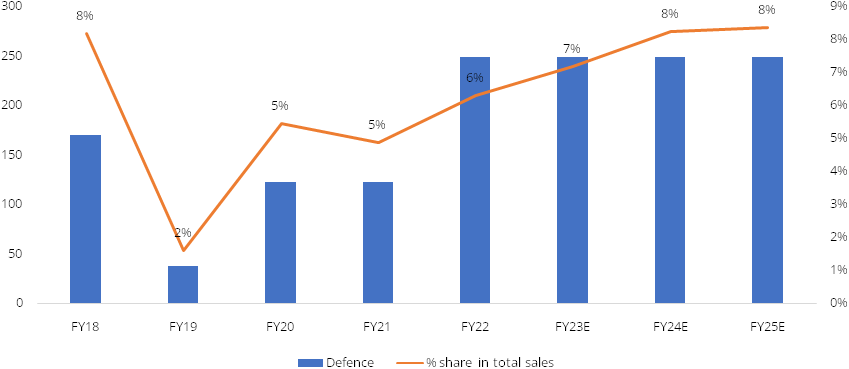
Company has consistently been ahead of the curve when it comes to investing in the defence industry. It has consistently generated strong cash flows from its core industrial explosives business, which it has invested in future growth opportunities such as defence, where there is a large mega opportunity.
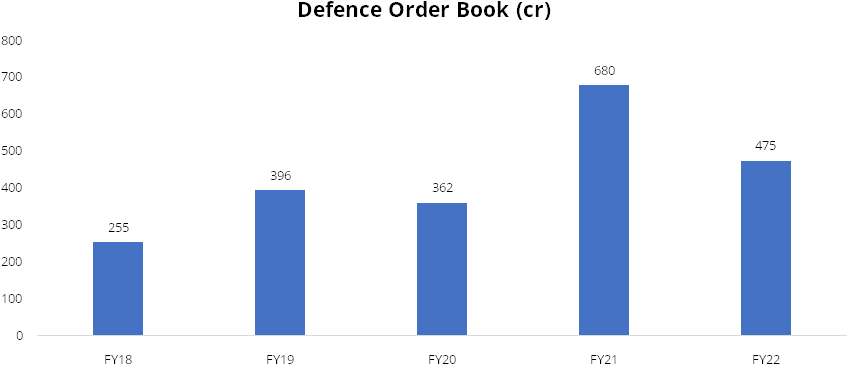
In FY22, the defence order book stands at Rs 475 crore, up from Rs 360 crore in FY20.
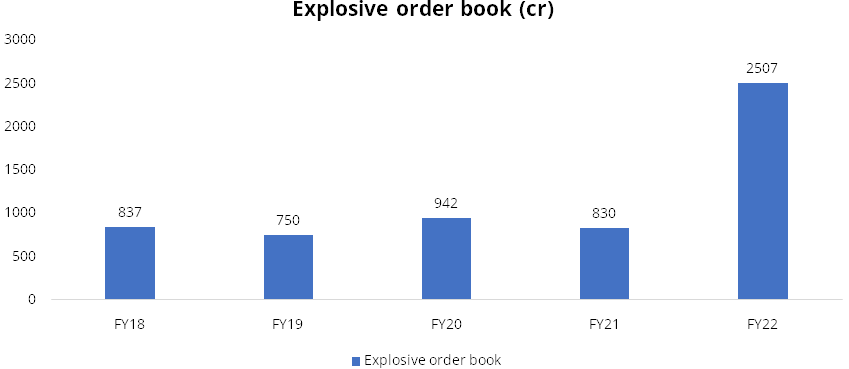
Domestic explosives order book trend
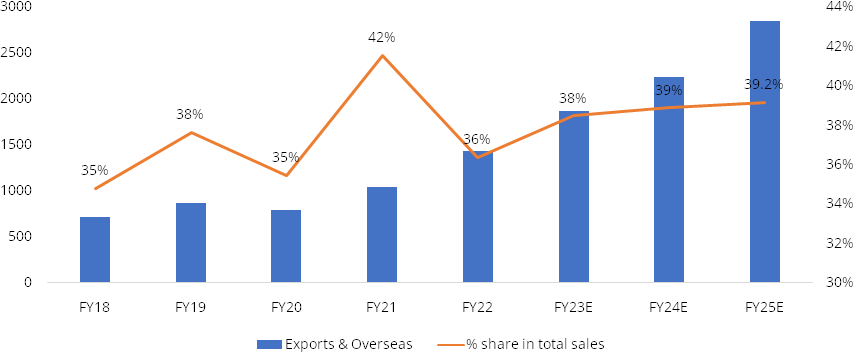
Export market- key growth drivers and game changer for Solar
Company now exports to 55 countries and has manufacturing facilities in Nigeria,
Zambia, Ghana, South Africa, Turkey, and Australia. It entered the overseas manufacturing
market in FY11, and its overseas revenues have grown at a CAGR of 20% between FY12
and FY22. SIL is the largest exporter of explosives and accessories from India.
The plants at Ghana and South Africa have started in the past five years while Tanzania
has started in FY22. Moving forward, the company intends to expand capacity in existing
geographies while also establishing new manufacturing facilities in 3-4 new countries
over the next 2-3 years.
The overseas market will continue to be the main growth driver of SIL, driven by (1) healthy market share in established geographies, (2) increased market share in newly forayed geographies, and (3) entry into large mining markets such as South Africa, Australia, and Indonesia, where market size is equal to or larger than India.
Exports & Overseas revenues have clocked robust CAGR of 25% over FY17-22
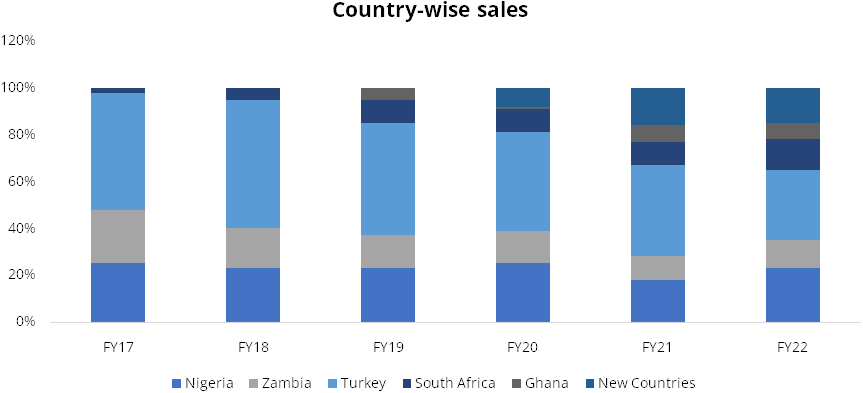
Country-wise sales
Backward integration and wider manufacturing presence provides cost
leadership
SIL has manufacturing plants in 23 locations across India, with six more in the
works. The majority of these plants are being built closer to the mines (within
60 kilometres), giving SIL a critical advantage in terms of lower transportation
costs (as explosives must be transported from the plant to the mine multiple times
per year) and quick supplies. This also helps in lowering of the total cost of operations,
which in turn, helps company in bidding competitively in a tender.
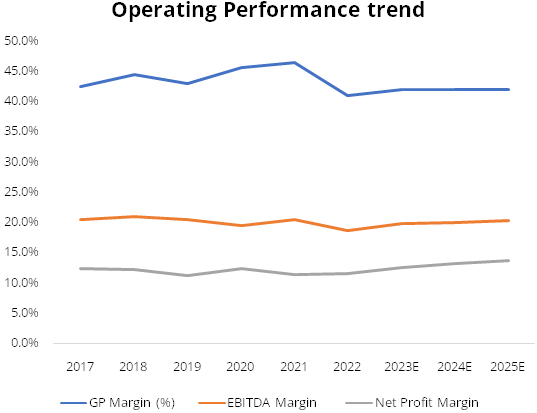
Majority of raw materials such as detonator components, emulsifiers, sodium nitrate and calcium nitrate are manufactured internally, leading to cost savings, quality control and stable operating margin of around 20% over the five fiscals through 2022. The group has the ability to pass on fluctuations in raw material prices to customers through price escalation clause in the contracts.
Presence of a price variation clause helps them to protect margin:
The presence of a price variation clause, which assists explosive manufacturers
in managing commodity cost volatility, is one of the key features of supplying explosives
to mining companies via tender. Mining companies such as Coal India and Singareni
Colliers provide price variation clauses for bulk explosives because contracts to
supply explosives are typically for one to two years. Coal India provides a price
variation clause for ammonium nitrate, diesel, and labour index, as well as quarterly
price revisions. Singareni Colliers offers monthly price revisions. These price
changes are based on a predetermined formula that tracks the prices of the input
costs.
In the case of packaged explosives (The packaged explosives are required to carry out medium to low intensity blasts. Hence, the core end user industry is infrastructure and housing sector for construction work such as building of roads, railways, bridges, tunnels, etc.) because it is a dealer-driven business model, explosive firms have the freedom to set prices based on their cost structure at regular intervals of 10-15 days. This aids in better cost management and pricing of explosives, typically with a quarter lag. This has aided SIL in managing its operating margins, which have consistently ranged between 19% and 21% over the last seven years.
Q1FY23 Results Update
- Revenue for the quarter came in at Rs 1615.9 crore, up 95.8% YoY & 22.7% QoQ. Volume growth was seen in Explosives were YoY, volumes rose 12.8% YoY and dipped 3.9% QoQ, whereas realisations jumped 96.8% YoY and 4.6% QoQ. Accessories segment registered an improvement of 19.8% YoY to Rs 115 crore. Defence segment revenue came in at Rs 64.3 crore, up 36.9% YoY and dipped 11.5% QoQ. Overseas and Exports segment revenue came in at Rs 593.2 crore, up 90.2% YoY and 74.7% QoQ.
- Gross margins expanded 40 bps YoY & expanded 550 bps QoQ (Gross margins expanded QoQ due to higher realisation). EBIDTA margins dipped QoQ and YoY and came in at 17.5% vs 20% in Q4FY22 (EBITDA margins dipped QoQ due higher other expenses). Posted an EBIDTA of Rs 252.4 crore, up 62% YoY & 7.7% QoQ.
- Solar posted a PAT (Post Minority interest) of Rs 170.2 crore in Q1FY23 vs Rs 167.9 crore in Q4FY22 & Rs 97.5 crore in Q1FY22.
- Company has maintained its revenue growth guidance of 30% out of which 15-17% will be volume growth and rest will be value growth. EBITDA margins to be in range of 20-22% in coming quarters mainly on relief in raw material prices.
- Current Order Book stands at Rs 3850 crore out of which Rs 538 crore is from defence sector.
- Revenue from defence is expected to touch Rs 400 crore mark in FY23 from 249 Crores in FY22.
- Pinaka test is in final stage and company will update about any order they received.
Financials
Key financial summary
SIL has delivered a healthy revenue growth CAGR of 16% over FY12-22, aided by consistent
focus on capacity expansion in the domestic markets and constant scale-up of exports
and overseas business. The contribution of exports and overseas business has increased
from 22% in FY12 to 36% of overall revenues as on FY22. Going forward, we expect
overall SIL revenues to grow at CAGR of 20% over FY22-25E. Export and overseas and
defence to be the key growth drivers for SIL. We expect these segments to grow at
CAGR of 28/37% respectively over FY22-25E.
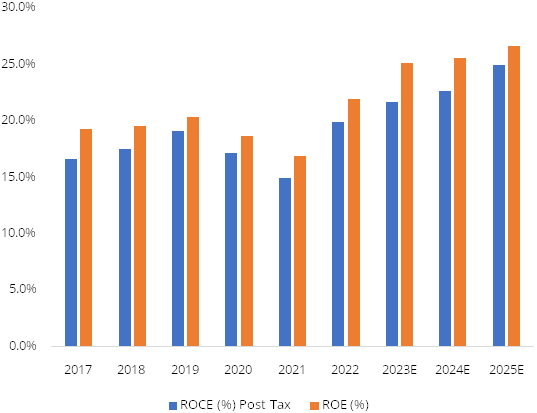
Its EBITDA and PAT grew by CAGR 15.9/16% respectively over FY12-22. Despite volatile raw material prices and higher capex, SIL has been able to operate at stable gross margins and has been reporting steady earnings growth over the past decade. Its operating performance has been consistent despite higher opex on the back of constant expansion both in domestic, international markets and in defence segment. Going forward, we expect its operational performance to improve with EBITDA and PAT likely to grow at CAGR of 29% and 33% respectively over FY22-25E.
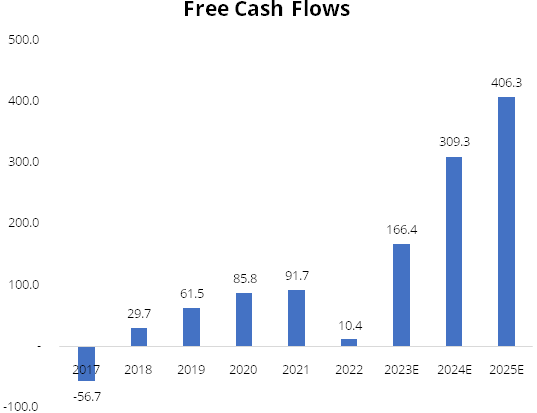
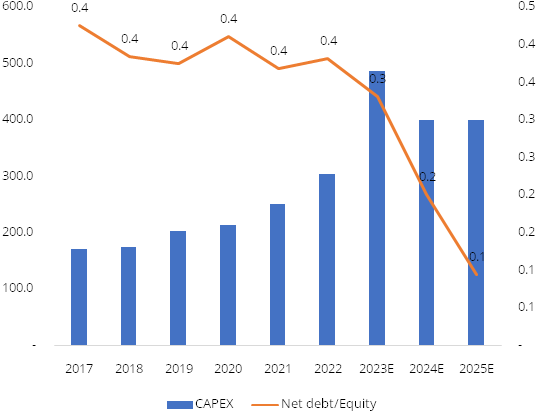
Despite constant capacity expansion across geographies and in the defence segment (capex of Rs. 2228Cr over FY10-22), the company has been able to constantly able to generate strong cash flow generation (FY12-22 cumulative Rs. 597cr).
Risks & Concerns
Volatility in raw material prices
Any prolonged volatility in raw material (Ammonium Nitrate) prices, along with the
inability to completely pass on higher prices due to stiff competitive intensity,
can impact overall profitability.
Delay in getting defence orders
SIL’s Q1FY23 order book in defence is Rs. 538 Cr, going forward considering
the high gestation period of technical evaluation & ordering process there is
a potential risk of delay in getting new defence orders.
Slowdown in mining and infrastructure sectors
Mining and infrastructure are the two key customer segments for SIL. Any slowdown
in these could impact the growth in revenues. These two customer segments also face
regulatory risks in terms of Govt.’s changing policies by incumbent governments.
Outlook & valuation
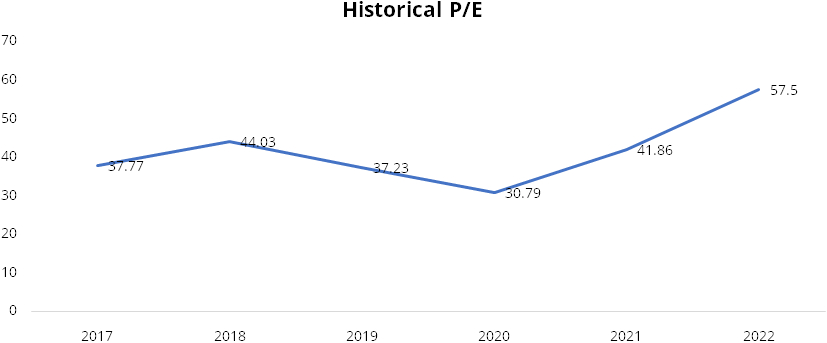
The positive earnings growth trajectory is expected to continue as a result of the key growth drivers of leadership, strong demand for packaged explosives, rising opportunities in the defence sector, improving overseas market dynamics, and a buoyant margin profile. We initiate Buy on Solar Industries Ltd with target price of Rs 4465 Valuing the stock at 38x FY25E EPS.
Financial Statement
Profit & Loss statement
| Year End March (Rs. in Crores) | 2020 | 2021 | 2022 | 2023E | 2024E | 2025E |
|---|---|---|---|---|---|---|
| Net Sales | 2237.30 | 2515.60 | 3947.60 | 4849.70 | 5998.80 | 7741.00 |
| Expenditure | ||||||
| Material Cost | 1215.00 | 1346.80 | 2327.30 | 2812.90 | 3479.30 | 4489.80 |
| Employee Cost | 196.00 | 222.00 | 267.50 | 354.00 | 419.90 | 541.90 |
| Other Expenses | 590.10 | 1644.30 | 1299.50 | 1638.10 | 2278.20 | -5031.70 |
| EBITDA | 434.30 | 514.60 | 734.60 | 955.40 | 1193.80 | 1563.70 |
| EBITDA Margin | 19.40% | 20.50% | 18.60% | 19.70% | 19.90% | 20.00% |
| Depreciation & Amortization | 84.50 | 93.50 | 109.30 | 126.00 | 144.00 | 154.00 |
| EBIT | 349.80 | 421.10 | 625.30 | 829.40 | 1049.80 | 1409.70 |
| EBIT Margin % | 15.60% | 16.70% | 15.80% | 17.10% | 17.50% | 18.20% |
| Other Income | 41.10 | 21.40 | 32.40 | 48.50 | 60.00 | 75.00 |
| Interest & Finance Charges | 55.00 | 45.40 | 50.30 | 63.40 | 53.90 | 63.80 |
| Profit Before Tax - Before Exceptional | 335.80 | 397.10 | 607.40 | 814.50 | 1055.80 | 1420.90 |
| Profit Before Tax | 335.80 | 397.10 | 607.40 | 814.50 | 1055.80 | 1420.90 |
| Tax Expense | 57.10 | 109.00 | 152.00 | 205.00 | 265.80 | 357.60 |
| Effective Tax rate | 17.00% | 27.50% | 25.00% | 25.20% | 25.20% | 25.00% |
| Net Profit | 278.70 | 288.10 | 455.50 | 609.50 | 790.10 | 1063.30 |
| Net Profit Margin | 12.50% | 11.50% | 11.50% | 12.60% | 13.20% | 14.00% |
Balance Sheet
| As of March (Rs. in Crores) | 2020 | 2021 | 2022 | 2023E | 2024E | 2025E |
|---|---|---|---|---|---|---|
| Share Capital | 18.10 | 18.10 | 18.10 | 18.10 | 18.10 | 18.10 |
| Total Reserves | 1362.00 | 1561.30 | 1896.20 | 2406.10 | 3069.50 | 3969.80 |
| Shareholders' Funds | 1431.60 | 1642.10 | 2014.90 | 2424.20 | 3087.60 | 3987.90 |
| Non Current Liabilities | ||||||
| Long Term Burrowing | 252.80 | 433.20 | 435.90 | 709.30 | 639.30 | 709.30 |
| Deferred Tax Assets / Liabilities | 53.30 | 46.10 | 42.30 | 42.30 | 42.30 | 42.30 |
| Long Term Provisions | 1.90 | 0.90 | 1.00 | 1.00 | 1.00 | 1.00 |
| Current Liabilities | ||||||
| Short Term Borrowings | 357.40 | 194.00 | 236.80 | 236.80 | 236.80 | 236.80 |
| Trade Payables | 154.40 | 286.10 | 464.90 | 421.80 | 668.70 | 752.90 |
| Other Current Liabilities | 208.60 | 310.70 | 382.80 | 189.30 | 189.30 | 189.30 |
| Short Term Provisions | 11.80 | 28.70 | 33.40 | 33.40 | 33.40 | 33.40 |
| Total Equity & Liabilities | 2480.80 | 2959.40 | 3629.40 | 4075.60 | 4915.90 | 5970.40 |
| Assets | - | |||||
| Net Block | 1208.60 | 1287.50 | 1492.70 | 1766.70 | 2022.70 | 2268.70 |
| Non Current Investments | 2.30 | 1.00 | 18.20 | 18.20 | 18.20 | 18.20 |
| Long Term Loans & Advances | 98.20 | 67.80 | 95.90 | 95.90 | 95.90 | 95.90 |
| Current Assets | ||||||
| Inventories | 331.00 | 440.50 | 718.90 | 723.10 | 1040.30 | 1261.10 |
| Sundry Debtors | 370.30 | 455.50 | 541.10 | 662.80 | 817.40 | 1091.70 |
| Cash and Bank | 120.10 | 181.20 | 98.80 | 144.90 | 257.50 | 570.90 |
| Short Term Loans and Advances | 66.00 | 63.00 | 202.30 | 202.30 | 202.30 | 202.30 |
| Total Assets | 2480.80 | 2959.40 | 3629.40 | 4075.50 | 4915.80 | 5970.30 |
Cash Flow Statement
| Year End March (Rs. in Crores) | 2020 | 2021 | 2022 | 2023E | 2024E | 2025E |
|---|---|---|---|---|---|---|
| Profit After Tax | 278.70 | 288.10 | 455.50 | 609.50 | 790.10 | 1063.30 |
| Depreciation | 84.50 | 93.50 | 109.30 | 126.00 | 144.00 | 154.00 |
| Changes in Working Capital | -33.40 | -105.30 | -312.30 | -169.10 | -224.80 | -411.00 |
| Cash From Operating Activities | 324.80 | 356.70 | 297.80 | 566.40 | 709.30 | 806.30 |
| Purchase of Fixed Assets | -239.10 | -265.00 | -287.40 | -400.00 | -400.00 | -400.00 |
| Free Cash Flows | 85.80 | 91.70 | 10.40 | 166.40 | 309.30 | 406.30 |
| Cash Flow from Investing Activities | -212.20 | -250.70 | -303.10 | -486.60 | -400.00 | -400.00 |
| Increase / (Decrease) in Loan Funds | 97.10 | 81.00 | 65.90 | 80.00 | -70.00 | 70.00 |
| Equity Dividend Paid | -76.40 | -54.30 | -54.30 | -99.50 | -126.70 | -162.90 |
| Cash from Financing Activities | -33.60 | -26.10 | -45.40 | -19.50 | -196.70 | -92.90 |
| Net Cash Inflow / Outflow | 79.00 | 79.90 | -50.70 | 60.30 | 112.60 | 313.40 |
| Opening Cash & Cash Equivalents | 61.00 | 92.60 | 169.90 | 84.70 | 144.90 | 257.50 |
| Closing Cash & Cash Equivalent | 92.60 | 169.90 | 84.70 | 144.90 | 257.50 | 570.90 |
Key Ratios
| Year End March | 2020 | 2021 | 2022 | 2023E | 2024E | 2025E |
|---|---|---|---|---|---|---|
| Basic EPS | 29.60 | 30.50 | 48.80 | 67.30 | 87.30 | 117.50 |
| Diluted EPS | 29.60 | 30.50 | 48.80 | 67.30 | 87.30 | 117.50 |
| DPS | 6.00 | 6.00 | 7.50 | 11.00 | 14.00 | 18.00 |
| Book value (Rs/share) | 158.20 | 181.40 | 222.60 | 267.90 | 341.20 | 440.70 |
| ROCE (%) Post Tax | 17.10% | 14.90% | 19.90% | 22.00% | 23.00% | 25.00% |
| ROE (%) | 18.70% | 16.80% | 21.90% | 25.00% | 26.00% | 27.00% |
| Inventory Days | 50.10 | 56.00 | 53.60 | 54.30 | 53.60 | 54.30 |
| Receivable Days | 62.80 | 59.90 | 46.10 | 45.30 | 45.00 | 45.00 |
| Payable Days | 25.90 | 32.00 | 34.70 | 33.40 | 33.20 | 33.50 |
| PE | 30.90 | 42.00 | 57.40 | 52.50 | 40.50 | 38.00 |
| P/BV | 5.80 | 7.10 | 12.60 | 13.20 | 10.40 | 10.10 |
| EV/EBITDA | 20.40 | 23.70 | 35.50 | 34.30 | 27.30 | 26.10 |
| Dividend Yield (%) | 0.70% | 0.50% | 0.30% | 0.30% | 0.40% | 0.40% |
| P/Sales | 3.70 | 4.60 | 6.40 | 6.60 | 5.30 | 5.20 |
| Net debt/Equity | 0.40 | 0.40 | 0.40 | 0.30 | 0.20 | 0.10 |
| Net Debt/ EBITDA | 1.40 | 1.20 | 1.00 | 0.80 | 0.50 | 0.20 |
| Sales/Net FA (x) | 2.00 | 2.00 | 2.80 | 3.00 | 3.20 | 3.60 |