Redington (India) Ltd
Trading
Redington (India) Ltd
Trading
Stock Info
Shareholding Pattern
Price performance
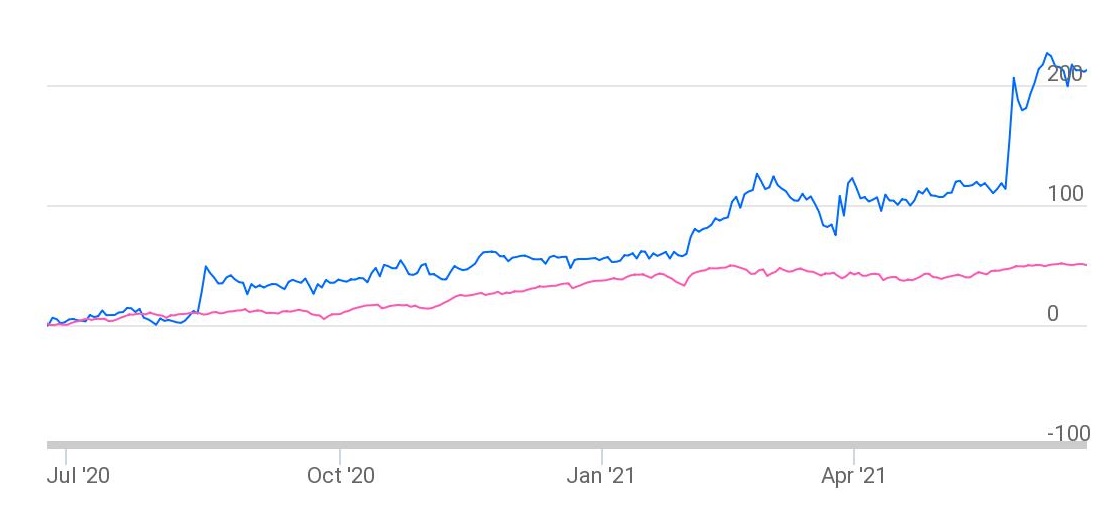
Indexed Stock Performance

Leading Distributor of IT Hardware and Mobility Products
Company Profile
Incorporated in 1993, Redington India Limited (Redington) is a leading distributor
of IT hardware and mobility products. It commenced operations in Chennai with the
distribution of HP peripherals and currently operates in 37 markets across India,
Middle East, Africa, Turkey, Singapore, and South Asia region through the network
of 70+ sales offices, 205+ warehouses, and an employee base of ~4,000. The company
offers a wide range of products, including PCs, mobile phones, packaged software,
storage, printers, scanners, and so on. The company not only sells items, but also
provides after-sale and post-warranty services to vendors and consumers, making
it a value-added distributor. It distributes 235+ brands through a huge network
of 33,950+ channel partners. While the distribution of IT and mobility products
accounts for most of the company’s revenue, it is also expanding its logistical
operations (ProConnect) in India and the Gulf.
Investment Rationale
Strong Market Position with Global Presence
Redington has a strong market position in IT products and mobility distribution
in India with a major share in domestic IT distribution market. It is also a market
leader in Middle East, Africa, Turkey, Singapore, and South Aisa region. Redington
had a first-mover advantage when it started doing business in the MEA region since
those economies were in the early stages of development at the time, and the government
infrastructure expenditure provided good market potential and greater margins for
the company. This enabled it to establish a global footprint. In addition to IT
products, the company is a major distributor of smartphones in the mobility industry.
The company's market position in both business areas is based on its capacity to swiftly expand its vendor list, as well as its varied product portfolio, strong distribution infrastructure, and well-established relationships with channel partners. This has put Redington in a good position to increase sales, thanks to strong demand for IT products and services.
Diversified Revenue Mix with Strong Relationships with Leading Vendors
The company generates revenue from three areas: IT, Mobility, and Services.
IT segment can further be divided into IT consumer and IT enterprise sub-segments.
The company distributes PCs, laptops, printers, print supplies, digital print solutions,
and other consumer lifestyle products under the IT consumer segment, while the IT
enterprise segment handles networking, software, servers & storage, security,
and licensing & subscription. The mobility segment is focused on smartphones,
while the service business, which contributed 1% to the top line in FY21, is focused
on warehousing, logistics, and after-sales service.
Redington began as an HP vendor in 1993 and has come a long way since then, partnering with over 235 brands. Some of the global giants with whom the company has maintained a strong relationship include Apple, HP, Dell, Lenovo, Samsung, Cisco, Microsoft, and Google, among others. The company's collaborations with such brands have aided its growth trajectory, and given its leadership position, the company is expected to maintain strong relationships in the coming years.
Strong Risk Management Practices
The company has adapted strong risk management practices for the risks arising from
distribution business. The vendor concentration risk is mitigated from the diversified
vendor base of the company regarding distribution of products of 235+ brands. The
company’s portfolio of diversified brands and diversified product categories
under the same brand also helps it to mitigate revenue concentration risk. To mitigate
the foreign currency risk, the company hedges all exposures which results in consistent
business performance despite fluctuating currencies. Further, the company takes
measures like collection of post-dated cheques, strict internal parameters for overdues
and bad debts, etc. which has resulted in average receivables provisioning at 0.10%
of revenue since last decade. Its robust Management Information System (MIS) helps
to keep track of the credit history of its channel partners. In addition, the company
keeps a sizable amount of cash on hand to ensure the continuation of operations,
particularly in volatile international markets.
Strong Financial Performance
The company’s top line has grown at a CAGR of ~10% during FY16 – FY21.
During the same period, its operating and PAT margins have remained intact; PAT
has grown at CAGR of 12.3%. During FY21, the top line has grown at 10.6% YoY aided
by growth in domestic (+22% YoY) as well as overseas market (+4% YoY). Its operating
and PAT margins have also seen an uptick of 24bps and 33 bps, respectively in FY21
on the back of scale and cost control measures. The company has also reduced its
debt by Rs. 2,159 crores in FY21 and currently, its debt/equity ratio stands at
0.12x vs. 0.64x in FY20. Interest coverage ratio has also improved to 6.6x vs. 4.5x
in FY20.
Further, supported by improved earnings and better WC management, the company’s liquidity position is strong with cash and cash equivalents at Rs. 3,492.97 crores as of 31st March, 2021. This year, the company’s dividend pay-out was 60% vs. average of ~33% in the last five years including special dividends. The management said, going forward, on a steady state, the company will step dividend up to ~40%. Backed by the growing opportunities in India and in Middle East, Turkey, and Africa (META), the financial performance of the company is expected to sustain.
Outlook and Valuation
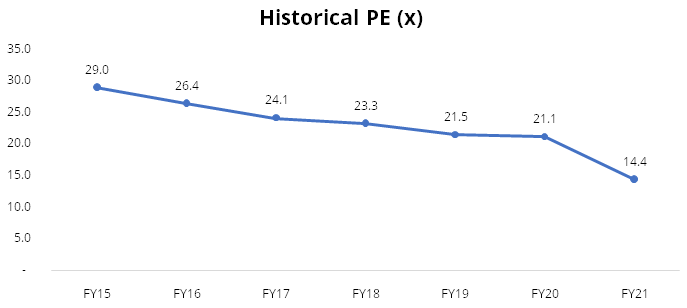
Though there could be some short-term hiccups due to second wave of covid-19 as well as shortage of chips and components, the management is confident to outperform the industry by at least +2-3%. On the logistics business, the management is committed to invest, grow, and accelerate the pace of growth over the next few years. Further, cloud & managed services business is also expected to grow in the coming years and aid margin profile. At the current market price of Rs. 280, the stock is trading at 9.5x of FY23E earnings.

Technical

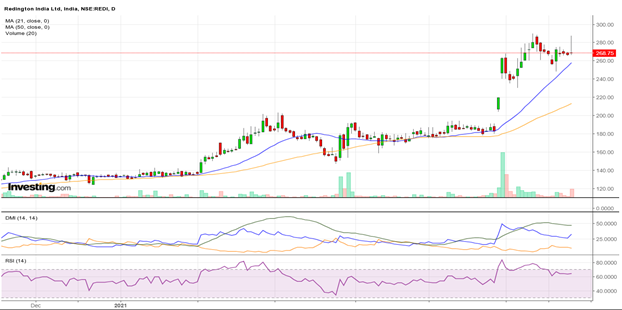
Price: REDINGTON INDIA has gained around 2.34% on monthly chart. Stock took support around Rs.240 – Rs.245, which also ended short term down trend in the stock from the high of Rs.289.80 recorded on 10 June, 2021 indicating its long term uptrend has resumed after cyclical correction. The stock has bounced from the support level with increase in volume which indicates the strength in the counter. The stock is making higher low on daily chart, which is giving bullish stance. The Parabolic SAR (Stop & Reverse) on daily chart is also below the trading price, suggesting northward momentum is likely to remain intact in the counter.
Indicator: Currently the stock is in uptrend and trading well above its 21 & 50 SMA levels on daily and weekly chart exhibiting strength. Among the indicators and oscillators, the 14-day RSI has already given a positive crossover with 9-day signal line on daily chart and is poised with bullish bias, clearly indicating the bullish trend in the stock is likely to continue and the counter is expected to head higher in the near term
Volume: Price and volume analysis plays an important part in determining overall strength or weakness in the stock. Price and volume pattern are moving in the same direction which reflects the true movements in the stock. REDINGTON stock has seen the profit booking with thin volume, which conforms the movement of this stock is on bullish side.
Conclusion: The recent price action suggests that the positive momentum in the stock is likely to continue and the counter is expected to trade higher in the coming sessions. Thus, we recommend buying the stock for the targets of Rs.345.00 and add further on any dip with a stop loss below Rs.244 levels.