
Prince Pipes & Fittings Ltd
Pipes - Plastic
Prince Pipes & Fittings Ltd
Pipes - Plastic
Stock Info
Shareholding Pattern
Price performance
Indexed Stock Performance

Transforming into a reputed and leading brand
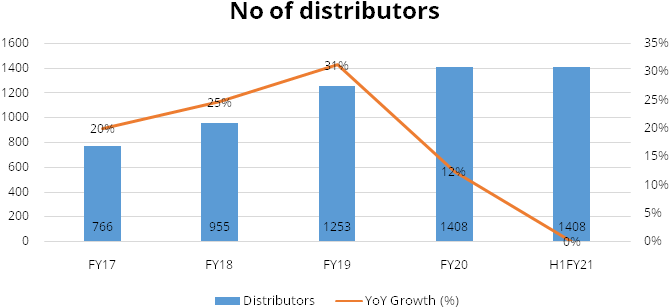
Prince Pipes is recognized as one of the leading polymer pipes and fittings manufacturers in India in terms of number of distributors. It markets its products under two brand names: Prince Piping Systems and Trubore. Due to its comprehensive product range, it is positioned as an end-to-end polymer piping systems solution provider. It has more than 30 years’ experience in the polymer pipes segment. It currently manufactures polymer pipes using four different polymers: UPVC; CPVC; PPR; and HDPE, and fittings using three different polymers: UPVC; CPVC; and PPR. As of September 30, 2020, it had a product range of 7,167 SKUs. Its products are used for various applications in plumbing, irrigation, and soil, waste and rain water (“SWR”) management. Its product range meets the requirements of both the rural and urban markets. The company distributes its products from its seven plants and 11 warehouses. The company’s warehouses are managed by clearing and forwarding agents. It sells its Prince Piping Systems products to distributors, who then resell the products to wholesalers, retailers, and plumbers. As at September 30, 2020, the company sold Prince Piping Systems products to 1408 distributors in India. It sells its Trubore products directly to wholesalers and retailers.
Investment Rationale
Strong brands in the pipes and fittings segment with over 30 years’ experience
Prince Pipes has a strong legacy of more than three decades in the polymer pipes
segment. The company markets its products under two brand names: Prince Piping Systems;
and Trubore (which it acquired in October 2012). It has an advantage of being one
of the leading organised players in this highly fragmented market with market share
of approximately 5% in FY20. The fittings segment typically earns higher margins
due to the specialised nature and precision required vis-à-vis the pipes
segment. The company’s strong brands enabled it to increase its market share
in the fittings segment.
Comprehensive product portfolio with new product launches at regular intervals
The Company has a comprehensive product portfolio and is positioned not just as
a pipe manufacturer but also as an end-to-end piping systems supplier. It currently
manufactures polymer pipes using four different polymers: UPVC; CPVC; PPR; and HDPE,
and fittings using three different polymers: UPVC; CPVC; and PPR. It has different
stock keeping units for different products under each polymer type. Its products
are used for various applications in the fields of plumbing, irrigation, and SWR
(soil, waste and rain) management.
Strategically located manufacturing facilities with a core focus on quality
The size of the pipes being large results in high transportation cost. The company
has a competitive advantage in this respect as it has established six manufacturing
facilities (located in proximity to its buyers) in: Athal and Dadra (both located
in the Union Territory of Dadra and Nagar Haveli); Haridwar (Uttarakhand); Chennai
(Tamil Nadu); Kolhapur (Maharashtra) and Jobner (Rajasthan). The company uses five
contract manufacturers to increase market penetration in North, West and South India.
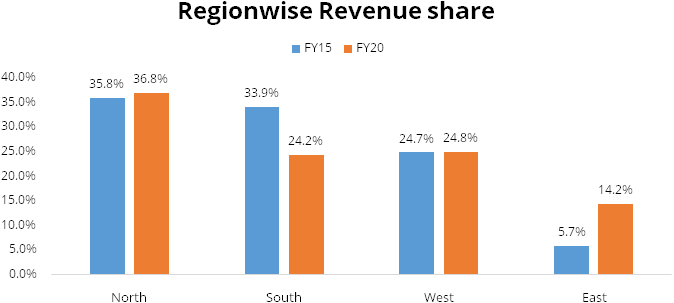
For FY20, sales in North, South, West and East India represented 36.8%, 24.2%, 24.8%
and 14.2% of revenue from operations, respectively.
Partnership and Technical collaboration with reputed international players
The partnership with US-based Lubrizol (World’s largest manufacturers of CPVC
compounds) shall lead to several opportunities for the company going forward such
as i) sourcing of best-in-class quality CPVC compound from Lubrizol to enable the
company to market and sell superior quality CPVC pipes and fittings in the country
ii) higher acceptability into projects (B2B) with FlowGuard being specified by most
plumbing consultants and real estate developers.
New capacity expansion would drive higher growth
The Company plans to set up a new integrated manufacturing pipe and fittings facility
in Sangareddy (Telangana), with a total estimated installed capacity of ~50,000
tonnes per annum. It plans to commence production at the Telangana plant in Q4FY21.
Currently, the company’s clients in South India are catered to by its plants
in Athal and Haridwar. The opening of the Telangana plant will bolster their distribution
reach and market penetration in Southern India and will enable them to compete in
these markets more effectively.
Outlook & Valuation
We believe the company will capitalize on growth opportunities supported by strong growth traction in CPVC pipe segment, new product launches and superior product mix. Further we expect strong re-rating of the stock going forward considering substantial improvement in corporate governance, reduction in debt position and competitive edge in the market it operates into. Further we have a positive outlook for the company based on parameters such as healthy earnings profile, strong distribution network, and robust return ratios. The company is currently trading at 18.1x FY23E EPS, and we maintain Hold on the company.
Consolidated Financial Statements
| Rs in Crores | Revenue | EBITDA | EBITDA% | PAT | EPS | ROE% | PER | EV/EBITDA |
|---|---|---|---|---|---|---|---|---|
| FY18 | 1315.00 | 163.00 | 12.00% | 73.00 | 8.10 | 23.00% | 0.00 | 0.00 |
| FY19 | 1572.00 | 184.00 | 12.00% | 82.00 | 9.10 | 21.00% | 0.00 | 0.00 |
| FY20 | 1636.00 | 229.00 | 14.00% | 113.00 | 10.20 | 13.00% | 10.00 | 4.90 |
| FY21E | 1871.00 | 304.00 | 16.00% | 179.00 | 16.20 | 18.00% | 24.30 | 14.10 |
| FY22E | 2190.00 | 349.00 | 16.00% | 205.00 | 18.70 | 17.00% | 21.10 | 12.40 |
| FY23E | 2569.00 | 404.00 | 16.00% | 240.00 | 21.80 | 18.00% | 18.10 | 9.90 |
Investment Rationale
Strong brands in the pipes and fittings segment with over 30 years’ experience
Prince Pipes has a strong legacy of more than three decades in the polymer pipes
segment. It has an advantage of being one of the leading organised players in this
highly fragmented market with market share of approximately 5% in FY20. The fittings
segment typically earns higher margins due to the specialised nature and precision
required vis-à-vis the pipes segment. The company’s strong brands enabled
it to increase its market share in the fittings segment.
The company markets its products under two brand names: Prince Piping Systems and Trubore. Prince piping brands currently sells its widest range of products and this brand accounted for over 90% of its overall revenues in FY20. The company acquired Trubore brand in October 2012 and its products are currently sold in South India, primarily in Tamil Nadu. The company plans to increase sales of Trubore brand products by increasing marketing efforts and the number of wholesalers and retailers. The company’s aim is to diversify their Trubore brand initially in all other states in South India and then gradually expand in North, East and West India, thereby, making Trubore brand a Pan-India brand in the next three or four years. Trubore brand accounted for less than 10% of its overall revenues in FY20.
Comprehensive product portfolio with new product launches at regular intervals
The Company has a comprehensive product portfolio and is positioned not just as
a pipe manufacturer but also as an end-to-end piping systems supplier. It currently
manufactures polymer pipes using four different polymers: UPVC; CPVC; PPR; and HDPE,
and fittings using three different polymers: UPVC; CPVC; and PPR. It has different
stock keeping units for different products under each polymer type. Its products
are used for various applications in the fields of plumbing, irrigation, and SWR
(soil, waste and rain) management.
In 2018, the company was amongst the first ones to expand its reach from above-the-ground applications to underground drainage (UGD) application by entering into HDPE segment with manufacturing of DWC pipes at its Haridwar unit. With tremendous opportunities in underground drainage systems, the company also aims to launch inspection chambers, manhole and chamber covers by end-FY22. This will enable the company to complete its range of offering (with its existing presence in solid wall pipes and DWC pipes) in UGD systems.
Furthermore, the company has diversified its presence into the water storage space by launching three layered overhead storage solutions under the brand name ‘Prince STOREFIT’. Storefit – Paani Ka Bank range of overhead water tanks were launched in capacities of 500, 750, 1000, 1500, 2000 and 3000 litres with a 5-year warranty. The products offer unique features and benefits like UV Stabilisation, air ventilator that allow water to breathe [to the natural oxygen level] and stay fresh, avoid deformations, UV protection cover, Antimicrobial with an inner layer added with silver based antimicrobial agent which prevents bacteria growth and keeps water fresh. The company expects to leverage its multi-location manufacturing footprint (being a highly freight sensitive product) and its existing distribution network to efficiently market this product and become a meaningful player in the segment.
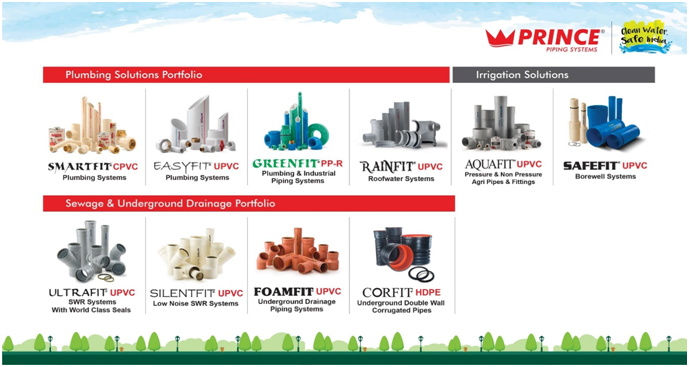
Exhibit 1: Multi-Purpose Plumbing products
Strategically located manufacturing facilities with a core focus on quality
The size of the pipes being large results in high transportation cost. The company
has a competitive advantage in this respect as it has established six manufacturing
facilities (located in proximity to its buyers) in: Athal and Dadra (both located
in the Union Territory of Dadra and Nagar Haveli); Haridwar (Uttarakhand); Chennai
(Tamil Nadu); Kolhapur (Maharashtra) and Jobner (Rajasthan). The company uses five
contract manufacturers to increase market penetration in North, West and South India.
While the company has no manufacturing plants in East India, it has a unique outsourcing
strategy wherein it procures PVC as well as DWC pipes from two players (one each
in Bihar and Odisha) for catering to East India market.
The company has stronghold in Northern India due to early entry into that region. This has led to its strong penetration and brand equity in the region which contributed 37% to its overall revenues in FY20. Further the company has set up another plant in Jaipur in FY20, which will enable them to further gain market share in the region. We believe this region to remain the largest contributor to its overall revenues going forward as well.
Large & growing Pan-India distribution network
The Company sells its products to distributors, who then resell the products to
wholesalers, retailers, and plumbers. It sells its Trubore products directly to
wholesalers and retailers. The company has a Pan-India network of distributors for
Prince Piping Systems products and a network of wholesalers and retailers for its
Trubore brand products in South India.
Partnership and Technical collaboration with reputed international players
The partnership with US-based Lubrizol (World’s largest manufacturers of CPVC
compounds) shall lead to several opportunities for the company going forward such
as i) sourcing of best-in-class quality CPVC compound from Lubrizol to enable the
company to market and sell superior quality CPVC pipes and fittings in the country
ii) premium brand positioning in CPVC pipe segment across the value chain could
have a ripple effect on the positioning of its PVC product portfolio as well Higher
acceptability into projects (B2B) with FlowGuard being specified by most plumbing
consultants and real estate developers iii) cross selling of CPVC pipes through
its existing robust distribution network (B2C) along with its PVC piping products.
The company has done tie-up with Tooling Holland which would enable them to offer superior products, aligned to global standards and at competitive costs. Furthermore, it would also improve productivity, cost efficiency and leverage their strong forte towards research & innovation right from designing to mould manufacturing aimed at offering a superior product. The company has also done collaboration with Wavin Overseas B.V, a company headquartered in Zwolle in The Netherlands. Wavin provides the company with technology and know-how to improve manufacturing efficiency and quality of its products.
New capacity expansion would drive higher growth
The Company plans to set up a new integrated manufacturing pipe and fittings facility
in Sangareddy (Telangana), with a total estimated installed capacity of ~50,000
tonnes per annum. It plans to commence production at the Telangana plant in Q4FY21.
Currently, the company’s clients in South India are catered to by its plants
in Athal and Haridwar. The opening of the Telangana plant will bolster their distribution
reach and market penetration in Southern India and will enable them to compete in
these markets more effectively.
We expect logistic and operational cost savings to occur with Telangana facility able to service other South India markets. Further we believe major cost savings to accrue for PVC fittings which was earlier serviced from its Haridwar facility.
Financials
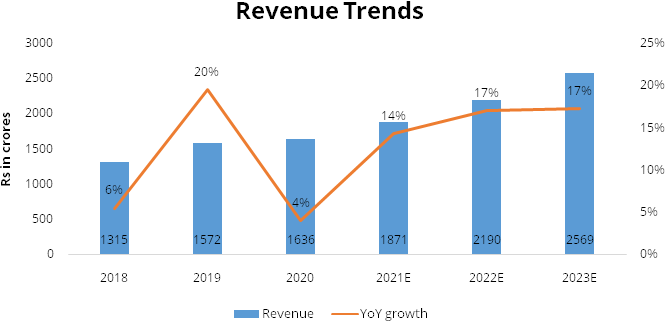
Revenue is expected to grow @~ 16% CAGR over FY20-FY23E
We expect the company’s consolidated revenue to grow at ~16% CAGR over FY20-FY23E
to Rs 2569 crores majorly supported by i) robust volume growth led by impressive
distribution expansion ii) introduction of innovative products iii) cross-selling
of CPVC products in secondary channel. Further, we believe market share gains in
plumbing and SWR segment led by enhanced distribution reach will provide impetus
to revenue growth.
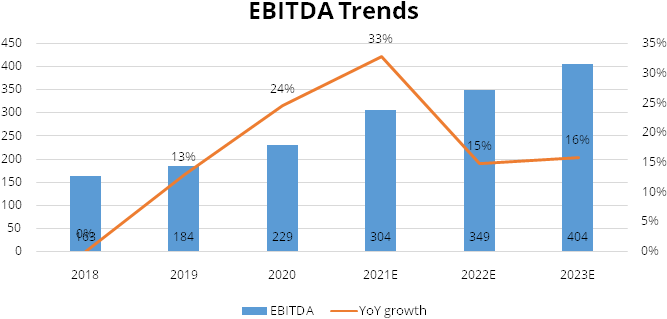
EBITDA is expected to grow @~ 21% CAGR over FY20-FY23E
We expect EBITDA to grow at ~21% CAGR over FY20-FY23E to Rs 404 crores and EBITDA
margins to expand by 200 bps to 16% over FY20-FY23E aided by better pricing power
considering the market consolidation tailwinds ii) favourable product mix tilting
more towards plumbing portfolio post their Lubrizol tie-up iii) robust volume growth
led to healthy operating leverage benefit.
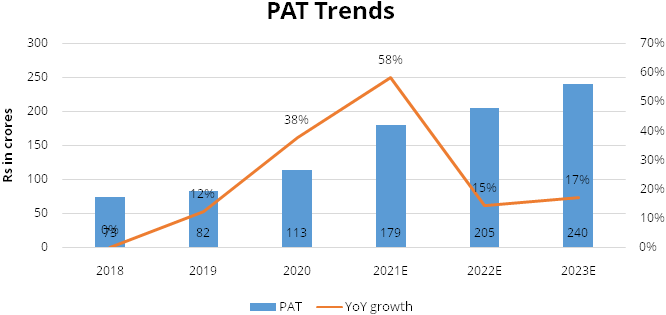
Net Profit is expected to grow @~ 29% CAGR over FY20-FY23E
We expect Net profit to grow at ~29% CAGR over FY20-FY23E to Rs 240 crores and PAT
margins to expand by 200 bps to 9% over FY20-FY23E aided by higher other income
and lower interest expense and robust revenue growth.
Industry
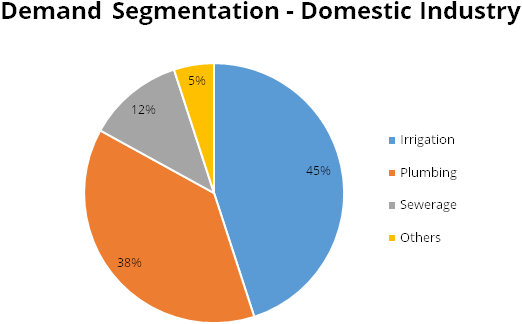
The Indian PVC pipes and fittings market is expected to register 15% CAGR in revenue during FY18 - FY26. The domestic plastic pipes industry size at ~ Rs 31500 crores while organized players account for ~60% market share. The key features of plastic pipes against other pipes are Lightweight, Ease of transportation - Longer life span whereas key growth drivers are as follows: - i) Government’s push for cleanliness and sanitation to boost water management sector ii) Increased Building of affordable houses and growing housing demand iii) Requirement for infrastructure for irrigation and water supplies.
Business Segments
UPVC pipes: These pipes find application in agriculture and plumbing for
potable water supply and sewerage. Continuous replacement of galvanised iron pipes
with these pipes has supported healthy demand growth in the past. Features such
as affordability and longer life compared with metal pipes have aided this segment.
CPVC pipes: These pipes are primarily used in plumbing applications, as well as hot and cold, potable water distribution systems. Demand growth for this segment over the past five Fiscal years (i.e., April 1, 2015, to March 31, 2020) has been the highest among pipes, as CPVC pipes in India are still at a nascent stage and have huge potential due to factors such as longevity, corrosion free, fire resistant, being lead-free, and the ability to withstand high temperatures.
HDPE pipes: These pipes are used in the irrigation sector, sewerage and drainage, city-gas distribution and in chemical and processing industries. HDPE pipes account for ~15% share in the total plastic pipes industry. These pipes have been gaining prominence over traditional metal and cement pipes, due to durability, low maintenance and longevity versus metal pipes.
PPR pipes: These pipes account for a mere 5% of the total plastic pipes demand. These pipes, which are used for various industrial purposes, are relatively costly compared with other plastic pipes, which restricts their usage.
Peer comparison
We have compared the company with its listed peers- Astral Polytechnic and Supreme
Industries. In comparison to peers, the company’s sales growth in FY19/FY20
was higher aided by progressive improvement in its brand equity and improving proximity
to markets. However, during the FY18 the company reported muted growth versus its
peers.
| Sales growth | FY16 | FY17 | FY18 | FY19 | FY20 |
|---|---|---|---|---|---|
| Prince Pipes | 5.22% | 23.73% | 5.00% | 20.00% | 4.00% |
| Astral Pipes | 19.01% | 12.93% | 9.39% | 20.94% | 2.83% |
| Supreme Ind | 7.2% | 13.08% | 11.36% | 12.94% | -1.80% |
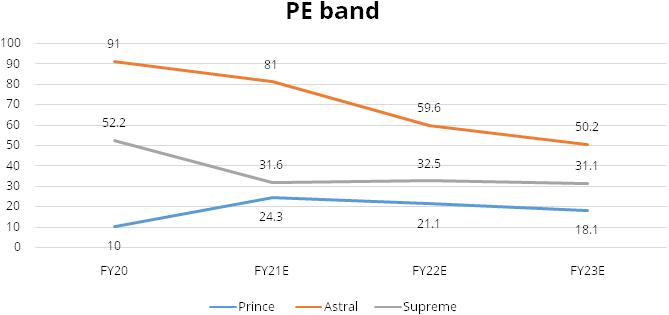
Further in comparison to its peers like Astral pipes & Supreme Industries which is trading at PE of 50x/31x on FY23E basis we believe the re-rating potential of the stock is huge.
Furthermore, as far as margins are concerned, the company’s EBITDA margins have grown led by superior product mix and operating leverage. Sourcing of low cost CPVC resin and brand monetisation strategy has led to material improvement in its margins in FY20.
| EBITDA Margins | FY16 | FY17 | FY18 | FY19 | FY20 |
|---|---|---|---|---|---|
| Prince Pipes | 11.30% | 16.90% | 14.90% | 14.40% | 17.00% |
| Astral Pipes | 14.00% | 16.80% | 15.20% | 14.50% | 18.50% |
| Supreme Ind | 20.90% | 22.90% | 23.20% | 24.70% | 28.00% |
In comparison to its peers, the company’s fixed asset turnover has been higher than peers aided by outsourcing model for a part of its sales. Revenue from outsourced sales constituted 5% of its overall revenues in FY20.
| Net Fixed Asset turnover | FY16 | FY17 | FY18 | FY19 | FY20 |
|---|---|---|---|---|---|
| Prince Pipes | 4.20 | 4.60 | 4.30 | 4.40 | 3.80 |
| Astral Pipes | 3.90 | 3.70 | 3.40 | 3.00 | 2.60 |
| Supreme Ind | 2.50 | 3.50 | 3.60 | 3.70 | 3.30 |
Risks & Concerns
- Reduction in activity in the agriculture/construction segment Demand for products relating to irrigation is affected by the level of growth in the agriculture segment in India. Any reduction in the activity in the agriculture/construction segment could have a material adverse effect on its business, results of operations and demand for plumbing and sewage products.
- Highly competitive markets The markets in which it sells its products are highly competitive and the company faces significant competition from organized and unorganized pipe manufacturers.
- Increase in the cost of raw materials The Company’s primary raw materials like UPVC, CPVC, PPR and HDPE resins are bi-products of crude oil. Any increase in crude prices shall lead to increase in raw material costs.
Outlook & valuation
We believe the company will capitalize on growth opportunities supported by strong growth traction in CPVC pipe segment, new product launches and superior product mix. Further we expect strong re-rating of the stock going forward considering substantial improvement in corporate governance, reduction in debt position and competitive edge in the market it operates into. Further we have a positive outlook for the company based on parameters such as healthy earnings profile, strong distribution network, and robust return ratios. The company is currently trading at 18.1x FY23E EPS, and we maintain Hold on the company.
Financial Statement
Profit & Loss statement
| Yr End March (Rs Cr) | 2018 | 2019 | 2020 | 2021E | 2022E | 2023E |
|---|---|---|---|---|---|---|
| Net Sales | 1315.00 | 1572.00 | 1636.00 | 1871.00 | 2190.00 | 2569.00 |
| Growth % | 5.00% | 20.00% | 4.00% | 14.00% | 17.00% | 17.00% |
| Expenditure | ||||||
| Material Cost | 921.00 | 1127.00 | 1124.00 | 1244.00 | 1472.00 | 1747.00 |
| Employee Cost | 68.00 | 78.00 | 86.00 | 98.00 | 109.00 | 127.00 |
| Other Expenses | 162.00 | 183.00 | 197.00 | 225.00 | 260.00 | 291.00 |
| EBITDA | 163.00 | 184.00 | 229.00 | 304.00 | 349.00 | 404.00 |
| Growth % | 13.00% | 24.00% | 33.00% | 15.00% | 16.00% | |
| EBITDA Margin | 12.00% | 12.00% | 14.00% | 16.00% | 16.00% | 16.00% |
| Depreciation & Amortization | 38.00 | 44.00 | 52.00 | 59.00 | 65.00 | 74.00 |
| EBIT | 125.00 | 140.00 | 177.00 | 245.00 | 284.00 | 330.00 |
| EBIT Margin % | 10.00% | 9.00% | 11.00% | 13.00% | 13.00% | 13.00% |
| Other Income | 6.00 | 7.00 | 7.00 | 18.00 | 12.00 | 10.00 |
| Interest & Finance Charges | 36.00 | 36.00 | 33.00 | 24.00 | 22.00 | 20.00 |
| Profit Before Tax | 95.00 | 111.00 | 151.00 | 239.00 | 274.00 | 320.00 |
| Tax Expense | 22.00 | 29.00 | 38.00 | 60.00 | 69.00 | 81.00 |
| Effective Tax rate | 24.00% | 26.00% | 25.00% | 25.00% | 25.00% | 25.00% |
| Net Profit | 73.00 | 82.00 | 113.00 | 179.00 | 205.00 | 240.00 |
| Growth % | -2.00% | 13.00% | 37.00% | 59.00% | 15.00% | 17.00% |
| Net Profit Margin | 6.00% | 5.00% | 7.00% | 10.00% | 9.00% | 9.00% |
| Consolidated Net Profit | 73.00 | 82.00 | 113.00 | 179.00 | 205.00 | 240.00 |
| Growth % | -2.00% | 13.00% | 37.00% | 59.00% | 15.00% | 17.00% |
| Net Profit Margin after MI | 6.00% | 5.00% | 7.00% | 10.00% | 9.00% | 9.00% |
Balance Sheet
| Yr End March (Rs Cr) | 2018 | 2019 | 2020 | 2021E | 2022E | 2023E |
|---|---|---|---|---|---|---|
| Share Capital | 90.00 | 90.00 | 110.00 | 110.00 | 110.00 | 110.00 |
| Total Reserves | 226.00 | 307.00 | 725.00 | 889.00 | 1077.00 | 1296.00 |
| Shareholders' Funds | 317.00 | 399.00 | 838.00 | 1001.00 | 1189.00 | 1409.00 |
| Minority Interest | 0.00 | 0.00 | 0.00 | 0.00 | 0.00 | 0.00 |
| Non Current Liabilities | ||||||
| Long Term Burrowing | 146.00 | 106.00 | 39.00 | 39.00 | 29.00 | 19.00 |
| Deferred Tax Assets / Liabilities | 13.00 | 15.00 | 13.00 | 13.00 | 13.00 | 13.00 |
| Long Term Provisions | 7.00 | 8.00 | 11.00 | 11.00 | 11.00 | 11.00 |
| Current Liabilities | ||||||
| Short Term Borrowings | 170.00 | 146.00 | 204.00 | 81.00 | 81.00 | 81.00 |
| Trade Payables | 197.00 | 215.00 | 181.00 | 250.00 | 278.00 | 326.00 |
| Other Current Liabilities | 104.00 | 128.00 | 99.00 | 83.00 | 83.00 | 83.00 |
| Short Term Provisions | 4.00 | 94.00 | 110.00 | 110.00 | 110.00 | 110.00 |
| Total Equity & Liabilities | 980.00 | 1126.00 | 1513.00 | 1606.00 | 1812.00 | 2070.00 |
| Assets | ||||||
| Net Block | 345.00 | 363.00 | 489.00 | 530.00 | 605.00 | 651.00 |
| Non Current Investments | 1.00 | 1.00 | 1.00 | 1.00 | 1.00 | 1.00 |
| Long Term Loans & Advances | 74.00 | 65.00 | 60.00 | 60.00 | 60.00 | 60.00 |
| Current Assets | ||||||
| Currents Investments | 0.00 | 0.00 | 157.00 | 257.00 | 257.00 | 257.00 |
| Inventories | 242.00 | 201.00 | 345.00 | 168.00 | 306.00 | 391.00 |
| Sundry Debtors | 239.00 | 250.00 | 180.00 | 250.00 | 300.00 | 359.00 |
| Cash and Bank | 10.00 | 22.00 | 100.00 | 158.00 | 101.00 | 169.00 |
| Short Term Loans and Advances | 37.00 | 133.00 | 152.00 | 152.00 | 152.00 | 152.00 |
| Total Assets | 980.00 | 1126.00 | 1513.00 | 1606.00 | 1812.00 | 2070.00 |
Cash Flow Statement
| Yr End March (Rs Cr) | 2018 | 2019 | 2020 | 2021E | 2022E | 2023E |
|---|---|---|---|---|---|---|
| Profit After Tax | 73.00 | 82.00 | 113.00 | 179.00 | 205.00 | 240.00 |
| Depreciation | 38.00 | 44.00 | 52.00 | 59.00 | 65.00 | 74.00 |
| Others | -21.00 | 13.00 | -258.00 | 0.00 | 0.00 | 0.00 |
| Changes in Working Capital | 4.00 | 61.00 | -365.00 | 175.00 | -160.00 | -96.00 |
| Cash From Operating Activities | 162.00 | 219.00 | -155.00 | 413.00 | 110.00 | 218.00 |
| Purchase of Fixed Assets | -112.00 | -92.00 | -121.00 | -100.00 | -140.00 | -120.00 |
| Free Cash Flows | 50.00 | 127.00 | -275.00 | 313.00 | -30.00 | 98.00 |
| Others | -67.00 | -22.00 | 8.00 | 0.00 | 0.00 | 0.00 |
| Cash Flow from Investing Activities | -170.00 | -105.00 | -111.00 | -100.00 | -140.00 | -120.00 |
| Increase / (Decrease) in Loan Funds | 42.00 | -69.00 | -37.00 | -140.00 | -10.00 | -10.00 |
| Equity Dividend Paid | 0.00 | 0.00 | -11.00 | -13.00 | -14.00 | -17.00 |
| Others | -37.00 | -36.00 | 305.00 | 0.00 | 0.00 | 0.00 |
| Cash from Financing Activities | 6.00 | -105.00 | 257.00 | -155.00 | -27.00 | -30.00 |
| Net Cash Inflow / Outflow | -2.00 | 9.00 | -9.00 | 158.00 | -57.00 | 68.00 |
| Opening Cash & Cash Equivalents | 3.00 | 0.00 | 9.00 | 0.00 | 158.00 | 101.00 |
| Closing Cash & Cash Equivalent | 0.00 | 9.00 | 0.00 | 158.00 | 101.00 | 169.00 |
Key Ratios
| Yr End March | 2018 | 2019 | 2020 | 2021E | 2022E | 2023E |
|---|---|---|---|---|---|---|
| Basic EPS | 8.10 | 9.10 | 10.20 | 16.20 | 18.70 | 21.80 |
| Diluted EPS | 8.10 | 9.10 | 10.20 | 16.20 | 18.70 | 21.80 |
| Cash EPS (Rs) | 12.30 | 13.90 | 14.90 | 21.60 | 24.60 | 28.50 |
| DPS | 0.00 | 0.00 | 1.00 | 1.10 | 1.30 | 1.50 |
| Book value (Rs/share) | 35.10 | 44.10 | 75.90 | 91.00 | 108.10 | 128.00 |
| ROCE (%) Post Tax | 17.00% | 17.00% | 16.00% | 18.00% | 18.00% | 18.00% |
| ROE (%) | 23.00% | 21.00% | 13.00% | 18.00% | 17.00% | 18.00% |
| Inventory Days | 57.70 | 51.40 | 60.90 | 50.00 | 39.50 | 49.50 |
| Receivable Days | 66.10 | 56.90 | 48.00 | 41.90 | 45.80 | 46.80 |
| Payable Days | 41.50 | 47.90 | 44.20 | 42.00 | 44.00 | 42.90 |
| PE | 0.00 | 0.00 | 10.00 | 24.30 | 21.10 | 18.10 |
| P/BV | 0.00 | 0.00 | 1.30 | 4.30 | 3.60 | 3.10 |
| EV/EBITDA | 2.20 | 1.50 | 4.90 | 14.10 | 12.40 | 9.90 |
| Dividend Yield (%) | 1.00% | 0.00% | 0.00% | 0.00% | ||
| P/Sales | 0.00 | 0.00 | 0.70 | 2.30 | 2.00 | 1.70 |
| Net debt/Equity | 1.10 | 0.70 | 0.00 | 0.00 | 0.00 | 0.00 |
| Net Debt/ EBITDA | 2.20 | 1.50 | 0.00 | -0.10 | 0.00 | -0.80 |
| Sales/Net FA (x) | 4.30 | 4.40 | 3.80 | 3.70 | 3.90 | 4.10 |