Polycab India Ltd
Cable
Polycab India Ltd
Cable
Stock Info
Shareholding Pattern
Price performance
Indexed Stock Performance
The Largest Manufacturer of Wires and Cables in India and One of the Fastest Growing Players in the FMEG Space
Company Profile
Incorporated in 1996, Polycab India Ltd. (Polycab) is a leading Electricals brand.
It is the largest manufacturer of Wires and Cables in India and one of the fastest
growing players in the FMEG space. The company manufactures and sells various types
of cables, wires, electric fans, LED lighting and luminaires, switches and switchgears,
solar products, pumps and conduits and accessories. Polycab caters to various public
and private institutions across a diverse set of industries, as well as retail customers
through its B2C business.
Polycab has a strong, pan-India distribution network of over 4,100+ authorized dealers and distributors, who in turn, cater to over 165,000+ retail outlets. It has 23 manufacturing facilities located across the states of Gujarat, Maharashtra, Uttarakhand, and District of Daman. The company puts strong emphasis on backward integration of its manufacturing process and building in-house R&D capabilities to adhere to various national and international quality certifications.
Consolidated Financial Statements
| Particulars (Rs. in Crores) | Net Sales | EBITDA | EBITDAM | PAT | EPS | ROE | P/E | EV/EBITDA |
|---|---|---|---|---|---|---|---|---|
| FY19 | 7985.55 | 952.76 | 11.93% | 499.70 | 35.20 | 17.50% | 20.97 | 11.01 |
| FY20 | 8829.96 | 1135.03 | 12.85% | 759.06 | 50.63 | 19.71% | 14.55 | 9.66 |
| FY21 | 8926.54 | 1161.97 | 13.02% | 882.09 | 58.79 | 18.48% | 23.32 | 17.03 |
| FY22E | 10810.04 | 1477.35 | 13.67% | 994.68 | 66.70 | 17.76% | 29.71 | 19.84 |
| FY23E | 12745.04 | 1779.30 | 13.96% | 1211.58 | 81.25 | 18.19% | 24.39 | 16.13 |
Investment Rationale
Market Leader in Wires & Cables in India
Polycab is the largest wires & cables manufacturer in India with 18%-20% market
share in organised segment and 13–14% of the total market share. It has a
wide customer base across industries such as power, infrastructure, telecom, oil
& gas, railway among others. Its product basket of wires and cables comprises
power, building, control, instrumentation, solar, optical fibre, welding, rubber,
submersible flat & round, railway signalling, and specialty other cables. Strong
emphasis on research and development has helped the company to roll out differentiated
products and earn a competitive advantage over its peers. Wires & Cables is
the largest business segment and contributes ~81% to the top line of the company
as of March 2021.
The company has the largest wires and cables manufacturing capacity having 23 facilities located in the states of Gujarat, Maharashtra, and Uttarakhand, and U.T. Daman. Of these 23 facilities, 19 cater to the manufacturing of wires & cables with the total capacity of 4.1 million kms per year. The segment being the major contributor to the company’s revenue, also commands a higher margin than other business segments owing to its backward integration and better supply chain management.
The government has allocated Rs. 102 lakh crores towards National Infrastructure Plan covering infrastructure development projects such as Smart Cities, Housing for All, and rural electrification projects. With an increase in government spending on infrastructure, demand for the wires and cables industry will also increase. Polycab, being a market leader in the industry, is expected to be a front-runner in the huge opportunity that lies ahead of the industry.
Strong Distribution Network
Polycab has a strong distribution network with market reach spread across the country.
As on March, 2021 the company has over 4,100+ authorized dealers & distributors
(vs. 3,500 as of March 2020), who in turn sell the products to over 165,000 (vs.
1,25,000 as of March 2020) retail outlets and other customers. It has 52 warehouses
(30 in FY20) across states and union territory to support its extensive distribution
network for faster deliveries. The proximity also enables the company to mitigate
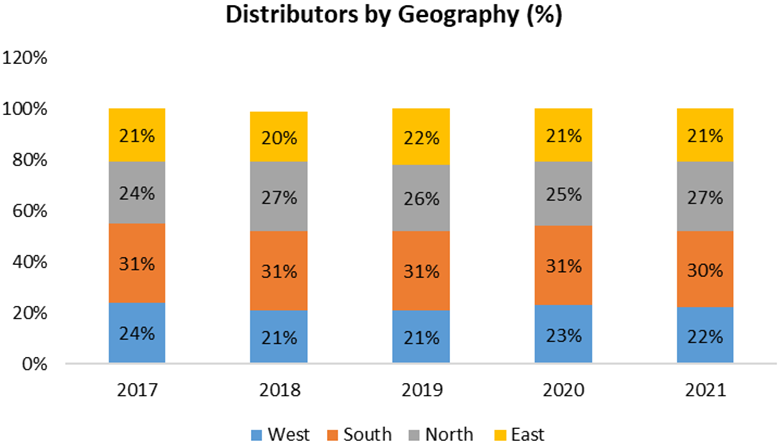
the additional costs of transportation. The distributors across regions are spread
evenly with a bit more weight on southern region (See the chart below):

Source: Corporate Presentations and StockAxis Research
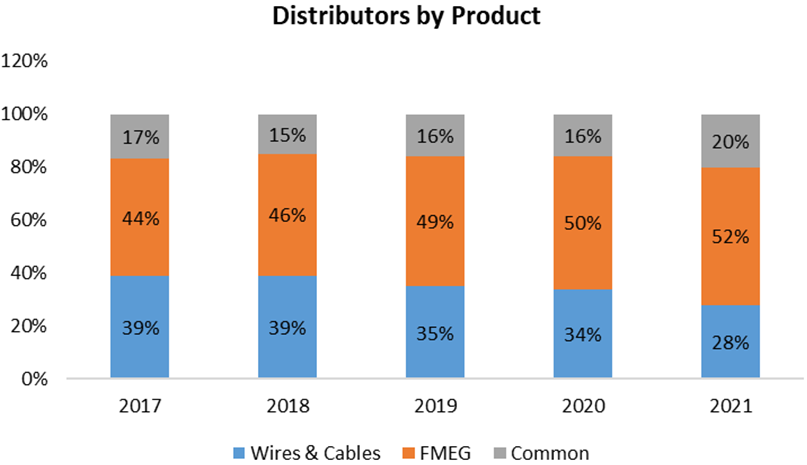
The company has capitalized on its distribution network to rapidly expand its FMEG business within a few years of its launch. Strong relationships provide the company with a competitive edge over its competitors. The following chart sets forth details of distributors by product (See the chart below):

Source: Corporate Presentations and StockAxis Research
The company is also investing significantly in technology such as Bandhan mobile app, dealer order portal, sales force automation software, and automatic storage and retrieval systems in warehouses in order to support its vast distribution network. During FY20, Polycab launched first of its kind Polycab Experience Center to offer a wide range of electrical products under one roof and as of March 2021, the company has 7 of these centers in Cochin, Mumbai, Pune, Trivandrum, Visakhapatnam, Indore, and Ahmedabad. These centers are aimed to increase the company’s brand visibility of its wires and FMEG business.
Growing Fast-Moving Electrical Goods (FMEG) Segment
In FY 2014, the company forayed into FMEG business by launching switches and switchgear
segment. Today, it has expanded its FMEG product range across fans, lighting luminaires,
water heaters, pipes, conduits, agro pumps, solar, etc. Further, to cater to the
changing needs of customers, the company is focusing on investing in new product
launches with an aim to establish itself as a key player in the FMEG business.
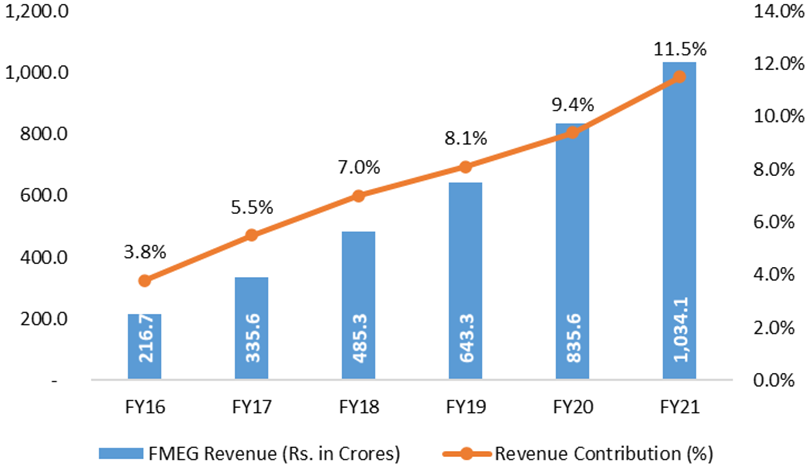
The segment has increased its revenue share from around 4.2% in FY 2016 to 11.7% in FY21 on the back of new product launches and increasing focus on distribution across India. The segment has grown at a CAGR of around 36.7% during FY16 – FY 21 (See the chart below).

Source: Corporate Presentations and StockAxis Research
Polycab has four manufacturing facilities for FMEG products located in Uttarakhand and Maharashtra. It has control over the quality and costs of its products as it manufactures most of the FMEG products in-house. The company is facing competition from the well-established players in the industry. However, by leveraging its existing strong brand recognition and Pan-India distribution network, the company has been able to expand this segment fourfold. There is a huge opportunity in the FMEG business and this segment of the company is expected to help in establishing Polycab, a B2C company by commanding higher market share.
Strong Backward Integration
The Company has a strong manufacturing experience of more than five decades and
over the years it has invested significantly to augment and upgrade its manufacturing
capability. Strategic backward integration remains a key focus of the company which
enables it to maintain full control over quality and supply chain, lower operational
costs, and deliver products at competitive prices.
In 2016, the company entered a 50:50 joint venture with Trafigura Pte Ltd. to set up a manufacturing facility in Waghodia, Gujarat, to produce copper wire rods used in the manufacturing of wires & cables and FMEG products. The Ryker plant has strengthened the backward integration of company’s manufacturing process and fulfils substantial part of its demand for copper wire rods. Further, in FY20, it acquired additional 50% stake in Ryker Base Private Limited, thereby making Ryker a wholly owned subsidiary of the company. This is will strengthen backward integration and working capital management going forward.
Project Leap
During FY21, the company initiated several strategic initiatives which, as per the
company, will underpin performance and augment its market positioning over the long-term.
Over the past decade, Polycab has registered market-leading growth by evolving business
model through diversification of portfolio, building manufacturing capability, creating
strong IT infrastructure, and strengthened brand positioning. These initiatives
have created a platform which has the potential to unlock significant amount of
growth.
Accordingly, the company has now aimed to leverage its competencies to the fullest and took a challenge to realise the future vision over the next five years. Polycab has embarked on a multi-year journey with an aim to cross Rs. 20,000 crores in sales by FY26. This translates into ~18% CAGR over the next five years. This plan will entail a 2x of market growth in the FMEG segment with >12% EBIDTA margins, along with a 1.5x of market growth in the core cable and wire business.
Outlook and Valuation
Polycab is the leading Electricals brand and largest wires & cables manufacturer in India with 18%-20% market share in organised segment and 13–14% of the total market share. Over the past decade, the company has registered market-leading growth by evolving business model through diversification of portfolio, building manufacturing capability, creating strong IT infrastructure, and strengthened brand positioning. The management of the company believes that the consumer sentiment is positive and there could be some pent-up demand in coming quarters. In the medium term, new product launches, an emphasis on premiumisation, and network development should help FMEG revenue expand. Further, under the project Leap, the company is targeting sales of Rs. 20,000 crores, a CAGR of ~18% between FY21-FY26. At the current market price of Rs. 1,982, the stock is trading at 24.4x of FY23E earnings.
Financial Statement
Profit & Loss statement
| Year End March (Rs. in Crores) | 2019 | 2020 | 2021 | 2022E | 2023E |
|---|---|---|---|---|---|
| Net Sales | 7985.55 | 8829.96 | 8926.54 | 10810.04 | 12745.04 |
| Expenditure | |||||
| Material Cost | 5711.66 | 6051.17 | 6498.23 | 7783.23 | 9176.43 |
| Employee Cost | 300.25 | 365.75 | 360.35 | 414.41 | 476.57 |
| Other Expenses | 1683.02 | 1347.66 | 2474.10 | 2768.10 | -9652.99 |
| EBITDA | 952.76 | 1135.03 | 1161.97 | 1477.35 | 1779.30 |
| EBITDA Margin | 11.93% | 12.85% | 13.02% | 13.67% | 13.96% |
| Depreciation & Amortization | 141.45 | 160.89 | 186.57 | 208.96 | 234.03 |
| EBIT | 811.32 | 974.14 | 975.40 | 1268.39 | 1545.27 |
| EBIT Margin % | 10.16% | 11.03% | 10.93% | 11.73% | 12.12% |
| Other Income | 63.78 | 92.79 | 133.23 | 120.00 | 120.00 |
| Interest & Finance Charges | 116.71 | 49.54 | 53.15 | 58.61 | 45.51 |
| Profit Before Tax - Before Exceptional | 758.39 | 1017.40 | 1055.48 | 1329.79 | 1619.76 |
| Profit Before Tax | 758.39 | 1017.40 | 1065.20 | 1329.79 | 1619.76 |
| Tax Expense | 255.76 | 244.37 | 179.05 | 335.11 | 408.18 |
| Effective Tax rate | 33.72% | 24.02% | 16.96% | 25.20% | 25.20% |
| Exceptional Items | - | - | 9.72 | - | - |
| Net Profit | 502.63 | 773.03 | 886.14 | 994.68 | 1211.58 |
| Net Profit Margin | 6.29% | 8.75% | 9.93% | 9.20% | 9.51% |
| Consolidated Net Profit | 499.70 | 759.06 | 882.09 | 994.68 | 1211.58 |
| Net Profit Margin after MI | 6.26% | 8.60% | 9.88% | 9.20% | 9.51% |
Balance Sheet
| As of March (Rs. in Crores) | 2019 | 2020 | 2021 | 2022E | 2023E |
|---|---|---|---|---|---|
| Share Capital | 141.21 | 148.88 | 149.12 | 149.12 | 149.12 |
| Total Reserves | 2690.80 | 3660.68 | 4575.63 | 5421.19 | 6483.66 |
| Shareholders' Funds | 2855.38 | 3851.42 | 4772.77 | 5599.50 | 6661.97 |
| Non Current Liabilities | |||||
| Long Term Borrowing | 88.93 | 10.66 | 103.68 | 98.69 | 58.69 |
| Deferred Tax Assets / Liabilities | 23.10 | 16.48 | 41.80 | 30.00 | 30.00 |
| Long Term Provisions | 16.24 | 25.63 | 25.14 | 25.14 | 25.14 |
| Current Liabilities | |||||
| Short Term Borrowings | 103.07 | 111.45 | 88.96 | 100.00 | 90.00 |
| Trade Payables | 1520.18 | 1353.68 | 1348.03 | 1487.00 | 1774.70 |
| Other Current Liabilities | 807.63 | 401.01 | 525.71 | 469.67 | 469.67 |
| Short Term Provisions | 188.06 | 142.94 | 51.87 | 125.00 | 125.00 |
| Total Equity & Liabilities | 5628.30 | 5960.58 | 7014.70 | 7991.73 | 9291.89 |
| Assets | |||||
| Net Block | 1275.58 | 1422.01 | 1869.60 | 1960.64 | 1976.61 |
| Non Current Investments | 29.39 | 25.48 | 11.82 | 11.82 | 11.82 |
| Long Term Loans & Advances | 199.25 | 218.65 | 202.42 | 210.00 | 210.00 |
| Current Assets | |||||
| Currents Investments | - | 40.00 | 623.13 | 1023.13 | 1023.13 |
| Inventories | 1995.79 | 1924.95 | 1987.91 | 2162.91 | 2581.38 |
| Sundry Debtors | 1334.32 | 1433.64 | 1435.77 | 1595.15 | 1903.77 |
| Cash and Bank | 316.65 | 281.31 | 531.32 | 569.86 | 1126.97 |
| Short Term Loans and Advances | 170.86 | 214.66 | 147.31 | 215.00 | 215.00 |
| Total Assets | 5628.30 | 5960.58 | 7014.70 | 7991.73 | 9291.89 |
Cash Flow Statement
| Year End March (Rs. in Crores) | 2019 | 2020 | 2021 | 2022E | 2023E |
|---|---|---|---|---|---|
| Profit After Tax | 502.63 | 773.03 | 886.14 | 994.68 | 1211.58 |
| Depreciation | 141.45 | 160.89 | 186.57 | 208.96 | 234.03 |
| Changes in Working Capital | 305.32 | -622.41 | 245.78 | -195.41 | -439.39 |
| Cash From Operating Activities | 1229.96 | 244.34 | 1238.22 | 1008.23 | 1006.23 |
| Purchase of Fixed Assets | -286.07 | -290.13 | -193.49 | -300.00 | -250.00 |
| Free Cash Flows | 943.89 | -45.79 | 1044.72 | 708.23 | 756.23 |
| Cash Flow from Investing Activities | -407.73 | -262.25 | -1012.09 | -600.00 | -250.00 |
| Increase / (Decrease) in Loan Funds | -565.06 | -119.41 | -107.51 | -50.00 | -50.00 |
| Equity Dividend Paid | -2.88 | -179.30 | - | -149.12 | -149.12 |
| Cash from Financing Activities | -651.40 | 11.01 | -160.57 | -199.12 | -199.12 |
| Net Cash Inflow / Outflow | 170.83 | -6.90 | 65.56 | 209.11 | 557.11 |
| Opening Cash & Cash Equivalents | 8.23 | 179.06 | 172.16 | 237.72 | 446.83 |
| Closing Cash & Cash Equivalent | 179.06 | 172.16 | 237.72 | 446.83 | 1003.94 |
Key Ratios
| Year End March | 2019 | 2020 | 2021 | 2022E | 2023E |
|---|---|---|---|---|---|
| Basic EPS | 35.20 | 50.63 | 58.79 | 66.70 | 81.25 |
| Diluted EPS | 35.20 | 50.63 | 58.79 | 66.70 | 81.25 |
| Cash EPS (Rs) | 45.17 | 61.36 | 71.23 | 80.72 | 96.94 |
| DPS | 3.00 | 7.00 | 10.00 | 10.00 | 10.00 |
| Book value (Rs/share) | 201.15 | 256.88 | 318.10 | 375.51 | 446.76 |
| ROCE (%) Post Tax | 18.93% | 23.09% | 20.60% | 19.30% | 19.76% |
| ROE (%) | 17.50% | 19.71% | 18.48% | 17.76% | 18.19% |
| Inventory Days | 76.82 | 81.03 | 80.00 | 80.00 | 80.00 |
| Receivable Days | 59.99 | 57.21 | 58.66 | 59.00 | 59.00 |
| Payable Days | 55.82 | 59.40 | 55.24 | 55.00 | 55.00 |
| PE | 20.97 | 14.55 | 23.32 | 29.83 | 24.49 |
| P/BV | 3.69 | 2.89 | 4.34 | 5.30 | 4.45 |
| EV/EBITDA | 11.01 | 9.66 | 17.03 | 19.92 | 16.20 |
| Dividend Yield (%) | 0.00 | 0.01 | 0.01 | 0.01 | 0.01 |
| P/Sales | 1.32 | 1.26 | 2.32 | 2.75 | 2.33 |
| Net Debt/ EBITDA | -0.05 | -0.14 | -0.78 | -0.17 | -0.48 |
| Sales/Net FA (x) | 6.46 | 6.55 | 5.42 | 5.64 | 6.47 |