
Mastek Ltd
IT - Software Services
Mastek Ltd
IT - Software Services
Stock Info
Shareholding Pattern
Price performance
Indexed Stock Performance
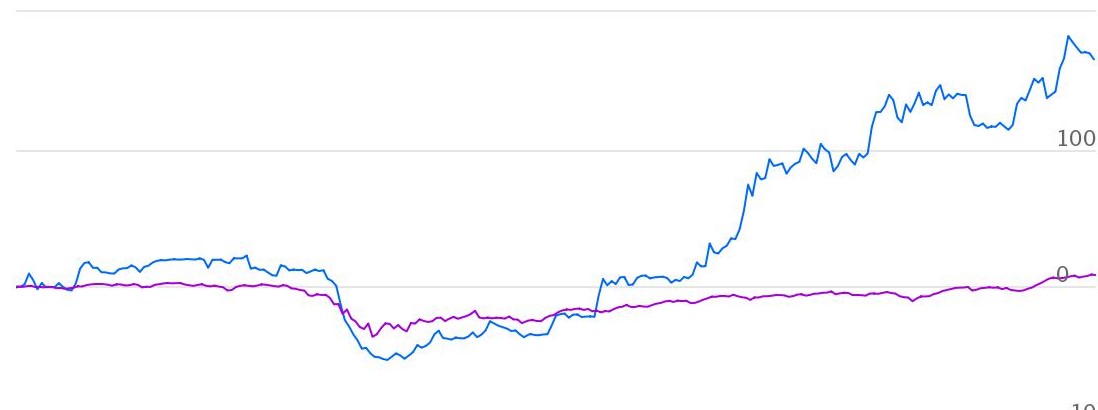
On its way to become strong Mid tier IT company
Profile:
Mastek Ltd. (Mastek) is a global technology services company offering digital
services and software for large public and private enterprises in the UK, US, Middle
East, Asia-Pacific and India. Mastek enables large‐scale business change programmes
through its service offerings, which include application development, support, and
testing, Business Intelligence (BI) and analytics, agile consulting, and digital
commerce. Its services are built around unlocking the power of data, developing
and modernising applications, accelerating digital advantage and delivering measurable
value with Oracle Cloud solutions.
Evolutionary Systems Private Ltd. (Evosys) (acquired by Mastek) is a leading, Oracle Cloud implementation and consultancy company serving 1,000+ Oracle Cloud customers across 30+ countries. An Oracle Platinum partner, Evosys provides solution offerings like Oracle HCM Cloud, Oracle ERP Cloud, Oracle SCM Cloud, Oracle CX, Oracle EPM Cloud, PaaS solutions (including custom-built solutions), AI, IoT and machine learning.
Investment Rationale:
Acquisition of Evosys
Mastek acquired Evosys in February 2020. With this acquisition Mastek now has capabilities
of Cloud implementation and consultancy. We believe the acquisition is in the right
direction at a time when organizations globally have hastened adoption of technology
and digital transformation across businesses. Combined capability of Mastek &
Evosys creates a new organization which can provide end-to-end services and tap
into this huge market. We see a lot of synergies that could result in co-sell and
cross-sell to a much bigger customer network.
Emerging Leader in Enterprise Digital Transformation
Digitising and digitalising businesses are critical to staying relevant in relation
to, consumer preferences. Mastek offers cutting edge next-gen digital solutions
to businesses, both Business-to-Business (BtoB) and Business-to-Consumer (BtoC)
organizations for their digital transformation. It helps businesses implement solutions
for modern commerce which helps to improve customer experience. Commerce transformation
is an important part of digital transformation.Mastek provides digital commerce
services for exceptional experience to the end-customer.
Strong presence in UK Government and Private sector
Mastek started as a sub-contractor for major system integrators; today, Mastek works
directly as the vendor for UK government departments. UK contributed 74% of revenues
in FY19 and 72% in FY20. Mastek’s contribution towards UK public and private
sector is largely towards Digital contracts. Mastek works with several public sector
departments like Home Office, National Health Services (NHS), Ministry of Defence
etc. Mastek is among the top 10 suppliers for UK Government projects in the Digital
Outlook and Specialist (DOS) framework.
Structural changes in the IT industry
We believe that to navigate businesses through the current crisis, digitization
and use of technology will be of prime importance. There is high demand for services
like i) digital transformation, ii) cyber security, and iii) cloud.
Outlook & Valuation
Mastek is seeing strong client addition and healthy order booking. Strong traction
is seen in UK government departments and US retail. After the acquisition of Evosys,
the company has larger market access and is able to win large multi-million dollar
end-to-end transformation deals. We believe in long term growth of the company driven
by access to larger market, multi-million dollar deals and inorganic expansion coupled
with margin expansion and healthy balance sheet. Mastek is currently trading at
10x FY23 E earnings.
Consolidated Financial Statements
| Rs in cr. | Net Sales | EBITDA | EBITDA % | PAT | EPS | ROE % | PE | EV/EBITDA |
|---|---|---|---|---|---|---|---|---|
| FY18 | 817.21 | 99.66 | 12.20% | 69.96 | 28.97 | 13.70% | 18.29 | 11.72 |
| FY19 | 1033.21 | 131.71 | 12.70% | 101.64 | 41.31 | 16.10% | 11.13 | 7.75 |
| FY20 | 1071.48 | 155.36 | 14.50% | 113.81 | 45.64 | 13.80% | 4.24 | 2.79 |
| FY21E | 1622.79 | 285.61 | 17.60% | 186.06 | 74.61 | 20.10% | 11.39 | 6.34 |
| FY22E | 1823.30 | 313.61 | 17.20% | 207.03 | 83.02 | 18.40% | 10.24 | 5.16 |
| FY23E | 2018.65 | 343.17 | 17.00% | 228.33 | 91.60 | 17.30% | 9.28 | 4.03 |
Investment Rationale
Acquisition of Evosys
Mastek acquired Evosys in February 2020. With this acquisition Mastek now has capabilities of Cloud implementation and consultancy. We believe the acquisition is in the right direction at a time when organizations globally have hastened adoption of technology and digital transformation across businesses. Combined capability of Mastek & Evosys creates a new organization which can provide end-to-end services and tap into this huge market. We see a lot of synergies that could result in co-sell and cross-sell to a much bigger customer network.
Rationale on acquisition
1) Diversification: Evosys provides much required diversification to Mastek
on revenue and geographical front. On geographical side, Evosys opens up access
to continental Europe and Middle-east, and reduces concentration from UK. On the
revenue front, Mastek has a steadier annuity revenue model, while Evosys is a transactional
revenue model.
2) Increase in addressable market size: Evosys is a strong player in cloud migration with eastablished sales channel and partnership with Oracle, while Mastek is into digital integration and application development. There are no overlap of capabilities, which makes ‘Joint Go-To Market Strategy’ meaningful, where both Evosys’ and Mastek’s offerings combine to achieve bigger deals.
Robust growth in Evosys
Evosys delivered robust growth in operating performance. Revenues grew at 34% CAGR
for FY17-20, while EBITDA grew at 131% CAGR during the same period. Margins saw
robust improvement from 4% in FY17 to 19% in FY20.
| US $ in million | FY17 | FY18 | FY19 | FY20 |
|---|---|---|---|---|
| Revenue | 27.70 | 42.40 | 59.70 | 66.10 |
| Growth% | 53% | 41% | 11% | |
| EBITDA | 1.00 | 4.00 | 13.70 | 12.40 |
| Margin% | 4% | 9% | 23% | 19% |
Emerging Leader in Enterprise Digital Transformation
Digitising and digitalising businesses are critical to staying relevant in terms
of, consumer preferences. Digital transformation is all about integration of new
innovative digital technologies such as Machine Learnings (ML), Robotics, BlockChain,
Artificial Intelligence (AI), Internet of Things (IoT), Big Data & Analytics,
Cloud Computing, Mobility and Social Media in all the business functions to improve
operational efficiency and deliver better value and outcome to customers.
Mastek offers cutting edge next-gen digital solutions to businesses, both Business-to-Business (BtoB) and Business-to-Consumer (BtoC) organizations for their digital transformation. It helps businesses implement solutions for modern commerce which helps to improve customer experience. Commerce transformation is an important part of digital transformation.Mastek provides digital commerce services for exceptional experience to the end-customer.
Strong presence in UK Government and Private sector
Mastek started as a sub-contractor for major system integrators; today, Mastek works
directly as the vendor for UK government departments. UK contributed 74% of revenues
in FY19 and 72% in FY20. Mastek’s contribution towards UK public and private
sector is largely towards Digital contracts. Mastek works with several public sector
departments like Home Office, National Health Services (NHS), Ministry of Defence
etc. Mastek is among the top 10 suppliers for UK Government projects in the Digital
Outlook and Specialist (DOS) framework.
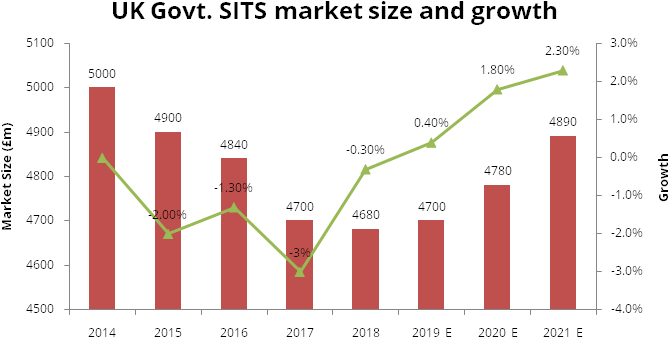
The UK IT sector continues to be dynamic in adopting technology to impact business, public services and society and is at the forefront of many innovations. As per the Tech Nation report, investments in the UK IT sector surged to £10.1 billion ($13.2 billion) in 2019, marking an increase of 44% over 2018 and the highest level in UK history, mainly driven by the rapid expansion of digital technology growth across the UK regions. There is acceleration in digital transformation projects taken up by the UK public sector to bring in efficiency and productivity whilst servicing customers. Moving away from the traditional legacy projects, there is increasing implementation of digital projects, platform-based services and cybersecurity-related software and services. The UK government’s External Software and IT services (SITS) market spend has been declining over CY14-CY17 due to moderation in legacy spends. Digital is 23% of the Total SITS Spend for the UK region which is growing at 30%.
2009 crisis and current outlook on political volatility
In 2009-2010, there was change in government in the UK. Because of elections, there
was delay in order inflows and after that the new government had put on hold to
many of the large programs. There was freeze on spending by the new conservative
government. UK government was the biggest customer of Mastek, and all these political
volatility led to slow down of most of the projects. The risk of change in government
is nowhere close, as the next UK general election is schedule to be held in May
2024.
For Q2FY21, UK Government is the biggest contributor to overall revenue at 35%. Management is confident of business being insulated from the political uncertainities as UK Governemnt spending are critical in nature and part of national infrastructure, which is not treated as discretionary spend. Management expects to win new logos in the government space and indicated strong deal pipeline in the HMRC (Her Majesty's Revenue and Customs) and UK healthcare segment.
To check the sensitivity of revenue and profitability for volatility in UK government revenue, we have calculated the impact, assuming if UK government revenue declined by 5% each for FY21 and FY22. We would see overall revenues getting impacted by Rs. 28 cr and Rs. 98 cr for FY21 and FY22 respectively, while PAT would get impacted by Rs. 3 cr. for FY21 and Rs. 11 cr. for FY22. Overall EPS will reduce from Rs. 74.6 & Rs. 83 to Rs. 73.3 & Rs. 78.5 for FY21 and FY22 respectively.
Bear case
| Particulars | FY21 E | FY22 E |
|---|---|---|
| UK Government business degrowth YoY | -5% | -5% |
| Revenue | 1,594.8 | 1,725.3 |
| PAT | 183 | 196 |
| EPS | 73.3 | 78.5 |
Structural changes in the IT industry
We believe that to navigate businesses through the current crisis, digitization
and use of technology will be of prime importance. There is high demand for services
like i) digital transformation, ii) cyber security, and iii) cloud.
It is evident that companies that previously digitized their operations have been more resilient. The pandemic has positively impacted the IT industry, with more and more organizations globally having realized the importance of technology and increased their spending on digital transformation. Consequently, in the medium to long term, it is very likely that businesses will continue to spend on technology related initiatives with a greater focus on automation, remote working, cloud-based applications, optimization of legacy technology costs, etc. On the cost side, work from home, reduction in discretionary spends like branding, marketing, re-negotiation of rents and no travel costs are improving margins.
Financials
We expect Revenue / EBIT / PAT to grow at 23.5% / 25.4% / 31.8% CAGR for FY20-23 E; Revenue growth will be led by large deal wins and increased adoption of cloud and digital transformation. We expect margins to improve from 16% in FY 20 to 17.1% in FY 21, led by cost control initiatives and better offshore mix. Margins will cool off a bit in FY22 as things normalize post pandemic, and travel and marketing expenses rise.
Segmental Revenues
Service line wise Application Development & its Support & Maintenance and
Oracle Suite and Cloud Migration will lead growth.
| Revenue Distribution by Service Line (INR in crore) | FY2017 | FY2018 | FY2019 | FY2020 | Q1 FY2021 | Q2 FY2021 |
|---|---|---|---|---|---|---|
| Application Development | 325 | 389 | 489 | 455 | 157 | 167 |
| Digital commerce | 56 | 212 | 239 | 225 | 43 | 45 |
| Application Support & maintenance | 85 | 80 | 144 | 175 | 134 | 143 |
| Oracle Suit & Cloud Migration | - | - | - | 87 | 29 | 30 |
| BI & Analytics | 20 | 65 | 89 | 82 | 12 | 17 |
| Agile consulting | 55 | 48 | 31 | 18 | 4 | 1 |
| Assurance & Testing | 19 | 24 | 41 | 30 | 7 | 7 |
| Total | 560 | 817 | 1,033 | 1,071 | 386 | 410 |
Region wise, UK followed by North America are showing strong traction in revenue growth and order booking. Middle-east and Rest of the World markets will start contributing meaningfully led by Evosys.
| Revenue Distribution by Region (INR in crore) | FY2017 | FY2018 | FY2019 | FY2020 | Q1 FY2021 | Q2 FY2021 |
|---|---|---|---|---|---|---|
| UK & Europe | 460 | 563 | 764 | 772 | 252 | 276 |
| North America (US) | 71 | 237 | 253 | 249 | 66 | 72 |
| Middle East (ME) | - | - | - | 24 | 55 | 44 |
| Others (ROW) | 29 | 17 | 17 | 27 | 13 | 18 |
| Total | 560 | 817 | 1,033 | 1,071 | 386 | 410 |
Industry wise, we believe that the UK government has started to increase spends
on digitizing governemnt departments; this has led to growth coming back from Government
vertical. Amongst UK Government departments; Mastek currently works on programmes
with the NHS (National Health Service), the Home Office, and the Ministry of Defence.
Mastek has won new major accounts with UK Government departments like the HMRC (Her
Majesty's Revenue and Customs), and Public Health England.
Healthcare is another focus area of the management, where in Q2FY21, witnessed highest
number of customer addition (6) in healthcare space. Due to the pandemic, globally
healthcare has seen improved investments; this has led to strong growth in the Health
vertical.
| Revenue Distribution by Industry (INR in crore) | FY2019 | FY2020 | Q1 FY2021 | Q2 FY2021 |
|---|---|---|---|---|
| Government | 311 | 339 | 130 | 144 |
| Health | 85 | 131 | 77 | 75 |
| Financial Services | 199 | 174 | 49 | 50 |
| Retail Services | 362 | 340 | 68 | 81 |
| Others | 76 | 89 | 62 | 60 |
| Total | 1,033 | 1,071 | 386 | 410 |
Forex sensitivity analysis
| Particulars | FY21 E | FY22 E | FY23 E |
|---|---|---|---|
| Bull case | |||
| GBP rate assumption | 98 | 102 | 106 |
| Revenue | 1,656.6 | 1,897.7 | 2,139.8 |
| EPS | 76.20 | 86.97 | 97.92 |
| Base case | |||
| GBP rate assumption | 96 | 98 | 100 |
| Revenue | 1,622.8 | 1,823.3 | 2,018.7 |
| EPS | 74.60 | 83.00 | 91.60 |
| Bear case | |||
| GBP rate assumption | 94 | 92 | 90 |
| Revenue | 1,589.0 | 1,711.7 | 1,816.8 |
| EPS | 73.30 | 77.09 | 80.96 |
Industry
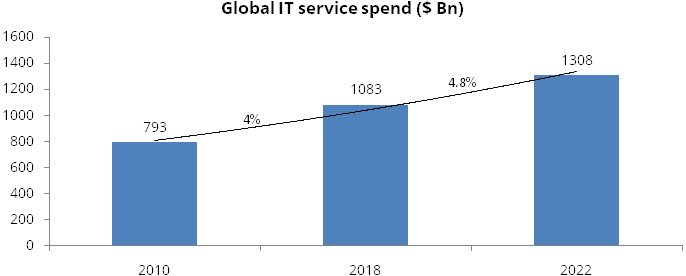
Global IT services spend is expected to grow at 4.8% CAGR over 2019-2022 according to Gartner report on Trends, Disruptors and the Future of Business & IT Services.
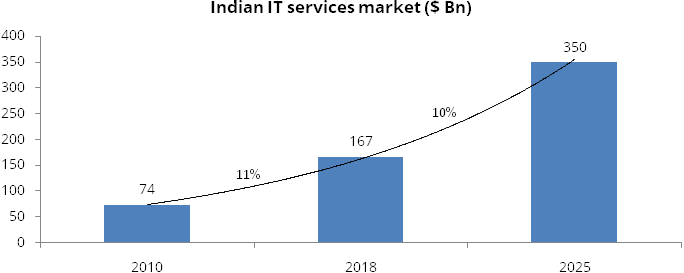
The Indian IT services market is expected to grow at 10% CAGR over 2019-2025 and generate revenues of $ 350 billion.
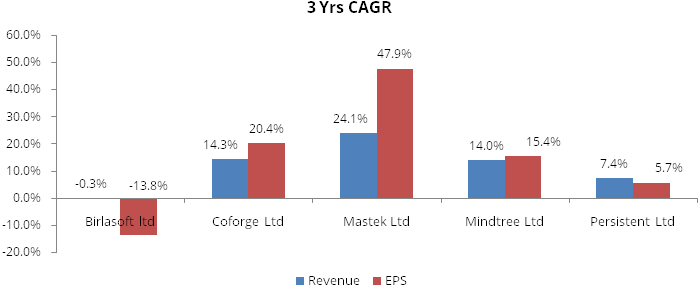
Peer comparison: Below tables showcases last 3 years financials for mid to small cap IT companies.
The table clearly shows how mastek has outperformed its peers on revenue and profitability front in last 3 years.
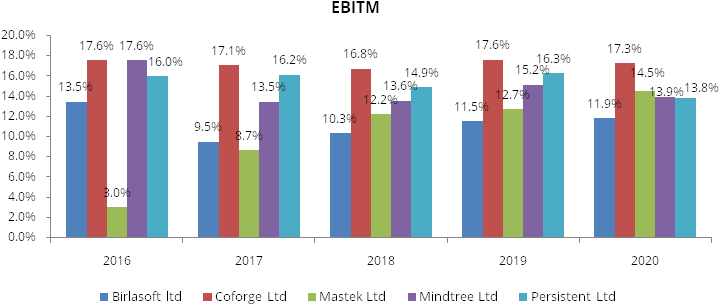
In below table we can see how Mastek has consistently improved its EBIT margins year-on-year.
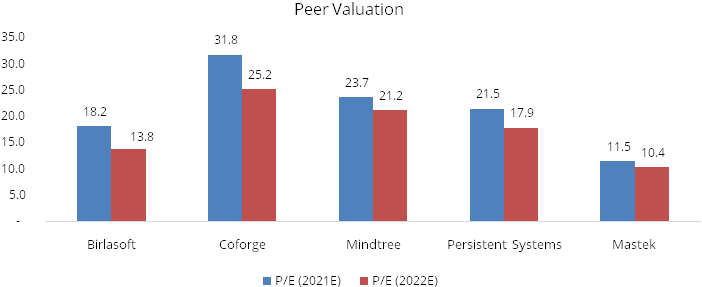
In below table, we can see that Mastek is most undervalued company among peers. We expect this valuation disocunt to narrow.
Covid-19 impact on the IT sector
Covid-19 has provided an opportunity for IT vendors to become more resilient and
innovative. In the post-coronavirus world, businesses will undergo a transition,
and the biggest gainer could be the IT industry. Many IT companies have digitised
all their processes and invested in cutting edge infrastructure and collaboration
tools to support their location-independent agile delivery models and secure borderless
workspaces. Businesses, mainly those in the services sector like banking & other
financial services, education, retail, healthcare, food & grocery delivery,
will further embrace technology and automation to better leverage growth. Many organisations,
through the rapid adoption of digital transformation, have already embraced cloud
and mobility trends. The expanding IT industry, along with the rising trend of digitalisation,
is one of the key factors that will continue to drive the growth of IT companies.
As the ‘work from home’ scenario is beginning to become the new normal,
more workload will be migrated to the cloud to ensure that businesses can function
as usual. Almost all sectors will move towards digitisation and automation, and
going forward, digitisation, cloud computing, machine learning, and artificial intelligence
will dominate the technology space.
Risks & Concerns
- Foreign currency exposure: Foreign currency forwards and options contracts are entered into to mitigate the risk of changes in exchange rates on foreign currency exposures.
- Global economic recession: Clients’ business operations may be negatively impacted due to the economic downturn.
- Cyber Security and Data privacy breach: Due to large number of employees working remotely, exposure to cyber security and data privacy breach incidents has increased.
- Legislation and Regulatory compliance: Government may enact restrictive legislation that could limit companies in those countries from outsourcing work.
Outlook & valuation
Mastek is seeing strong client addition and healthy order booking. Strong traction is seen in UK government departments and US retail. After the acquisition of Evosys, the company has larger market access and is able to win large multi million dollar end-to-end transformation deals. Mastek sold its stake in Majesco for Rs. 236 crore, this resulted in net cash of Rs. 460 crore. The management is looking at optimal way of deploying this cash and is open for another inorganic acquisition like Evosys, to improve capabilities and reach.
We believe in long term growth of the company driven by access to larger market, multi-million dollar deals and inorganic expansion coupled with margin expansion and healthy balance sheet. Mastek is currently trading at 11.5x & 10.4x FY22 / FY23 E earnings respectively, which is at huge discount to small and mid tier IT companies. We believe valuation discount to narrow and PE multiple to expand along with organic and inorganic growth in the business, hence, we initiate ‘Buy’ on Mastek for long term perspective.
Financial Statement
Profit & Loss statement
| Yr End March (Rs M) | FY2018 | FY2019 | FY2020 | FY2021E | FY2022E | FY2023E |
|---|---|---|---|---|---|---|
| Net Sales | 817.21 | 1033.21 | 1071.48 | 1622.79 | 1823.30 | 2018.65 |
| Growth % | 26.00% | 4.00% | 51.00% | 12.00% | 11.00% | |
| Expenditure | ||||||
| Raw Material | - | - | - | - | - | - |
| Employee Cost | 480.94 | 587.17 | 588.91 | 856.83 | 966.35 | 1069.89 |
| Other Expenses | 236.61 | 314.33 | 327.21 | 480.35 | 543.34 | 605.60 |
| EBITDA | 99.66 | 131.71 | 155.36 | 285.61 | 313.61 | 343.17 |
| Growth % | 32.00% | 18.00% | 84.00% | 10.00% | 9.00% | |
| EBITDA Margin | 12.00% | 13.00% | 14.00% | 18.00% | 17.00% | 17.00% |
| Depreciation & Amortization | 18.76 | 17.35 | 24.89 | 49.32 | 47.30 | 45.69 |
| EBIT | 101.89 | 139.14 | 171.77 | 277.59 | 307.61 | 338.78 |
| EBIT Margin % | 12.00% | 13.00% | 16.00% | 17.00% | 17.00% | 17.00% |
| Other Income | 20.99 | 24.78 | 41.30 | 41.30 | 41.30 | 41.30 |
| Interest & Finance Charges | 5.86 | 6.13 | 3.62 | 4.00 | 2.00 | -0.01 |
| Profit Before Tax - Before Exceptional | 96.03 | 133.01 | 168.15 | 273.59 | 305.61 | 338.78 |
| Profit Before Tax | 96.03 | 133.56 | 144.08 | 273.59 | 305.61 | 338.78 |
| Tax Expense | 26.07 | 31.92 | 30.27 | 62.92 | 70.29 | 77.92 |
| Effective Tax rate | 0.27 | 0.24 | 0.18 | 0.23 | 0.23 | 0.23 |
| Exceptional Items | - | 0.55 | -24.07 | - | - | - |
| Net Profit | 69.96 | 101.64 | 113.81 | 210.66 | 235.32 | 260.86 |
| Growth % | 45.00% | 12.00% | 85.00% | 12.00% | 11.00% | |
| Net Profit Margin | 9.00% | 10.00% | 11.00% | 13.00% | 13.00% | 13.00% |
| Adjusted Net Profit | 69.96 | 101.64 | 113.81 | 186.06 | 207.03 | 228.33 |
| Growth % | 45.00% | 12.00% | 63.00% | 11.00% | 10.00% |
Balance Sheet
| Yr End March (Rs M) | FY2018 | FY2019 | FY2020 | FY2021E | FY2022E | FY2023E |
|---|---|---|---|---|---|---|
| Share Capital | 11.85 | 11.99 | 12.14 | 12.14 | 12.14 | 12.14 |
| Total Reserves | 527.14 | 686.23 | 757.45 | 951.58 | 1169.44 | 1411.60 |
| Shareholders' Funds | 549.28 | 716.40 | 927.51 | 1167.19 | 1385.05 | 1627.21 |
| Minority Interest | - | - | 137.05 | 182.60 | 182.60 | 182.60 |
| Non Current Liabilities | ||||||
| Long Term Burrowing | 49.61 | 69.21 | 240.85 | 58.92 | -75.08 | -75.08 |
| Deferred Tax Assets / Liabilities | -34.39 | -15.94 | -23.03 | -23.03 | -23.03 | -23.03 |
| Long Term Provisions | 6.64 | 11.66 | 25.36 | 25.36 | 25.36 | 25.36 |
| Current Liabilities | ||||||
| Short Term Borrowings | 3.91 | - | 74.80 | 74.80 | 74.80 | 74.80 |
| Trade Payables | 18.89 | 9.48 | 105.39 | 73.82 | 94.41 | 105.26 |
| Other Current Liabilities | 152.88 | 141.15 | 264.80 | 246.73 | 246.73 | 246.73 |
| Short Term Provisions | 13.59 | 18.20 | 23.50 | 23.50 | 23.50 | 23.50 |
| Total Equity & Liabilities | 786.94 | 950.19 | 1864.64 | 1872.74 | 1977.20 | 2230.21 |
| Assets | ||||||
| Net Block | 178.86 | 167.39 | 851.89 | 812.57 | 775.27 | 749.57 |
| Non Current Investments | 166.37 | 282.20 | 126.67 | 126.67 | 126.67 | 126.67 |
| Long Term Loans & Advances | 11.26 | 13.30 | 15.53 | 15.53 | 15.53 | 15.53 |
| Current Assets | ||||||
| Currents Investments | 117.70 | 113.96 | 153.76 | - | - | - |
| Inventories | - | - | - | - | - | - |
| Sundry Debtors | 174.02 | 208.49 | 315.72 | 295.26 | 377.65 | 421.04 |
| Cash and Bank | 88.02 | 93.39 | 220.97 | 442.66 | 502.03 | 737.35 |
| Long Term Loans & Advances | 11.26 | 13.30 | 15.53 | 15.53 | 15.53 | 15.53 |
| Total Assets | 786.94 | 950.19 | 1864.64 | 1872.79 | 1977.25 | 2230.26 |
Cash Flow Statement
| Yr End March (Rs M) | FY2018 | FY2019 | FY2020 | FY2021E | FY2022E | FY2023E |
|---|---|---|---|---|---|---|
| Profit After Tax | 69.96 | 101.64 | 113.81 | 210.66 | 235.32 | 260.86 |
| Depreciation | 18.76 | 17.35 | 24.89 | 49.32 | 47.30 | 45.69 |
| Others | 45.14 | -6.80 | 47.80 | - | - | - |
| Changes in Working Capital | -44.79 | -50.68 | 36.48 | -11.12 | -61.79 | -32.54 |
| Cash Flow From Operations | 89.07 | 61.51 | 222.98 | 248.87 | 220.82 | 274.02 |
| Purchase of Fixed Assets | -15.44 | -15.51 | -15.65 | -10.00 | -10.00 | -20.00 |
| Free Cash Flow | 73.63 | 46.00 | 207.33 | 238.87 | 210.82 | 254.02 |
| Others | 45.14 | -6.80 | 47.80 | - | - | - |
| Cash Flow From Investments | 29.70 | -22.31 | 32.15 | -10.00 | -10.00 | -20.00 |
| Increase / (Decrease) in Loan Funds | 4.14 | 0.56 | 242.74 | - | - | - |
| Equity Dividend Paid | -10.68 | -17.73 | -31.48 | -16.53 | -17.46 | -18.70 |
| Others | 45.14 | -6.80 | 47.80 | - | - | - |
| Cash Flow From Financing | 38.60 | -23.97 | 259.06 | -16.53 | -17.46 | -18.70 |
| Net Change in Cash | 157.37 | 15.23 | 514.19 | 222.33 | 193.37 | 235.32 |
| Opening Cash & Cash Equivalents | 81.30 | 93.35 | 213.73 | 442.66 | 502.03 | 737.35 |
| Cash at the end of the year | 238.67 | 108.58 | 727.92 | 665.00 | 695.40 | 972.67 |
Key Ratios
| Yr End March (Rs M) | FY2018 | FY2019 | FY2020 | FY2021E | FY2022E | FY2023E |
|---|---|---|---|---|---|---|
| EPS | 28.97 | 41.31 | 45.64 | 74.61 | 83.02 | 91.60 |
| DPS | - | - | - | 5.50 | 7.00 | 7.50 |
| Book value (Rs/share) | 227.42 | 291.17 | 371.92 | 468.03 | 555.39 | 652.49 |
| ROCE (%) Post Tax | 13.00% | 15.00% | 14.00% | 17.00% | 18.00% | 17.00% |
| ROE (%) | 14.00% | 16.00% | 14.00% | 20.00% | 18.00% | 17.00% |
| Inventory Days | - | - | - | - | - | - |
| Receivable Days | 57.86 | 67.56 | 89.29 | 68.71 | 67.35 | 72.21 |
| Payable Days | 8.66 | 5.01 | 19.57 | 20.15 | 16.84 | 18.05 |
| PE | 18.29 | 11.13 | 4.24 | 11.39 | 10.24 | 9.28 |
| P/BV | 2.37 | 1.62 | 0.51 | 1.82 | 1.53 | 1.30 |
| EV/EBITDA | 11.72 | 7.75 | 2.79 | 6.34 | 5.16 | 4.03 |
| Dividend Yield (%) | 0.00% | 0.00% | 0.00% | 1.00% | 1.00% | 1.00% |
| P/Sales | 1.60 | 1.12 | 0.44 | 1.31 | 1.16 | 1.05 |
| Net debt/Equity | - | - | - | - | - | - |