Mahindra & Mahindra Ltd
Automobiles - Passenger Cars
Mahindra & Mahindra Ltd
Automobiles - Passenger Cars
Stock Info
Shareholding Pattern
Price performance
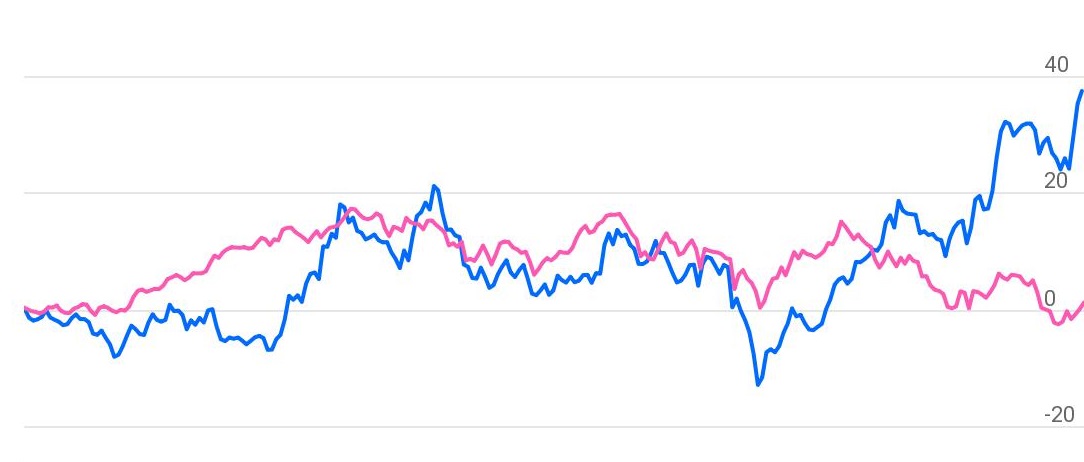
Indexed Stock Performance

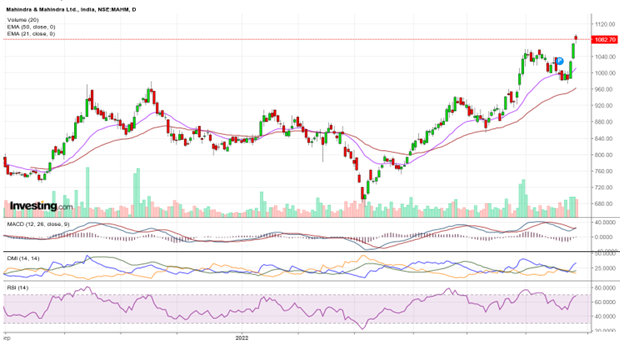
Higher highs, higher lows, bullish view

Price: M&M has gained 12.17% over last one month after finding bottom at Rs.853.70 made on 12 May 2022, which also ended short term down trend in the stock. The stock has been significantly outperforming both NIFTY and NIFTYAUTO over last month. We expect the stock to continue its outperformance in the coming weeks. The stock has bounced from the support level with increased volume which indicates the strength in the counter.
Indicator: The stock is trading above important moving average 21EMA, 50EMA & 200EMA on daily charts as well as weekly chart. Bollinger Band (20, 2, S) set up on daily chart has started to expand and currently the stock is trading above the upper band of Bollinger Band indicating the volatility expansion on the higher side.
RSI (14) on daily chart is pegged at sub 68.08 levels, indicating the stock has not yet been over bought. The Parabolic SAR is trading below its price action on daily charts reflect up trend in the stock will remain intact in near term. The MACD is trading above the signal in buy territory on daily chart, indicating positive momentum in the stock in the near term. The DMI+ (33.40) on the daily timeframe is also currently trading above the 25-mark suggesting that the stock is likely to witness more momentum in coming days.
Volume: Price and volume pattern are moving in the same direction which reflects the true movements in the stock. M&M stock has seen the profit booking with thin volume, which still shows the movement of this stock, is still on bull side.
Conclusion: From the above observation it is evident that stock is likely to surge higher and outperform its peers in coming trading weeks and move higher. Investors may go long on the stock around Rs.1090 levels keeping a stop loss below Rs.925 for the targets of Rs. 1370 levels.