
Infosys Ltd
IT - Software Services
Infosys Ltd
IT - Software Services
Stock Info
Shareholding Pattern
Price performance
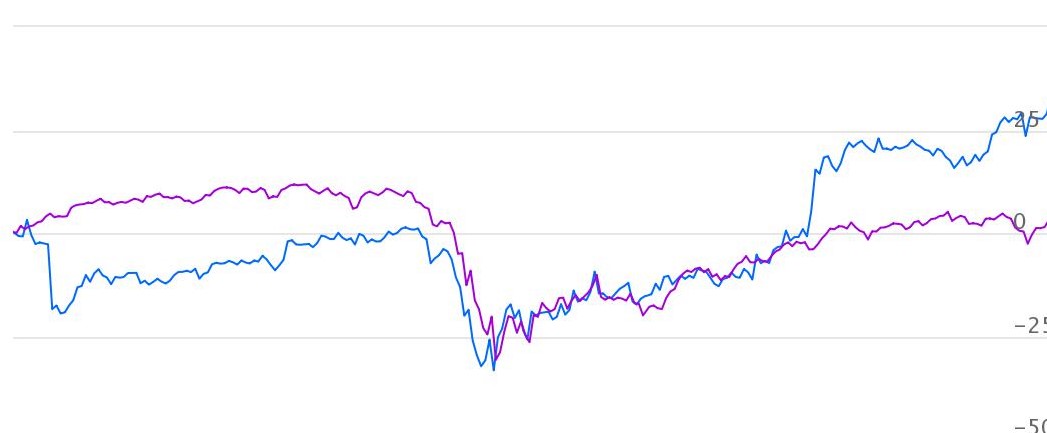
Indexed Stock Performance
Robust growth in Digital service business and leader in technology space
Infosys Ltd. (Infosys) is India’s leading information technology (IT) company. The company provides consulting, technology, outsourcing and next-generation digital services to clients across 46 countries. Infosys has nearly 4 decades of experience in managing the systems and workings of global enterprises. The company facilitates continuous improvement of its clients’ operations through building and transferring digital skills, expertise and ideas from its innovation ecosystem.
Strong momentum in large deal wins
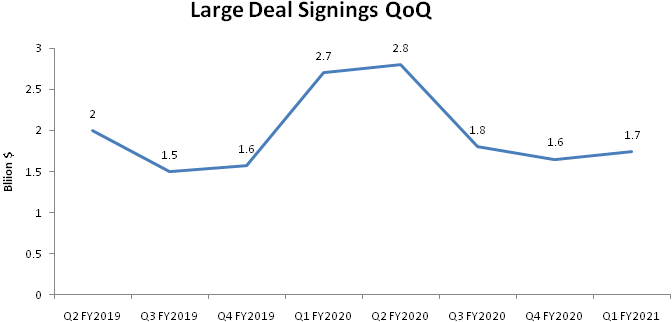
Infosys reported order wins of US$1.74 billion in Q1 FY 2021, which grew 6% QoQ.
Infosys won 15 large deals in Q1 (13 in North America and 2 in Europe). Across verticals,
financial services won 6 deals. Management indicated that the company’s deal
pipeline was very healthy and includes digital transformation and vendor consolidation
opportunities (reducing the number of vendors to few partners). Infosys signed its
largest deal in its history, which could be worth $1.5 billion, involves digital
transformation and migration of record keeping services to cloud-based platform
for Vanguard.
Robust Margin improvement
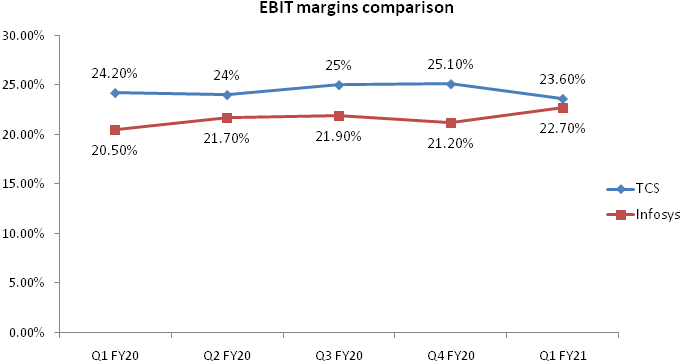
Infosys delivered 22.7% operating margins in Q1 FY2021, which is an expansion of
220 bps YoY and 150 bps QoQ. Higher operating margins were achieved after rewarding
employees with higher variable pay during the quarter. Margin improvement was led
by cost control initiatives like i) hiring freeze and improved bench utilization,
ii) discretionary cost cutting like travel, marketing and rate negotiations, iii)
automation and onsite mix. We believe some of these changes are structural in nature
and are not going to reverse very soon, as work from home is here to stay for the
long term.
Structural changes in the IT industry
We believe that to navigate businesses through the current crisis, digitization
and use of technology will be of prime importance. There is high demand for services
like i) digital transformation, ii) cyber security, iii) cloud. Several sectors
are also seeking technology-based solutions immediately to tackle the health and
economic crises – notably in healthcare, life sciences, banking, telecommunications
and essential retail.
Robust growth in Digital revenue
Infosys has strong digital capabilities and offerings that enable clients to achieve
business transformation by adopting digital technologies. Digital services and solutions
contributed 39% of revenue in FY2020 as compared to 31% in FY2019. For Q1 FY2021,
digital revenue grew by 25% YoY in constant currency (CC) terms and now contributes
44.5% of total revenue, as compared to 35.7% for Q1 FY2020 and 41.9% for Q4 FY2020.
Outlook and Valuation:
Infosys delivered strong Q1, where management has guided for 0-2% YoY growth in
CC terms for FY21 with EBIT margin in the range of 21-23%. Notwithstanding higher
variable pay to employees during the quarter, the company delivered robust margin
expansion. We see strong upside in Infosys over the medium-to-long term given growth,
margin expansion and narowing valuation divergence to TCS. Hence, we initiate ‘Buy’
on the stock. The stock is currently trading at 22x FY22 earnings.
Consolidated Financial Statements
| Rs in cr. | Net Sales | EBITDA | EBITDA % | PAT | EPS | ROE % | PE | EV/EBITDA |
|---|---|---|---|---|---|---|---|---|
| FY18 | 70522.00 | 18893.00 | 27.00% | 16100.00 | 35.54 | 24.00% | 7.70 | 11.70 |
| FY19 | 82675.00 | 20170.00 | 24.00% | 15410.00 | 35.44 | 24.00% | 20.89 | 14.72 |
| FY20 | 90791.00 | 21756.00 | 24.00% | 16639.00 | 38.97 | 25.00% | 16.36 | 11.46 |
| FY21E | 98740.40 | 25014.80 | 25.00% | 18050.30 | 42.38 | 26.00% | 23.17 | 15.36 |
| FY22E | 106509.90 | 25895.50 | 24.00% | 19012.40 | 44.64 | 24.00% | 22.00 | 14.49 |
Investment Rationale
Strong momentum in large deal wins
Infosys reported order wins of US$1.74 billion in Q1 FY 2021, which grew 6% QoQ.
Infosys won 15 large deals in Q1 (13 in North America and 2 in Europe). Across verticals,
financial services won 6 deals. Management indicated that the company’s deal
pipeline was very healthy and includes digital transformation and vendor consolidation
opportunities.
Strategic partnership with Vanguard
Infosys and Vanguard announced a strategic partnership, which involves digital transformation
and migration of record keeping services to cloud-based platform. According to news
reports, the deal could be worth $1.5 billion, which will be largest deal in the
history of Infosys. Infosys will assist Vanguard in providing record keeping business,
including software platforms, administration and associated processes.
Revenue growth
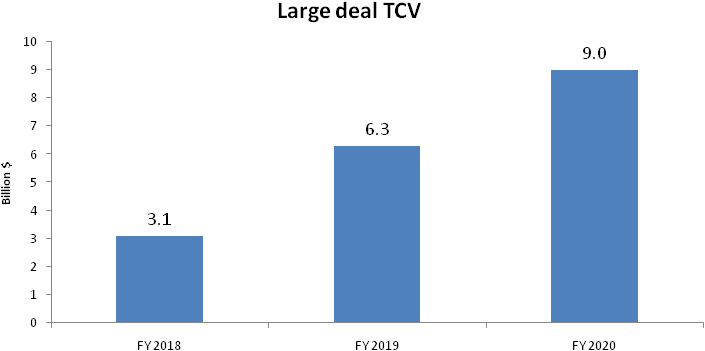
Increase in revenues was mainly attributed to large deal wins, which is improving
year-on-year.
Client addition
Infosys reported 0.8% growth QoQ in revenues from its top 10 clients. The largest
account saw a 7% QoQ increase in revenues. Given the pandemic, we believe the company’s
top clients’ performance was strong. There was strong addition of clients
except in US$ 100 million+ category, which saw a reduction in the number of clients
by 3 (from 28 in the last quarter to 25 during the quarter).
Client base in terms of business size
| Particulars | Q2FY19 | Q3FY19 | Q4FY19 | Q1FY20 | Q2FY20 | Q3FY20 | Q4FY20 | Q1FY21 |
|---|---|---|---|---|---|---|---|---|
| US$1 mn+ | 633 | 651 | 662 | 680 | 693 | 705 | 718 | 729 |
| US$10 mn+ | 205 | 214 | 222 | 228 | 228 | 232 | 234 | 236 |
| US$50 mn+ | 58 | 59 | 60 | 59 | 61 | 61 | 61 | 60 |
| US$100 mn+ | 23 | 23 | 25 | 27 | 27 | 28 | 28 | 25 |
Robust Margin improvement
Infosys delivered 22.7% operating margins in Q1 FY2021, which is an expansion of
220 bps YoY and 150 bps QoQ. Higher operating margins were achieved after rewarding
employees with higher variable pay during the quarter. Margin improvement was led
by cost control initiatives like i) hiring freeze and improved bench utilization,
ii) discretionary cost cutting like travel, marketing and rate negotiations, iii)
automation and onsite mix.
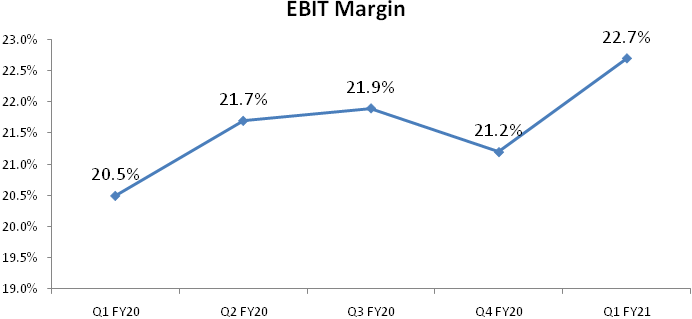
For Q1 FY21, there was 230 bps margin improvement QoQ because of lower travel and visa cost, while 110 bps improvement was because of lower SG&A (selling, general and administrative expenses), which was mainly offset by increase in salary cost and higher onsite mix. We believe some of these changes are structural in nature and are not going to reverse very soon, as work from home is here to stay for the long term.
Structural changes in the IT industry
We believe that to navigate businesses through the current crisis, digitization
and use of technology will be of prime importance. There is high demand for services
like i) digital transformation, ii) cyber security, iii) cloud.
It is evident that companies that have previously digitized their operations have been more resilient. The pandemic has positively impacted the IT industry, with more and more organizations globally having realized the importance of technology and increased their spending on digital transformation. Consequently, in the medium to long term, it is very likely that businesses will continue to spend on technology related initiatives with a greater focus on automation, remote working, cloud-based applications, optimization of legacy technology costs, etc. Several sectors are also seeking technology-based solutions immediately to tackle the health and economic crises – notably in healthcare, life sciences, banking, telecommunications and essential retail.
On the cost side, work from home, reduction in discretionary spends like branding, marketing, re-negotiation of rents and no travel costs are improving margins. Voluntary attrition rate has been at a multi-quarter low at 11%.
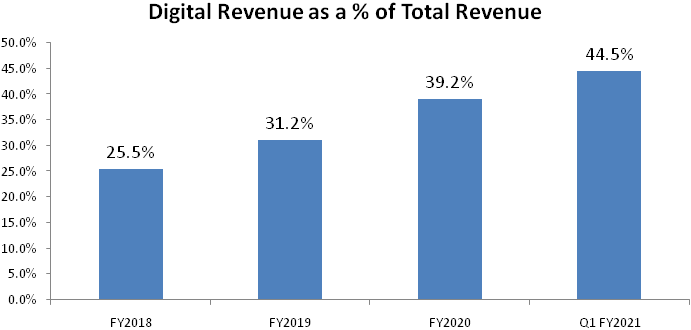
Robust growth in Digital revenue
Infosys has strong digital capabilities and offerings that enable clients to achieve
business transformation by adopting digital technologies. Digital services and solutions
contributed 39% of revenue in FY2020 as compared to 31% in FY2019. For Q1 FY2021,
digital revenue grew by 25% YoY in constant currency (CC) terms and now contributes
44.5% of total revenue, as compared to 35.7% for Q1 FY2020 and 41.9% for Q4 FY2020.
To benefit from increased demand for cloud, Infosys has recently launched ‘Infosys Cobalt’ – a set of services, solutions, and platforms for enterprises to accelerate their cloud journey. Infosys Cobalt helps businesses redesign the enterprise, from the core, and also build new cloud-first capabilities to create seamless experiences in public, private and hybrid cloud.
Recent acquisitions to power digital offering
In September 2020, Infosys acquired Kaleidoscope Innovation, a full-spectrum product
design, development and insights firm innovating across medical, consumer and industrial
markets. Kaleidoscope designs microsurgical instruments, devices used in minimally
invasive surgery, drug delivery devices for ophthalmic therapies and user-centric
wearables. It also offers usability testing in support of regulatory submissions,
including the delivery mechanism for aortic stents. This acquisition will help Infosys
improve its capabilities in the design of smart products and strengthens digital
offerings in medical devices.
During the month of September, Infosys also acquired GuideVision, a leading ServiceNow elite partner in Europe. GuideVision is an enterprise service management consultancy specialised in offering strategic advisory, consulting, implementations, training and support on the ServiceNow platform. GuideVision’s end-to-end offerings, enables over 100 enterprise clients to simplify complex business and IT processes. This acquisition will strengthen Infosys digital capabilities towards cloud-powered enterprise trasnsformation.
Financials
Revenue
We expect Revenue / EBIT / PAT to grow at 8.3% / 8.9% / 6.9% CAGR for FY20-22 E;
Revenue growth will be led by large deal wins and increased adoption of cloud and
digital trasnformation. We expect margins to improve from 20.8% in FY 20 to 22%
in FY 21, led by cost control initiatives and rupee depreciation. Margins will cool
off a bit in FY22 as things normalize post pandemic, and travel and marketing expenses
rise.
The increase in revenues in FY2020 was primarily attributable to an increase in large deal wins and strong growth in digital revenues across all the segments.
Segmental Revenues
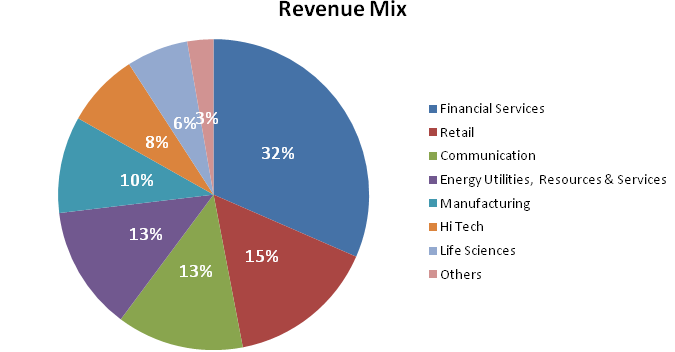
Financial services and Retail are the biggest contributors at 32% and 15% of total
revenue respectively, followed by Communication and Energy utilities at 13% each.
Infosys’ core banking platform ‘Finacle’ is seeing increased adoption, as globally banks are moving to cloud. Finacle now has more than 200 banking customers globally, whereas majority of new deals are only digital. We expect strong traction in Financial services led by Finacle.
| Particulars | FY 2018 | FY 2019 | FY 2020 |
|---|---|---|---|
| Financial Services | 23,172 | 26,477 | 28,625 |
| % of Total Revenue | 32.9% | 32.0% | 31.5% |
| Growth % | 14.3% | 8.1% | |
| Retail | 11,345 | 13,556 | 14,035 |
| % of Total Revenue | 16.1% | 16.4% | 15.5% |
| Growth % | 19.5% | 3.5% | |
| Communication | 8,883 | 10,426 | 11,984 |
| % of Total Revenue | 12.6% | 12.6% | 13.2% |
| Growth % | 17.4% | 14.9% | |
| Energy Utilities, Resources & Services | 8,297 | 10,390 | 11,736 |
| % of Total Revenue | 11.8% | 12.6% | 12.9% |
| Growth % | 25.2% | 13.0% | |
| Manufacturing | 6,671 | 8,152 | 9,131 |
| % of Total Revenue | 9.5% | 9.9% | 10.1% |
| Growth % | 22.2% | 12.0% | |
| Hi Tech | 5,131 | 6,177 | 6,972 |
| % of Total Revenue | 7.3% | 7.5% | 7.7% |
| Growth % | 20.4% | 12.9% | |
| Life Sciences | 4,698 | 5,203 | 5,837 |
| % of Total Revenue | 6.7% | 6.3% | 6.4% |
| Growth % | 10.7% | 12.2% | |
| Others | 2,325 | 2,294 | 2,471 |
| % of Total Revenue | 3.3% | 2.8% | 2.7% |
| Total Revenue | 70,523 | 82,677 | 90,793 |
The continued investment in improving digital capabilities and offerings to enable
clients transform their business and embrace digital technologies has paid off.
This is evident from the rise in Digital revenue as a percent of total revenue from
25% in FY2018 to 39% in FY2020.
Revenue distribution by offerings
| Particulars | FY 2018 | FY 2019 | FY 2020 |
|---|---|---|---|
| Digital | 25.50% | 31.2% | 39.2% |
| Core | 74.50% | 68.8% | 60.8% |
Customer concentration
| Revenue (%) | 2017 | 2018 | 2019 | 2020 |
|---|---|---|---|---|
| Revenue from Top Customer | 3.4 | 3.4 | 3.6 | 3.1 |
| Revenue from Top 10 Customer | 21.0 | 19.3 | 19.0 | 19.2 |
Revenue by geography
| Particulars | FY 2018 | FY 2019 | FY 2020 |
|---|---|---|---|
| North America | 42,575 | 50,038 | 55,807 |
| % of Total Revenue | 60.4% | 60.5% | 61.5% |
| Growth% | 0.4% | 17.5% | 11.5% |
| Europe | 16,738 | 19,942 | 21,916 |
| % of Total Revenue | 23.7% | 24.1% | 24.1% |
| Growth | 8.7% | 19.1% | 9.9% |
| India | 2,231 | 2,048 | 2,365 |
| % of Total Revenue | 3.2% | 2.5% | 2.6% |
| Growth | 2.3% | -8.2% | 15.5% |
| Others | 8,978 | 10,647 | 10,703 |
| % of Total Revenue | 12.7% | 12.9% | 11.8% |
| Growth | 5.6% | 18.6% | 0.5% |
| Total Reveue | 70,522 | 82,675 | 90,791 |
Digital Revenue
| Particulars | FY 2019 | FY 2020 |
|---|---|---|
| Financial Services | 8,277 | 11,562 |
| % of Total Digital Revenue | 32.1% | 32.5% |
| Growth % | 39.7% | |
| Retail | 4,715 | 6,165 |
| % of Total Digital Revenue | 18.3% | 17.3% |
| Growth % | 30.8% | |
| Communication | 3,598 | 4,843 |
| % of Total Digital Revenue | 13.9% | 13.6% |
| Growth % | 34.6% | |
| Energy Utilities, Resources & Services | 3,061 | 4,485 |
| % of Total Digital Revenue | 11.9% | 12.6% |
| Growth % | 46.5% | |
| Manufacturing | 2,427 | 3,481 |
| % of Total Digital Revenue | 9.4% | 9.8% |
| Growth % | 43.4% | |
| Hi Tech | 2,084 | 2,541 |
| % of Total Digital Revenue | 8.1% | 7.1% |
| Growth % | 21.9% | |
| Life Sciences | 1,289 | 1,850 |
| % of Total Digital Revenue | 5.0% | 5.2% |
| Growth % | 43.5% | |
| Others | 346 | 690 |
| % of Total Digital Revenue | 1.3% | 1.9% |
| Total | 25,798 | 35,621 |
Margins
| Segmental Operating Profit | FY 2018 | FY 2019 | FY 2020 |
|---|---|---|---|
| Financial Services | 6,370 | 6,878 | 7,306 |
| Margins % | 27.5% | 26.0% | 25.5% |
| Retail | 3,303 | 4,034 | 4,212 |
| Margins % | 29.1% | 29.8% | 30.0% |
| Communication | 2,619 | 2,517 | 2,424 |
| Margins % | 29.5% | 24.1% | 20.2% |
| Energy Utilities, Resources & Services | 2,411 | 2,542 | 3,216 |
| Margins % | 29.1% | 24.5% | 27.4% |
| Manufacturing | 1,274 | 1,853 | 2,059 |
| Margins % | 19.1% | 22.7% | 22.5% |
| Hi Tech | 1,446 | 1,548 | 1,604 |
| Margins % | 28.2% | 25.1% | 23.0% |
| Life Sciences | 1,391 | 1,419 | 1,431 |
| Margins % | 29.6% | 27.3% | 24.5% |
| Others | 199 | 116 | 64 |
| Margins % | 8.6% | 5.1% | 2.6% |
| Total | 19,015 | 20,909 | 22,318 |
Industry
Software and computing technology is transforming businesses in every industry around the world in a profound and fundamental way. The continued reduction in the unit cost of hardware, the explosion of network bandwidth, advanced software technologies and technology-enabled services are fueling the rapid digitization of business processes and information. The digital revolution is cascading across industries, redefining customer expectations, automating core processes and enabling software-based disruptive market offerings and business models. This disruption is characterized by personalized user experiences, innovative products and services, increased business agility, extreme cost performance and a disintermediation of the supply chain.
Leveraging technologies and models of the digital era to both extend the value of existing investments and, in parallel, transform and future-proof businesses, is increasingly becoming a top strategic imperative for business leaders.
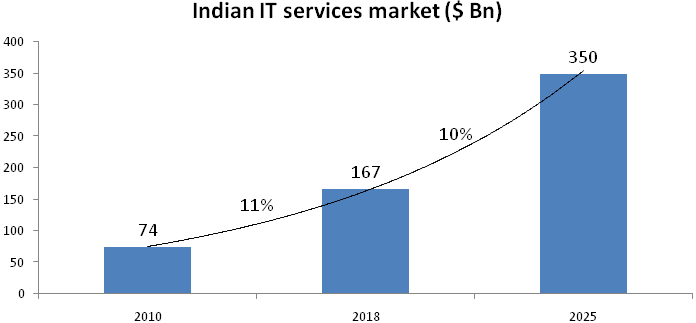
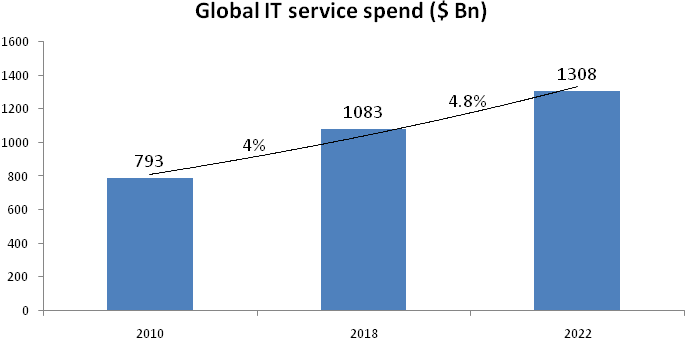
The Indian IT services market is expected to grow at 10% CAGR over 2019-2025 and generate revenues of $ 350 billion, while Global IT services spend is expected to grow at 4.8% CAGR over 2019-2022 according to Gartner report on Trends, Disruptors and the Future of Business & IT Services.
The fast pace of technology change and the need for technology professionals who are highly skilled in both traditional and digital technology areas are driving businesses to rely on third parties to realize their business transformation. Several new technology solutions and service providers have emerged over the years, offering different models for clients to consume their solutions and service offerings such as data analytics companies, software-as-a-service businesses, digital design boutiques, and specialty business process management firms.
The COVID-19 pandemic has disrupted demand and supply chains across industries, negatively impacting the business of companies. However, it is becoming evident that companies that have previously digitized their operations have been more resilient. Consequently, in the medium to long term, it is very likely that businesses will continue to spend on technology related initiatives with a greater focus on automation, remote working, cloud-based applications, optimization of legacy technology costs, etc. Several sectors are also seeking technology-based solutions immediately to tackle the health and economic crises – notably in healthcare, life sciences, banking, telecommunications and essential retail.
Risks & Concerns
- Foreign currency exposure: Foreign currency forwards and options contracts are entered into to mitigate the risk of changes in exchange rates on foreign currency exposures.
- Global economic recession: Clients’ business operations may be negatively impacted due to the economic downturn – resulting in postponement, termination, suspension of some ongoing projects and / or reduced demand for services and solutions.
- Cyber Security and Data privacy breach: Due to large number of employees working remotely, exposure to cyber security and data privacy breach incidents has increased.
- Legislation and Regulatory compliance: Government may enact restrictive legislation that could limit companies in those countries from outsourcing work.
Outlook & valuation
- We believe Infosys is a key beneficiary of increasing IT spends globally. The business is seeing significant traction in cyber security, workplace transformation, digital, and cloud. The deal pipeline is robust with healthy large deal wins.
- Infosys delivered strong Q1, where management has guided for 0-2% YoY growth in CC terms for FY21 with EBIT margin in the range of 21-23%. Notwithstanding higher variable pay to employees during the quarter, the company delivered robust margin expansion.
- The IT sector has shown strong capacity to recover quickly from the pandemic led disruption. With better-than-expected revenue and margins, we see scope for sector re-rating.
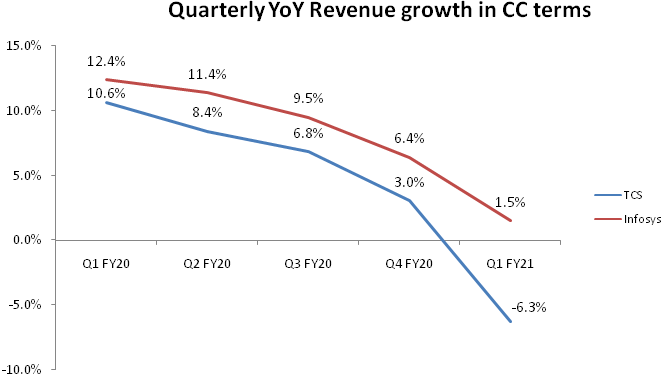
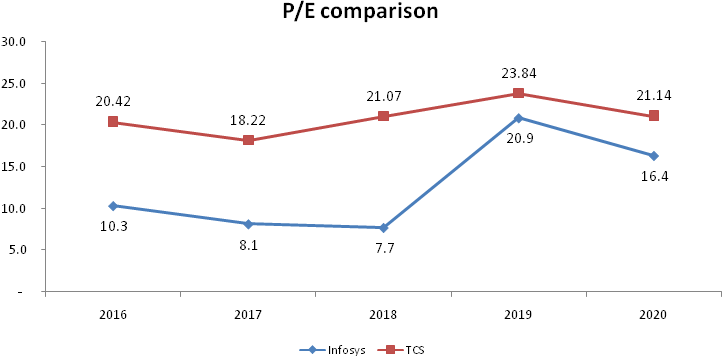
- Infosys continued to outperform TCS on the growth front for the 5th consecutive quarter and margin difference has also narrowed. We believe Infosys’ valuation should expand and the P/E difference as compared to TCS should narrow.
- We see strong upside in Infosys over the medium-to-long term given growth, margin expansion and narowing valuation divergence to TCS. Hence, we initiate ‘Buy’ on the stock. The stock is currently trading at 22x FY22 earnings.
Financial Statement
Profit & Loss statement
| Yr End March (Rs in cr.) | FY18 | FY19 | FY20 | FY21E | FY22E |
|---|---|---|---|---|---|
| Net Sales | 70522.00 | 82675.00 | 90791.00 | 98740.40 | 106509.90 |
| Growth % | 3.00% | 17.00% | 10.00% | 9.00% | 8.00% |
| Expenditure | 51629.00 | 62505.00 | 69035.00 | 73725.60 | 80614.40 |
| Employee Costs | 38893.00 | 45315.00 | 50887.00 | 54359.10 | 59172.30 |
| Other Expenses | 12736.00 | 17190.00 | 18148.00 | 19366.50 | 21442.10 |
| EBITDA | 18893.00 | 20170.00 | 21756.00 | 25014.80 | 25895.50 |
| Growth % | 3.60% | 6.80% | 7.90% | 15.00% | 3.50% |
| EBITDA Margin % | 26.80% | 24.40% | 24.00% | 25.30% | 24.30% |
| Depreciation | 1863.00 | 2011.00 | 2893.00 | 3269.70 | 3516.10 |
| EBIT | 17030.00 | 18159.00 | 18863.00 | 21745.00 | 22379.40 |
| EBIT Margin % | 24.10% | 22.00% | 20.80% | 22.00% | 21.00% |
| Other Income | 3311.00 | 2882.00 | 3314.00 | 2298.60 | 2936.60 |
| Interest | - | - | 170.00 | 170.00 | 170.00 |
| PBT | 20341.00 | 21041.00 | 22007.00 | 23873.70 | 25146.10 |
| Tax | 4241.00 | 5631.00 | 5368.00 | 5823.30 | 6133.70 |
| Effective Tax Rate % | 21.00% | 27.00% | 24.00% | 24.00% | 24.00% |
| PAT | 16100.00 | 15410.00 | 16639.00 | 18050.30 | 19012.40 |
| Growth % | 12.00% | -4.30% | 8.00% | 8.50% | 5.30% |
| PAT Margin % | 23.00% | 19.00% | 18.00% | 18.00% | 18.00% |
| Basic EPS (Rs) | 35.54 | 35.44 | 38.97 | 42.38 | 44.64 |
Balance Sheet
| Yr End March (Rs cr) | FY18 | FY19 | FY20 | FY21E | FY22E |
|---|---|---|---|---|---|
| Share Capital | 1088.00 | 2170.00 | 2122.00 | 2122.00 | 2122.00 |
| Reserves & Surplus | 63835.00 | 62778.00 | 63328.00 | 72353.00 | 81859.00 |
| Net Worth | 64923.00 | 64948.00 | 65450.00 | 74475.00 | 83981.00 |
| Minority Interest | 1.00 | 58.00 | 394.00 | 394.00 | 394.00 |
| Non Current Liabilities | -421.00 | -278.00 | 4324.00 | 4324.00 | 4324.00 |
| Long Term Borrowings | - | - | - | - | - |
| Deffered Tax Liabilities | -741.00 | -700.00 | -776.00 | -776.00 | -776.00 |
| Long Term Provisions | 76.00 | 74.00 | 66.00 | 66.00 | 66.00 |
| Other Long Term Liabilities | 244.00 | 348.00 | 5034.00 | 5034.00 | 5034.00 |
| Current Liabilities | 14105.00 | 18638.00 | 20856.00 | 20600.00 | 20816.00 |
| Short Term Borrowings | - | - | - | - | - |
| Trade Payables | 694.00 | 1655.00 | 2852.00 | 2596.00 | 2812.00 |
| Other Current Liabilities | 10876.00 | 14840.00 | 15942.00 | 15942.00 | 15942.00 |
| Short Term Provisions | 2535.00 | 2143.00 | 2062.00 | 2062.00 | 2062.00 |
| Total Liabilities | 78608.00 | 83366.00 | 91024.00 | 99793.00 | 109515.00 |
| Assets | |||||
| Net Block | 12574.00 | 15710.00 | 23789.00 | 23519.00 | 23003.00 |
| Capital Work in Progress | 1606.00 | 1388.00 | 954.00 | 954.00 | 954.00 |
| Non Current Investments | 5756.00 | 4634.00 | 4137.00 | 4137.00 | 4137.00 |
| Long Term Loans & Advances | 8239.00 | 8069.00 | 6818.00 | 6818.00 | 6818.00 |
| Current Assets | 50433.00 | 53565.00 | 55326.00 | 64365.00 | 74603.00 |
| Cureent Investmets | 6407.00 | 6627.00 | 4655.00 | 4655.00 | 4655.00 |
| Other Current Assets | 8075.00 | 8592.00 | 9731.00 | 9731.00 | 9731.00 |
| Sundry Debtors | 13142.00 | 14827.00 | 18487.00 | 16842.00 | 18142.00 |
| Cash & Bank Balance | 19818.00 | 19568.00 | 18649.00 | 29334.00 | 38271.00 |
| Loans & Advance | 2991.00 | 3951.00 | 3804.00 | 3804.00 | 3804.00 |
| Total Assets | 78608.00 | 83366.00 | 91024.00 | 99793.00 | 109515.00 |
Cash Flow Statement
| Yr End March (Rs cr) | FY18 | FY19 | FY20 | FY21E | FY22E |
|---|---|---|---|---|---|
| PAT | 16029.00 | 15404.00 | 16594.00 | 18050.30 | 19012.40 |
| Depreciation | 1863.00 | 2011.00 | 2893.00 | 3269.70 | 3516.10 |
| Changes in Working Capital | 84.00 | -453.00 | -2367.00 | 1389.70 | -1084.90 |
| Other Items | -4758.00 | -2121.00 | -117.00 | - | - |
| Cash Flow From Operations | 13218.00 | 14841.00 | 17003.00 | 22709.80 | 21443.50 |
| Capital Expenditure | -1998.00 | -2445.00 | -3307.00 | -3000.00 | -3000.00 |
| Free Cash Flow | 11220.00 | 12396.00 | 13696.00 | 19709.80 | 18443.50 |
| Others | 6450.00 | 1870.00 | 3068.00 | - | - |
| Cash Flow From Investments | 4452.00 | -575.00 | -239.00 | -3000.00 | -3000.00 |
| Dividend Paid (incl tax) | -7464.00 | -13705.00 | -9515.00 | -9025.20 | -9506.20 |
| Others | -13041.00 | -811.00 | -8169.00 | - | - |
| Cash Flow From Financing | -20505.00 | -14516.00 | -17684.00 | -9025.20 | -9506.20 |
| Net Change in Cash | -2835.00 | -250.00 | -920.00 | 10684.60 | 8937.30 |
| Cash at the beginning of the year | 22653.00 | 19818.00 | 19568.00 | 18648.00 | 29333.60 |
| Cash at the end of the year | 19818.00 | 19568.00 | 18648.00 | 29332.60 | 38270.90 |
Key Ratios
| Yr End March | FY18 | FY19 | FY20 | FY21E | FY22E |
|---|---|---|---|---|---|
| Basic EPS (Rs) | 35.54 | 35.44 | 38.97 | 42.38 | 44.64 |
| Diluted EPS (Rs) | 35.50 | 35.38 | 38.91 | 42.38 | 44.64 |
| DPS (Rs) | 43.50 | 21.50 | 17.50 | 21.20 | 22.30 |
| BVPS (Rs) | 148.90 | 149.40 | 154.60 | 175.80 | 198.10 |
| ROE % | 23.90% | 23.70% | 25.40% | 25.70% | 23.90% |
| ROCE % | 24.00% | 23.70% | 25.60% | 25.80% | 24.00% |
| Inventory Days | - | - | - | - | - |
| Sundry Debtors Days | 66.00 | 62.00 | 67.00 | 65.00 | 60.00 |
| Trade Payble Days | 3.00 | 5.00 | 9.00 | 10.00 | 9.00 |
| P/BV(X) | 3.80 | 5.00 | 4.10 | 5.60 | 5.00 |
| EV/EBITDA (X) | 11.70 | 14.70 | 11.50 | 15.40 | 14.50 |
| M Cap/Sales (X) | 3.50 | 3.90 | 3.00 | 4.20 | 3.90 |
| Net Debt/Equity (X) | - | - | - | - | - |
| Net Debt/EBITDA (X) | - | - | - | - | - |