Hikal Ltd
Pharmaceuticals & Drugs - Global
Hikal Ltd
Pharmaceuticals & Drugs - Global
Stock Info
Shareholding Pattern
Price performance
Indexed Stock Performance
Provider of World-Class Active Ingredients, Intermediates And R&D Services to Global Pharmaceuticals, Animal Health, Biotech, Crop Protection and Specialty Chemicals Companies
Company Profile
Hikal Limited was incorporated in the year 1988 as a private company by the Hiremath
family and Surajmukhi Investments and Finance Limited, a wholly-owned subsidiary
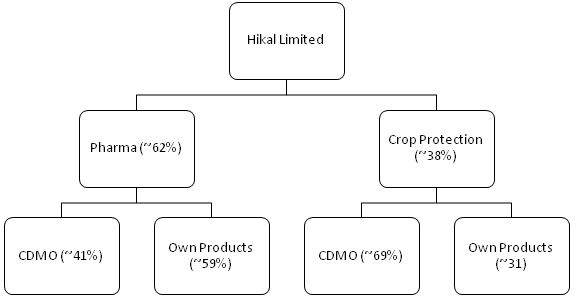
of Kalyani Steels Limited. It is predominantly a B2B player which provides intermediates
and active pharmaceutical ingredients (APIs) to global pharmaceutical, animal health,
crop protection, and speciality chemical companies. Today, Hikal is the leading
global supplier to the Life Sciences industry. The company operates in geographic
areas, including India, the USA, Canada, Europe, and South-East Asia. It has five
manufacturing facilities and one Research & Technology (R&T) facility. The
crop protection facilities are located at Taloja and Mahad (Maharashtra), R&T
facilities at Pune and the Pharmaceutical facilities in Jigani (Bengaluru) and Panoli
(Gujarat).

Source: Investor Presentation; StockAxis Research
Investment Rationale
Established Track Record and Dominant Position in a Few Products
The company has a strong product profile and entrenched relationship with leading
multi-national pharmaceutical as well as agro-chemical companies in the world. It
is exclusive supplier of various off-patent and on-patent protection chemicals to
innovators. It is the world’s largest supplier of Gabapentin (used
to treat epilepsy, neuropathic pain, hot flashes, and restless legs syndrome) with
the market leading position with a market share of ~35% as of FY20. The global Gabapentin
market size is projected to reach USD 1,686.7 million by 2026, from USD 1,515.5
million in 2020 (Source: marketwatch), which gives a potential visibility
for the company’s revenue growth. It is also the world’s largest supplier
of Thiabendazole (primarily used to control fungal diseases in fruits and
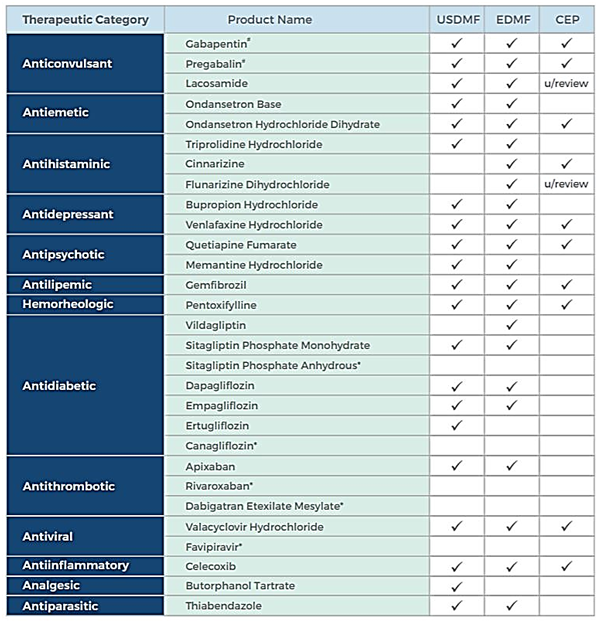
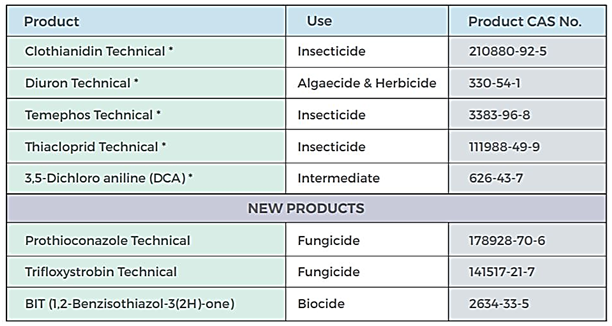
vegetables). Following are the product offerings by the company.
Product List – API

Source: Company Website; StockAxis Research
Product List – Crop Protection

Source: Company Website; StockAxis Research
Healthy Pipeline of Generic APIs
The company has a healthy pipeline of products under development for proprietary
and contract manufacturing, which could support the future growth and profitability,
especially in the export market. In Pharmaceutical segment, the company has three-four
generic products in the development stage and in crop protection, it has two products
under development. Also, it has several products under development for contract
manufacturing under the both divisions.
Factors such as increase in volume offtake for new product launches, ramp-up in production of high gross margin molecules, continuous development of new molecule pipeline and receipt of new inquiries from global customers aiming to diversify their supply chain, are some of the favourable growth prospects for the company. The company sees significant tailwinds in both businesses and with completion of the past capex program it is confident of maintaining growth trajectory over the next 2-3 years.
Client Base – Reputed and Diversified
The pharmaceutical division's client base is diverse, with the top three customers
accounting for ~38% of sales in FY20 and ~34% during H1FY21. The company is the
market leader in Gabapentin, which it sells to several major generic firms, including
the innovators. The top three customers in the crop protection segment accounted
for ~55% of revenue in FY20 and ~54% in H1FY21. The risk of customer concentration
is mitigated by the established presence of Hikal’s crop protection customers
and its exclusive supply contracts for multiple products with these companies.
In the Pharmaceutical segment, the company has recently signed a 10-year supply contract with a leading global multinational customer for a portfolio of niche APIs, marking a significant milestone in its animal health business. The company has teamed up with the customer to set up a new facility at Panoli site. As a result, the management expects that there will be more opportunities to expand the animal health business into a full-fledged vertical.
Strong Financial Performance
After posting ~5% dip in the top-line in FY20 due to several headwinds in the form
of inventory correction by several clients, water logging at Mahad facility, water
supply issues at Taloja facility, along with the demand disruption near the end
of the year on account of the Covid-19 pandemic, Hikal is now on the growth track.
From the beginning of FY21, it has posted the continuous growth in revenues, operating
margins, and bottom line.
During FY21, the top-line of the company grew 14.1% YoY on account of better sales volumes of new and existing products as well as penetration in the new markets. The Pharmaceutical division witnessed ~19% YoY growth backed by increased volumes of existing API Generics and CDMO products and crop protection division witnessed ~7% YoY growth enabled by strong recovery in H2FY21. Further, EBITDA grew by 18.1% YoY and margin stood at 18.8% (an expansion of 64bps YoY). The management expects margins to improve 50-100 bps/year on the back of several cost rationalisation and efficiency improvement measures. The PAT margins grew to 7.7% during the year, compared to 5.6% during FY20. Its profitability has been on the rise in FY21 as a result of focused business excellence initiatives, and management is optimistic that the bottom line to continue improve in the coming years.
The company sees substantial opportunities to profitably expand its business. It has hired a top global consultant to help it with a business transformation plan that will enable it to pivot its growth in a sustainable way. This strategic exercise will focus on increasing operational efficiency and finding and implementing new opportunities in order to achieve the company's strategic target in the next 4-5 years.
Outlook and Valuation
We believe that the company will continue to benefit from its established track record, healthy pipeline of generic APIs, introduction of new products, along with favourable growth prospects for the existing products. It has a healthy pipeline of products under development for proprietary and contract manufacturing, which is expected to support its growth prospects, especially in the export market. At the current market price of Rs. 377, the stock is trading at 19.8x of FY23E earnings.
Financial Statement
Profit & Loss statement
| Year End March (Rs. in Crores) | 2019 | 2020 | 2021 | 2022E | 2023E |
|---|---|---|---|---|---|
| Net Sales | 1589.61 | 1507.26 | 1720.44 | 1970.00 | 2260.00 |
| Growth % | 22.65% | -5.18% | 14.14% | 14.51% | 14.72% |
| Expenditure | |||||
| Material Cost | 853.82 | 776.32 | 908.38 | 1028.34 | 1175.20 |
| Employee Cost | 135.69 | 156.57 | 164.32 | 174.00 | 184.00 |
| Other Expenses | 301.98 | 301.22 | 324.85 | 388.09 | 448.61 |
| EBITDA | 298.13 | 273.16 | 322.89 | 379.57 | 452.19 |
| EBITDA Margin | 18.75% | 18.12% | 18.77% | 19.27% | 20.01% |
| Depreciation & Amortization | 92.88 | 82.46 | 85.24 | 98.03 | 113.71 |
| EBIT | 205.25 | 190.70 | 237.65 | 281.54 | 338.48 |
| EBIT Margin % | 12.91% | 12.65% | 13.81% | 14.29% | 14.98% |
| Other Income | 2.26 | 3.70 | 4.98 | 4.50 | 4.50 |
| Interest & Finance Charges | 58.43 | 52.42 | 36.20 | 34.82 | 27.32 |
| Profit Before Tax - Before Exceptional | 149.08 | 141.98 | 206.43 | 251.22 | 315.66 |
| Profit Before Tax | 149.08 | 126.58 | 206.43 | 251.22 | 315.66 |
| Tax Expense | 46.01 | 42.14 | 73.28 | 64.06 | 80.49 |
| Exceptional Items | - | -15.40 | - | - | - |
| Net Profit | 103.08 | 84.43 | 133.15 | 187.16 | 235.16 |
| Net Profit Margin | 6.48% | 5.60% | 7.74% | 9.50% | 10.41% |
| Consolidated Net Profit | 103.08 | 84.43 | 133.15 | 187.16 | 235.16 |
| Net Profit Margin after MI | 6.48% | 5.60% | 7.74% | 9.50% | 10.41% |
Balance Sheet
| As of March (Rs. in Crores) | 2019 | 2020 | 2021 | 2022E | 2023E |
|---|---|---|---|---|---|
| Share Capital | 24.66 | 24.66 | 24.66 | 24.66 | 24.66 |
| Total Reserves | 731.55 | 791.84 | 908.74 | 1071.24 | 1281.74 |
| Shareholders' Funds | 756.21 | 816.50 | 933.40 | 1095.90 | 1306.40 |
| Non Current Liabilities | |||||
| Long Term Borrowing | 297.84 | 303.40 | 262.89 | 214.32 | 164.32 |
| Current Liabilities | |||||
| Short Term Borrowings | 301.88 | 257.54 | 251.43 | 200.00 | 150.00 |
| Trade Payables | 160.01 | 201.16 | 229.62 | 262.88 | 301.32 |
| Other Current Liabilities | 136.11 | 133.28 | 171.29 | 171.29 | 171.29 |
| Total Equity & Liabilities | 1774.65 | 1879.44 | 1913.22 | 2083.55 | 2232.49 |
| Assets | |||||
| Net Block | 712.96 | 735.22 | 712.56 | 864.53 | 950.82 |
| Current Assets | |||||
| Currents Investments | - | - | - | - | - |
| Inventories | 364.23 | 312.46 | 266.70 | 303.32 | 347.67 |
| Sundry Debtors | 349.72 | 340.44 | 485.53 | 480.26 | 550.48 |
| Cash and Bank | 31.74 | 63.57 | 36.81 | 50.00 | 64.00 |
| Total Assets | 1774.65 | 1879.44 | 1913.22 | 2083.55 | 2232.49 |