
Hatsun Agro Products Ltd
Milk Products
Hatsun Agro Products Ltd
Milk Products
Stock Info
Shareholding Pattern
Price performance
Indexed Stock Performance

India is the highest milk producer in the world & Hatsun is the largest private dairy player.
Founded by RG Chandramogan in 1970, Chennai-based Hatsun Agro Products (Hatsun) started producing ice cream under its flagship brand Arun. In 1993, it started marketing fresh milk in pouches and from 2003, it began manufacturing dairy ingredients.
Hatsun manufactures and markets products that cater to both cooking and consumption, like milk, curd, ice creams, dairy whitener, skimmed milk powder, ghee, paneer, etc. The company’s brands have become household names in over one million Indian houses. Arun Ice creams, Arokya Milk, Hatsun Curd, Hatsun Paneer, Hatsun Ghee, Hatsun Dairy Whitener, Ibaco, etc. have become popular choices across the country. This year, the company plans to expand its markets to states such as Andhra Pradesh, Telangana and Maharashtra. Hatsun also has global presence in dairy ingredients; the company exports to 38 countries around the world - primarily America, the Middle East and South Asian markets.
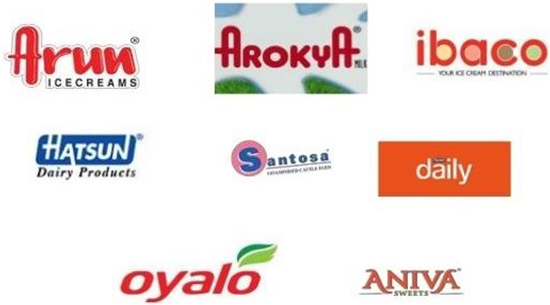
Hatsun has a production capacity close to 33 lakh litres on average from nearly four lakh farmers through its network of around 10,000 milk banks, with bulk milk coolers running entirely on thermal batteries. Hatsun generates more than 95% of its revenue from sales of products to retail consumers under brands such as Arokya Milk, Arun Ice creams, Hatsun, Hatsun Daily, Ibaco, Santosa, Oyalo and Aniva.
Strong brand equity: Hatsun enjoys leadership position in southern states of India. The company’s journey began over 5 decades ago with Arun Ice creams. Since then, the company has branched out into a number of brands that have gone on to become household names. Currently the company has 5 key brands under its umbrella.
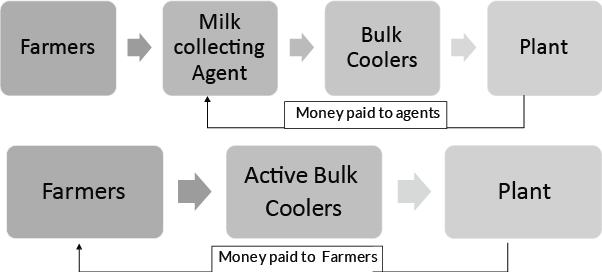
Well established network: Hatsun has spent more than 4 decades in the dairy business; during the course of business, the company has developed its own farmer network for milk procurement. Hatsun purchases milk directly from the farmers, i.e. there are no agents involved. This unique strategy has helped the company to strengthen its relationship with farmers. Long standing relations with farmers creates an entry barrier for other players. Creating a procurement network requires huge investments in active bulk coolers.
Shift from unorganised to organised players: In India, dairy is one of the industries with a large number of unorganised players. In the past couple of years, there has been a shift from unorganised players to organised players. We observed that there is high acceptance of products from organised players over products of unorganised players due to superior quality at best price.
Focus on high margin products: Hatsun offers a wide range of products in the dairy segment. Different milk-based value added products (VAP) have different margins. Hatsun derives 30% of sales from value added products. The company’s key value added products include ice-creams, curd, ghee etc. As per Crisil, value added products like curd and ice creams are growing at a high double-digit rate.
Favourable milk cycle will lead to higher margins: The productivity of cows/buffaloes is cyclical in India. Milk productivity depends on monsoons, temperature levels and quality of fodder. We believe lower procurement costs will lead to margin expansion.
Outlook & valuation
Hatsun Agro Product’s story is one of dedication and simplicity, and started with the introduction of Arun Ice creams. The company is one of the largest players in the organised dairy sector in south India. Hatsun enjoys leadership position (30% market share) in ice creams in southern India and we expect the same to be replicated in other value added products. Hence, we recommend “Buy” on Hatsun on the back of strong brand equity, shift from unorganised to organised players, lower procurement costs, increase in sales of value added products and newer capacities. Currently the company is trading at EV/EBITDA of 16.88x. Hatsun being a dominating player usually trades at bit higher valuation as compared to its listed peers such as, Parag Milk trades at 4.6x EV/EBITDA.
Consolidated Financial Statements
| (In Rs Cr) | Sales | EBITDA | EBITDA % | PAT | EPS | ROE % | EV/EBITDA | P/BV |
|---|---|---|---|---|---|---|---|---|
| FY18 | 4287.00 | 372.00 | 8.70% | 91.00 | 6.00 | 25.40% | 31.70 | 28.80 |
| FY19 | 4760.00 | 441.00 | 9.30% | 115.00 | 7.00 | 19.60% | 27.90 | 14.10 |
| FY20 | 5308.00 | 550.00 | 10.40% | 112.00 | 7.00 | 13.20% | 17.00 | 9.40 |
| FY21E | 5839.00 | 642.00 | 11.00% | 161.00 | 10.00 | 17.10% | 21.00 | 12.90 |
| FY22E | 6540.00 | 765.00 | 11.70% | 216.00 | 13.00 | 21.80% | 17.00 | 11.20 |
Investment Rationale
Strong brand equity:
Hatsun enjoys leadership position in southern states of India. The company’s
journey began over 5 decades ago with Arun Ice creams. Since then, the company has
branched out into a number of brands that have gone on to become household names.
Currently the company has 5 key brands under its umbrella. Hatsun dominates the
frozen dessert segment in South India. We expect the company to replicate its success
of Arun Ice creams in other value added products (VAP) in the dairy segment. To
strengthen its brand equity, Hatsun spends around 2-3% of revenues in brand building.
Key Brands:
Arun Ice creams:
Arun Ice creams is the company’s most well-known brand. When other ice cream
brands opened parlours exclusively in the city, Hatsun decided to take Arun Ice
creams to suburban and rural areas, leading ice cream into the hearts of millions.
Arun Ice creams caters to different people with different tastes with a whole range
of ice cream bars exclusively for kids and novel ice cream flavours like Indian
sweets. The brand also consistently introduces new flavours every season to ensure
customers have something fresh to look forward to every time they walk into an Arun
Ice creams parlour.
Arokya Milk:
Launched in 1995, Arokya is the flagship brand of the company. The company has won
the trust of millions of consumers across Tamil Nadu, Andhra Pradesh, Telangana,
Karnataka and parts of Maharashtra. The popularity of Arokya can be attributed to
the fact that a whole eco-system has been built around the brand promise “Goodness
with care, from our villages”. Great care and hygiene go into the
procurement, processing and packaging of Arokya Milk to ensure it’s made available
to consumers in a healthy way. Under the Arokya brand, the company also offers curd.
It is available in various convenient formats.
Ibaco:
Ibaco is dedicated to conjuring up a delightful, unique ice cream eating experience.
With 36 flavours inspired from exotic places around the world, Ibaco aims to offer
more choices and deliver greater standards of taste to its customers. From Madagascar
Bean Vanilla to delicious Ghanaian Chocolate, the parlour offers something new and
exciting to look forward to.
Santosa:
In an endeavour to help farmers in taking care of the health of their cattle, Hatsun
manufactures and produces Santosa cattle feed, with an aim to provide the best quality
feed. Located in Palani district of Tamil Nadu, Santosa has ultra-modern and state-of-the-art
facilities and produces Cattle Feed as per the Bureau of Indian Standards (BIS).
Santosa cattle feed helps increase milk yield and milk quality.
Oyalo:
The brand has a range of pizzas, pastas and desserts to choose from. In keeping
with the company’s legacy of always giving something new to customers, Oyalo
offers a number of different pizza variants.
Exhibit No 1: Hatsun’s Brands
Source: StockAxis Research
Well established network:
Hatsun has spent more than 4 decades in the dairy business; during the course of
business, the company has developed its own farmer network for milk procurement.
Hatsun purchases milk directly from the farmers, i.e. there are no agents involved.
This unique strategy has helped the company to strengthen its relationship with
farmers. Long standing relations with farmers creates an entry barrier for other
players. Creating a procurement network requires huge investments in active bulk
coolers. Hatsun has already made heavy investments in the past and has developed
a huge farmer network of its own. The company focuses on transparent milk procurement
systems at the village level. The company has set up more than 10,000 Hatsun Milk
Banks (HMBs) encompassing 13,000 villages covering more than 4 lakh farmers. Hatsun
ensures payment to farmers for the milk procured every 10 days without any disruption
or delay and has maintained a track record of doing this over two decades. The average
procurement by Hatsun during the FY 2019-20 was 27.26 LLPD.
Exhibit No 2: Milk procurement process
Source: StockAxis Research
Shift from unorganised to organised players:
In India, dairy is one of the industries with a large number of unorganised players.
In the past couple of years, there has been a shift from unorganised players to
organised players. We observed that there is high acceptance of products from organised
players over products of unorganised players due to superior quality at best price.
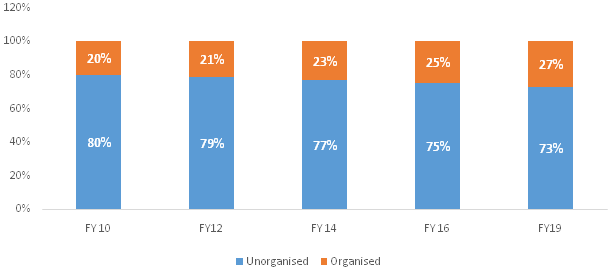
As per Crisil, the share of organised players has grown to 27% in FY19 from 20%
in FY10. Organised players are able to grow their revenues by 15% CAGR between
FY13-18, while the industry has clocked the revenue CAGR of 12%.
Exhibit No 3: Industry trends
Source: StockAxis Research
Focus on high margin products:
Hatsun offers a wide range of products in the dairy segment. Different milk-based
value added products (VAP) have different margins. Hatsun derives 30% of sales from
value added products. The company’s key value added products include ice-creams,
curd, ghee etc. As per Crisil, value added products like curd and ice creams are
growing at a high double-digit rate. Milk demand, on the other hand, is growing
at mid-to-high single digit rate in India. We expect higher sales of value added
products going forward due to entry in newer geographies like Maharashtra and newer
capacities for value added products.
Favourable milk cycle will lead to higher margins:
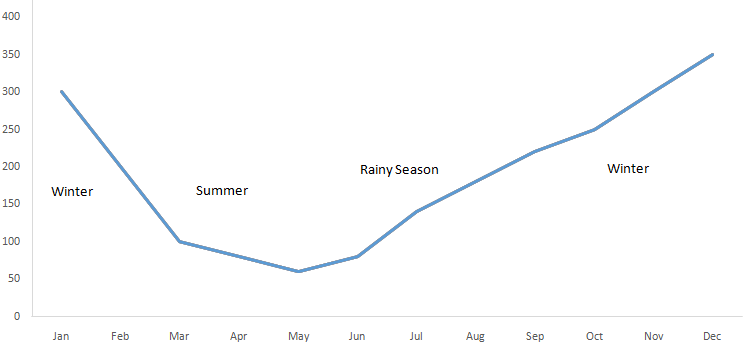
The productivity of cows/buffaloes is cyclical in India. Milk productivity depends
on monsoons, temperature levels and quality of fodder. If a bovine gives 1 litre
of milk in summer, her productivity increases to ~1.2 litres in winter. The cyclical
nature of milk production results in volatile milk prices in India. In the years
when milk prices are lower, dairy companies are not required to hike prices. Hence,
volume growth is largely revenue growth. As there is surplus milk situation in the
country, milk procurement costs have come down. We believe lower procurement costs
will lead to margin expansion.
Exhibit No 4: Milk productivity Cycle
Source: StockAxis Research
Financials
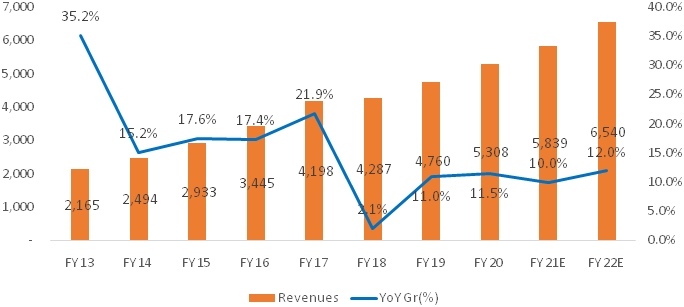
Revenues are expected to grow @~7% CAGR over FY20-FY22E
We expect Hatsun’s revenues to grow at 7% CAGR over FY20-FY22E to Rs. 6,540
crores mainly due to increase in sales from value added products and entry in new
geographies. Hatsun’s revenues grew by 5% CAGR during FY18-FY20. We expect
revenues to grow by 10% yoy in FY21 mainly due to impact of covid-19 in Q1 FY21.
The pandemic has resulted in a decline in out of home milk consumption as well as
for value added products such as frozen desserts, curd, butter, etc. Hence we expect
Hatsun will clock low double digit growth on yoy basis for FY21.
Exhibit no 5: Revenue trends (In Rs. cr)
Source: StockAxis Research
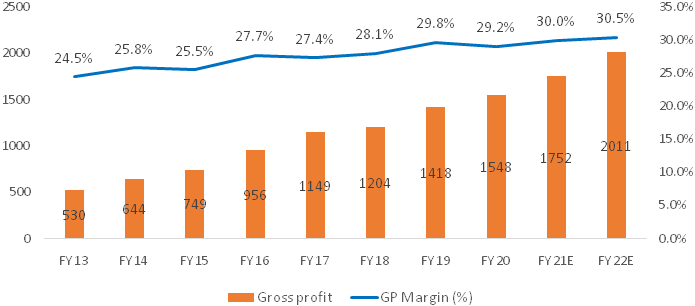
Gross profit margins are expected to expand by ~150 bps over FY20-FY22E
We expect gross profits will continue to grow at CAGR of 9% over FY20-FY22E, and gross profit margins to expand by 150 bps over FY20-FY23E due to increase in sales of value added products and lower procurement costs of milk. We expect gross profits to grow in FY21/FY22 by 13% and 15% yoy respectively. We expect value added products such as ice-creams and curd to grow in high double digit rate in upcoming years.
Exhibit No 6: Gross profit and Gross profit margin trend (In Rs. cr)
Source: StockAxis Research
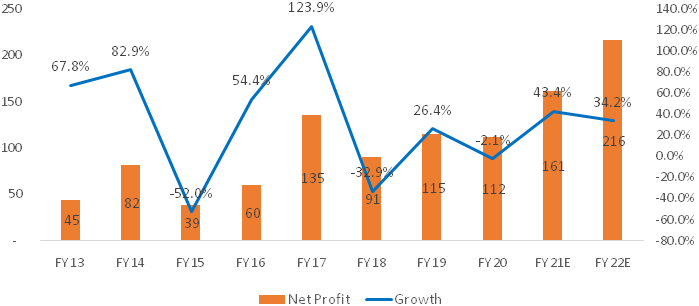
Net profit is expected to grow at ~24% CAGR
Net profit is expected to clock growth of 24% CAGR over FY20-22E due to increase
in sales of high margin value added products, lower milk procurement costs, operational
efficiency and lower tax rates. Hatsun’s net profit grew by 7% CAGR during
FY18-FY20.
Exhibit No 7: Net profit trend (In Rs. cr)
Source: StockAxis Research
Industry
India has been the leading producer and consumer of dairy products worldwide since 1998 with a sustained growth in milk and milk products. Dairy activities form an essential part of the rural Indian economy, serving as an important source of employment and income. However, the milk production per animal is significantly low as compared to the other major dairy producers.
Moreover, nearly all of the dairy produce in India is consumed domestically, with the majority of it being sold as milk. On account of this, the Indian dairy industry holds tremendous potential for value-addition and overall development. According to the latest report by IMARC Group, titled Dairy Industry in India 2020 Edition: Market Size, Growth, Prices, Segments, Cooperatives, Private Dairies, Procurement and Distribution, the dairy market in India reached a value of Rs 10,527 billion in 2019.
"India's dairy industry is worth Rs 5.4 trillion by value, having grown at 15 per cent CAGR during 2010-16. Going ahead, the dairy industry is expected to maintain 15 per cent CAGR over 2016-20, and attain value of Rs 9.4 trillion on rising consumerism. India has progressed from being deficient in milk production at 20 million MT in 1970 to becoming the world's largest milk producer at 160 million MT, accounting for 18.5 per cent of global milk production.
Importance of dairy sector in India
Dairy farming is an important way for farmers to increase their earnings and access
to more nutritious food for their families. While subsistence dairy farming provides
not only fresh milk and a source of basic income, value-added products, such as
yogurt and cheese provide a higher source of revenue. Dairying is an important source
of subsidiary income to small/marginal farmers and agricultural labourers. The manure
from animals provides a good source of organic matter for improving soil fertility
and crop yields. Dairy farming is now taken up as a main occupation around big urban
centres where the demand for milk is high.
For years, the dairy industry was focussed only on cow and buffalo milk and milk-based products. Rising Internet penetration and increasing consumer awareness have, however, upended this long-standing norm. Today, consumers are increasingly inclined towards better, healthier alternatives such as camel milk, goat milk or donkey milk. For instance, it has become common knowledge that camel milk does not contain A1 casein and beta-lacto globulin, which makes it fit to be consumed by those suffering from milk allergies and people who are lactose-intolerant. Camel milk is also gaining popularity since it aids digestion, improves gut health, may prevent high blood pressure and may even help ease the symptoms of autism in children. Further, goat and donkey milk are also gaining favour among health enthusiasts as they are light on the stomach and packed with essential nutrients.
Niche dairy products such as flavoured camel milk powder, camel milk-based skin care products or goat milk ghee will definitely attract more consumers in 2020.
Being one of the primary dairy consumables in India, the increased demand for milk in the country is owed to the increasing population. As of FY 2018, ~81.1% of the Indian dairy and milk processing market was part of the unorganised sector, which produces milk in unhygienic environments. This reduces the overall quality and nutrition levels of the milk produced.
As of 2018, India is the leading milk producing country in the world, accounting for ~19% of the global market share. The milk processing industry in India is expected to expand at a compound annual growth rate (CAGR) of ~14.8% between FY 2018 and FY 2023, and will reach Rs 2,458.7 billion in FY 2023.
Hatsun’s market positioning
We believe company has strong moats and healthy growth opportunities. Over the 5
decades in the Industry, company has created strong moats and it enjoys leadership
position in its key markets.
Strong moats of Hatsun
Product Mix superior to competitors: Hatsun competes with other dairies
in its key markets. Like other players Hatsun also has 3 variants in Milk i.e. Full
cream, Standard & Toned Milk. It offers more fat than its competitors offering
a rich experience.
Launch of small SKU’s to drive volumes: Hatsun was one of the first companies to sell smaller sachets of milk and offer value-added products. It sells milk sachets with grammage as low as 175ml. It sells these products at an affordable price point of Rs10. It is therefore able to attract students, working professionals and low income families. It also sells some variants of Arun ice cream at Rs5, which drives volumes. The company has also introduced ibaco chocolates at an attractive price point of Rs15.
Cluster approach: Despite of spreading too thin, the company has adopted a cluster approach. It focusses on establishing milk procurement, milk processing and distribution network to sell milk products in one or two districts. Once it develops strong presence, it moves to nearby new districts. The company started business from Tamil Nadu. After consolidating its business there, it moved to other southern states such as Andhra Pradesh, Telangana and Karnataka. It has already entered Maharashtra and Kerala, two years ago. The company also has recently entered Orissa. We note dairy company Parag has units in Maharashtra, Tamil Nadu, and Punjab. Thus, spreading too thin reduces the benefit of branding and scale.
Peer Comparison:
| Company | EBITDA Margin | PAT margin | RoCE | RoE | Working cap days | Debt to Equity(x) |
|---|---|---|---|---|---|---|
| Hatsun | 10.50% | 2.10% | 13.20% | 11.30% | 17.00 | 1.01 |
| Parag milk | 8.80% | 3.70% | 13.00% | 10.40% | 79.00 | 0.44 |
Source: Stockaxis research.
Risks & Concerns
Change in milk price cycle:
Milk prices are sensitive to monsoon. In a bad monsoon year, milk procurement cost
goes up and margins and profitability contract.
Rise in usage of alternatives:
As milk prices are usually on an increasing trend, ice creams, butter and chocolate
manufacturers have moved to alternative sources of fats such as vegetable fats.
If this trend continues, it may impact milk players such as Hatsun.
Competition from the state co-operatives:
All state co-operatives run on a no-profit model. Almost every state has its own
state co-operative. State-co-operatives dominate the market. In case of elections
or distress in the economy, co-operatives may opt to sell at a lower spread. This
may impact the profitability of private players in the short run.
Outlook & valuation
Hatsun Agro Product’s story is one of dedication and simplicity, and started with the introduction of Arun Ice creams. The company is one of the largest players in the organised dairy sector in south India. Hatsun enjoys leadership position (30% market share) in ice creams in southern India and we expect the same to be replicated in other value added products. Currently, Hatsun derives 30% of revenues from value added products which has higher contribution as compared to milk; we expect value added products to grow in high double-digit rate going forward. Additionally, in Q1 FY21, we observed favourable milk cycle with surplus milk situation in the country (mainly due to early lactation cycle). This will lead to lower procurement costs of milk which will aid margin expansion in future. Hence, we recommend “Buy” on Hatsun on the back of strong brand equity, shift from unorganised to organised players, lower procurement costs, increase in sales of value added products and newer capacities. Currently the company is trading at EV/EBITDA of 16.88x. Hatsun being a dominating player usually trades at bit higher valuation as compared to its listed peers such as, Parag Milk trades at 4.6x EV/EBITDA.
Financial Statement
Profit & Loss statement
| Year End March (In Rs. cr) | 2018 | 2019 | 2020 | 2021E | 2022E |
|---|---|---|---|---|---|
| Net Sales | 4287.00 | 4760.00 | 5308.00 | 5839.00 | 6540.00 |
| % Growth | 2.10% | 11.00% | 11.50% | 10.00% | 12.00% |
| Expenses | 3916.00 | 4319.00 | 4758.00 | 5197.00 | 5775.00 |
| Material Cost | 3084.00 | 3343.00 | 3761.00 | 4087.00 | 4529.00 |
| Employee Cost | 141.00 | 156.00 | 168.00 | 187.00 | 196.00 |
| Other expenses | 691.00 | 820.00 | 830.00 | 923.00 | 1033.00 |
| EBITDA | 372.00 | 441.00 | 550.00 | 642.00 | 765.00 |
| EBITDA Margin | 8.70% | 9.30% | 10.40% | 11.00% | 11.70% |
| Growth (%) | -1.70% | 18.80% | 24.70% | 16.70% | 19.10% |
| Depreciation & Amortization | 174.00 | 201.00 | 296.00 | 352.00 | 407.00 |
| EBIT | 198.00 | 241.00 | 254.00 | 291.00 | 359.00 |
| Other Income | 8.00 | 6.00 | 9.00 | 9.00 | 9.00 |
| Interest & Finance Charges | 88.00 | 86.00 | 106.00 | 84.00 | 78.00 |
| Exceptional Items | - | - | - | - | - |
| Profit Before Tax | 119.00 | 161.00 | 157.00 | 216.00 | 289.00 |
| Tax Expense | 28.00 | 46.00 | 44.00 | 54.00 | 73.00 |
| Effective Tax rate | 23.50% | 28.70% | 28.20% | 25.20% | 25.20% |
| Net Profit | 91.00 | 115.00 | 112.00 | 161.00 | 216.00 |
| Net Profit Margin | 2.10% | 2.40% | 2.10% | 2.80% | 3.30% |
| Growth | -32.90% | 26.40% | -2.10% | 43.40% | 34.20% |
| Adjusted EPS | 6.00 | 7.00 | 7.00 | 9.80 | 13.10 |
Balance Sheet
| Year End March (In Rs. cr) | 2018 | 2019 | 2020 | 2021E | 2022E |
|---|---|---|---|---|---|
| Share Capital | 15.00 | 16.00 | 16.00 | 16.00 | 16.00 |
| Total Reserves | 350.00 | 789.00 | 888.00 | 970.00 | 1122.00 |
| Shareholders' Funds | 366.00 | 805.00 | 904.00 | 986.00 | 1138.00 |
| Minority Interest | 0.00 | 0.00 | 0.00 | 0.00 | 0.00 |
| Total Non-current Liabilities | 571.00 | 543.00 | 916.00 | 866.00 | 791.00 |
| Deferred Tax Assets / Liabilities | 28.00 | 40.00 | 55.00 | 55.00 | 55.00 |
| Long Term Burrowing | 542.00 | 502.00 | 614.00 | 564.00 | 489.00 |
| Other Long Term Liabilities | 1.00 | 1.00 | 246.00 | 246.00 | 246.00 |
| Total Current Liabilities | 1095.00 | 898.00 | 894.00 | 920.00 | 938.00 |
| Trade Payables | 171.00 | 178.00 | 142.00 | 168.00 | 187.00 |
| Other Current Liabilities | 455.00 | 482.00 | 450.00 | 449.00 | 449.00 |
| Short Term Borrowings | 467.00 | 234.00 | 297.00 | 297.00 | 297.00 |
| Short Term Provisions | 2.00 | 4.00 | 6.00 | 6.00 | 6.00 |
| Total Equity & Liabilities | 2032.00 | 2246.00 | 2714.00 | 2772.00 | 2867.00 |
| ASSETS | |||||
| Total Non-Current Assets | 1547.00 | 1705.00 | 2152.00 | 2181.00 | 2154.00 |
| Net Block | 1217.00 | 1408.00 | 1520.00 | 1548.00 | 1522.00 |
| Lease Adjustment A/c | - | - | 231.00 | 231.00 | 231.00 |
| Capital Work in Progress | 259.00 | 233.00 | 355.00 | 355.00 | 355.00 |
| Long Term Loans & Advances | 71.00 | 64.00 | 46.00 | 46.00 | 46.00 |
| Total Current Assets | 485.00 | 541.00 | 562.00 | 591.00 | 713.00 |
| Inventories | 384.00 | 403.00 | 374.00 | 397.00 | 458.00 |
| Sundry Debtors | 7.00 | 8.00 | 15.00 | 15.00 | 17.00 |
| Cash and Bank | 33.00 | 36.00 | 45.00 | 50.00 | 110.00 |
| Other Current Assets | 23.00 | 24.00 | 65.00 | 65.00 | 65.00 |
| Short Term Loans and Advances | 39.00 | 69.00 | 64.00 | 64.00 | 64.00 |
| Total Assets | 2032.00 | 2246.00 | 2714.00 | 2772.00 | 2867.00 |
Cash Flow Statement
| Year End March (In Rs. cr) | 2018 | 2019 | 2020 | 2021E | 2022E |
|---|---|---|---|---|---|
| Profit After Tax | 91.00 | 115.00 | 112.00 | 161.00 | 216.00 |
| Depreciation | 174.00 | 201.00 | 296.00 | 352.00 | 407.00 |
| Changes In working Capital | 89.00 | -65.00 | -35.00 | 2.00 | -44.00 |
| Cash Flow after changes in Working Capital | 353.00 | 250.00 | 374.00 | 515.00 | 594.00 |
| Other Items | 80.00 | 27.00 | 1.00 | - | - |
| Cash From Operating Activities | 433.00 | 277.00 | 375.00 | 515.00 | 594.00 |
| Purchase of Fixed Assets | -573.00 | -533.00 | -351.00 | -380.00 | -380.00 |
| Sale of Fixed Assets | 2.00 | 7.00 | 9.00 | - | - |
| Others | 2.00 | 3.00 | 0.00 | - | - |
| Cash Flow from Investing Activities | (569) | (523) | (343) | (380) | (380) |
| Free Cash Flows | (140) | (256) | 24.00 | 135.00 | 214.00 |
| Increase / (Decrease) in Loan Funds | 219.00 | 233.00 | -39.00 | - | - |
| Short Term Loans | 32.00 | 147.00 | -233.00 | - | - |
| Increase / (Decrease) in Loan Funds | 251.00 | 380.00 | -272.00 | -50.00 | -75.00 |
| Equity Dividend Paid | -18.00 | -73.00 | -94.00 | -66.00 | -66.00 |
| Income tax on dividend paid | - | - | - | -14.00 | -14.00 |
| Others | -70.00 | -84.00 | 334.00 | 12.00 | - |
| Cash from Financing Activites | 162.00 | 223.00 | (31) | (117) | (154) |
| Net Cash Inflow / Outflow | 26.00 | -23.00 | 1.00 | 18.00 | 59.00 |
| Opening Cash & Cash Equivalents | 28.00 | 54.00 | 32.00 | 33.00 | 50.00 |
| Closing Cash & Cash Equivalent | 54.00 | 32.00 | 33.00 | 50.00 | 110.00 |
Key Ratios
| Year End March | 2018 | 2019 | 2020 | 2021E | 2022E |
|---|---|---|---|---|---|
| Per Share | |||||
| Basic EPS | 5.90 | 7.20 | 6.80 | 9.80 | 13.1 |
| Diluted EPS | 5.90 | 7.20 | 6.80 | 9.80 | 13.1 |
| BVPS | 23.70 | 50.40 | 54.90 | 59.90 | 69.10 |
| DPS | 4.00 | 4.00 | 4.00 | 4.00 | 4.00 |
| ROE (%) | 25.40% | 19.60% | 13.20% | 17.10% | 21.80% |
| ROCE (%) Post Tax | 13.10% | 12.10% | 11.20% | 12.20% | 15.40% |
| Receivable Days | 2.00 | 1.00 | 1.00 | 1.00 | 1.00 |
| Inventory Days | 29.00 | 30.00 | 27.00 | 24.00 | 24.00 |
| Payable Days | 15.00 | 13.00 | 11.00 | 10.00 | 10.00 |
| Working Capital (days) | 16.00 | 17.00 | 17.00 | 15.00 | 15.00 |
| Liquidity ratios | |||||
| Total debt/Equity | 3.55 | 1.28 | 1.01 | 0.87 | 0.69 |
| Net debt/Equity | 3.46 | 1.23 | 0.96 | 0.82 | 0.59 |
| Valuation Ratios | |||||
| EV/EBITDA | 31.70 | 27.90 | 17.00 | 21.00 | 17.00 |
| P/BV | 28.80 | 14.10 | 9.40 | 12.90 | 11.20 |
| P/Sales | 2.50 | 2.40 | 1.60 | 2.20 | 1.90 |
| P/FCF | -74.90 | -44.40 | 358.50 | 94.20 | 59.40 |