
Gland Pharma Ltd
Pharmaceuticals & Drugs
Gland Pharma Ltd
Pharmaceuticals & Drugs
Stock Info
Shareholding Pattern
Price performance
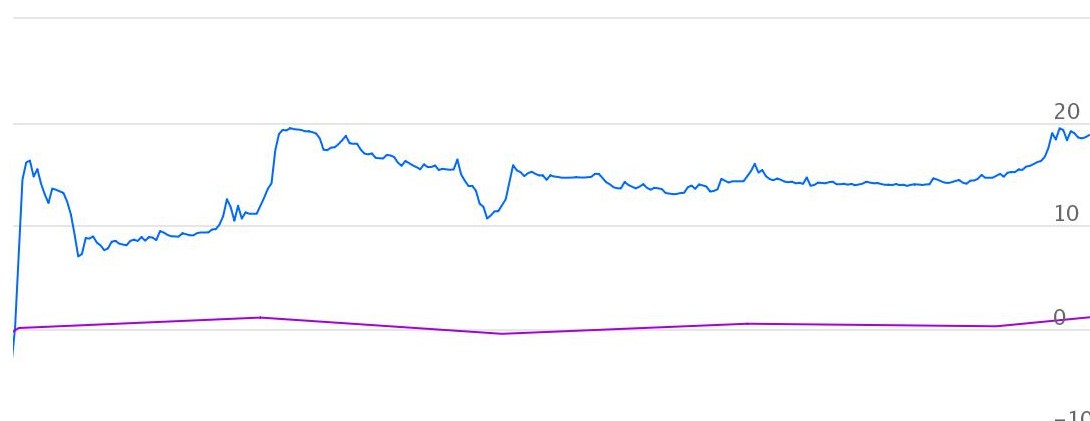
Indexed Stock Performance
Robust growth in Injectables with unique capabilities and strong execution
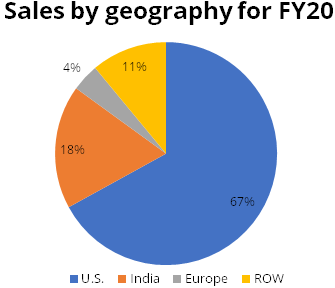
Gland Pharma (Gland) is one of the fastest growing global pure-play companies in the injectables space. Gland sells its products in more than 60 countries across 5 continents, including the United States, Europe, Canada, Australia, India and other markets. U.S. accounted for 67% of total sales while India accounted for about 18% sales in FY20. Sales in Europe, Canada, Australia and Rest of the World (ROW) markets accounted for the balance sales.
The company’s key molecules include Heparin Sodium Injection, Enoxaparin Sodium Injection, Rocuronium Bromide Injection, Daptomycin Injection, etc. Gland is present in many therapeutic categories like Anti-Infectives, Anesthetics, Anti-Coagulants and their Antidotes, Anti-Malarial, Cardiology etc. Most of the company’s products are used in the critical care segment.
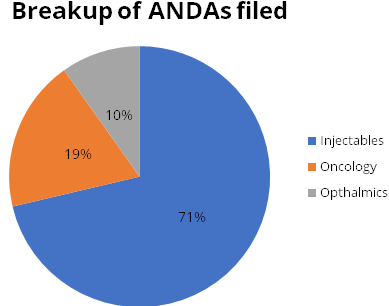
The company’s key focus is the business of Injectables. Oncology and Ophthalmic are other key areas of growth. 70% of Abbreviated New Drug Application (ANDA) filings are in Injectables, 20% in Oncology and 10% in Ophthalmic.
Gland follows the B2B business model in exports and B2C in domestic markets. 96% of revenues in FY20 came from its B2B business.
Investment Rationale
Injectables space – high growth, niche area with few competitors
According to IQVIA Consulting and Information Services India Pvt. Ltd. – 2020,
the share of injectables in the global pharma market is increasing at a rapid rate.
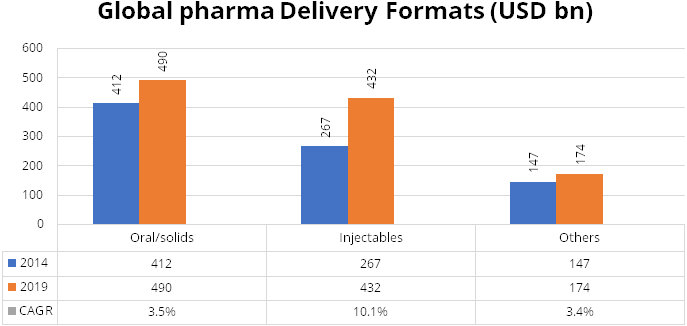
Injectables have been competing with oral solids for administering medications.
While injectables trail oral solids currently, this method of administering medication
is growing at a higher rate than oral solids. While injectables grew at a CAGR of
10.1% during the period 2014-2019, orals solids saw a fall in its share from more
than 50% to 45% during the same period. During 2014-19, oral solids grew at a modest
CAGR of 3.5%.
Generic Injectables – high growth potential
According to IQVIA, US accounted for about 35% of global generic injectables market
and recorded CAGR of 12.5% during the period 2014-2019. US generic injectables growth
is the highest followed by Europe and ROW with CAGR of about 9%. In 2019, the total
US injectables market was estimated at USD 230 billion growing at CAGR of 13.6%.
We believe Gland is well entrenched in the US market through its partners to participate
in the high growth trajectory of injectables in US.
Impeccable track record on compliance
Despite having a very high proportion of sales from complex generic injectables
from US, Gland has maintained an impeccable track record on compliance. The company
has not received any warnings or observations from the USFDA in the last 5 years.
It has 7 manufacturing facilities in India (4 formulations and 3 Active Pharmaceutical
Ingredients (API)).
Emphasis on R&D and quality
Gland spends about 3.5-4% of revenues on R&D in order to maintain high standards
of quality andcarve a niche in complex generics. The company has filed 265 ANDAs
with USFDA. Out of these, injectable products account for 189 (~70%), Oncology products
account for 50 (20%) and Ophthalmic products account for 26 (10%). The company files
ANDA directly and through its partners. Currently, out of 265 ANDAs, 100 are owned
products and 165 are filed through partners. The company has 61 ANDAs pending for
approvals out of which 37 are own and 24 through partners.
Chinese parent offers twin advantages of new market (China) and raw material source
Gland’s main promoter is Shanghai FosunPharma of China, which gives the company
access to the Chinese market. Gland filed its first product in China in 2019 and
has filed applications for 6 products in 2020. The company plans to file applications
for a few more products in 2021. The Chinese parent also provides Gland with bargaining
power and favourable scale to procure raw material andequipment from China.
Niche products with limited competitors
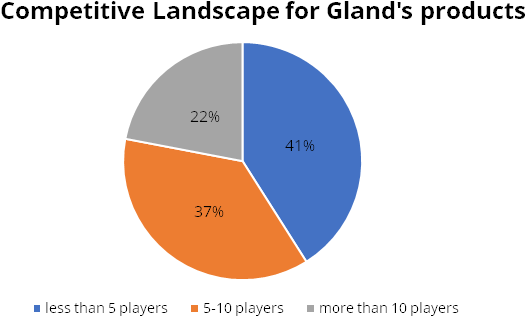
According to the company’s IPO prospectus, about 40% of Gland’s key
molecules have only 5 competitors; another 40% have 4-10 players. Only 20% of the
company’s products have more than 10 competitors. With fewer players in this
space, the company faces a lower risk of price erosion.
Valuation & Outlook
Gland has recently listed on the Indian bourses at prices that are higher than expectations.
At CMP of Rs 2,178, the stock is trading at 34x/29x FY22E/FY23E EPS. We strongly
believe Gland deserves premium PER multiple of ~30x I year forward as compared to
median multiple of major companies comprising the Indian pharma sector (18x-23x)
including Cadila, Cipla, SunPharma, Dr Reddy’s, Auro, etc. We expect Gland
to trade at a multiple between that of Divis and median of the industry.
Consolidated Financial Statements
| Rs in cr. | Net Sales | EBITDA | EBITDA % | PAT | EPS | ROE % | PE | EV/EBITDA |
|---|---|---|---|---|---|---|---|---|
| FY18 | 1619.94 | 535.11 | 33.00% | 321.11 | 207.24 | 13.00% | - | - |
| FY19 | 2044.20 | 706.31 | 35.00% | 451.91 | 291.65 | 16.00% | - | - |
| FY20 | 2633.24 | 955.47 | 36.00% | 772.86 | 49.65 | 21.00% | - | - |
| FY21E | 3028.23 | 1211.29 | 40.00% | 903.00 | 55.40 | 20.00% | 39.60 | 4.10 |
| FY22E | 3482.46 | 1392.98 | 40.00% | 1054.00 | 64.60 | 19.00% | 33.70 | 2.90 |
| FY23E | 4004.83 | 1601.93 | 40.00% | 1227.00 | 75.30 | 20.00% | 28.90 | 1.90 |
Investment Rationale
Injectables space – high growth, niche area with few competitors
According to IQVIA Consulting and Information Services India Pvt. Ltd. – 2020,
the share of injectables in the global pharma market is increasing at a rapid rate.
Injectables have been competing with oral solids for administering medications.
While injectables trail oral solids currently, this method of administering medication
is growing at a higher rate than oral solids. While injectables grew at a CAGR of
10.1% during the period 2014-2019, orals solids saw a fall in its share from more
than 50% to 45% during the same period. During 2014-19, oral solids grew at a modest
CAGR of 3.5%.
Injectables are becoming the preferred way of administering drugs. Gland being a global pure play injectables producer, stands to benefit from the high growth in this segment.
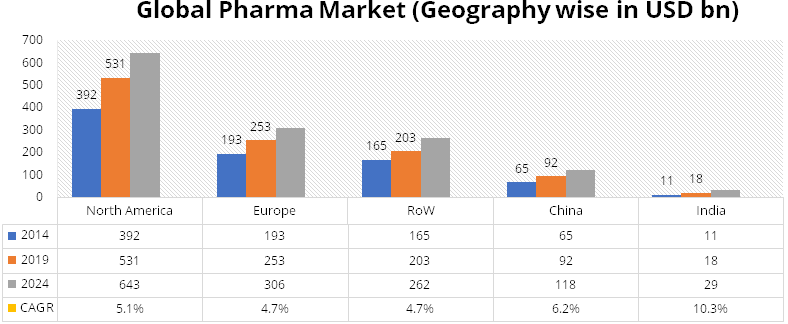
Source: IQVIA Consulting and Information Services India Pvt. Ltd. – 2020
Generic Injectables – high growth potential
According to IQVIA, US accounted for about 35% of global generic injectables market
and recorded CAGR of 12.5% during the period 2014-2019. US generic injectables growth
is the highest followed by Europe and ROW with CAGR of about 9%. In 2019, the total
US injectables market was estimated at USD 230 billion growing at CAGR of 13.6%.
We believe Gland is well entrenched in the US market through its partners to participate
in the high growth trajectory of injectables in US.
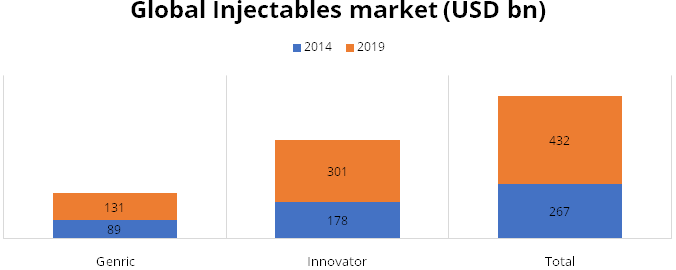
Source: IQVIA Consulting and Information Services India Pvt. Ltd. – 2020
Oral generic penetration in US and across the world markets is in the range of 80-90%, while in injectables it is still low at less than 60-70% (especially in US generic injectables penetration is around 59% in 2019). There is a rising demand for self‐administered medications such as auto injectors, pen injectors, prefilled syringes (“PFS”), and needle-free injectors. With new ailments being treated through injectable solutions, the penetration level of generic injectables will only increase.
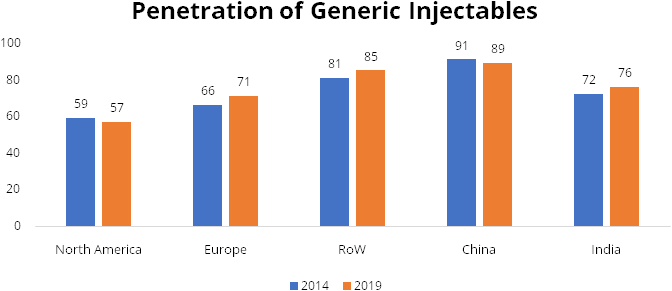
There is a shortage of injectables to the extent of over 40% in the US markets for reasons of consistency in quality of injectables and rise in demand. Gland is well prepared to take advantage of this opportunity through its enhanced capacities and impeccable track record on quality andUS Food and Drug Administration (USFDA) compliance.
Impeccable track record on compliance
Despite having a very high proportion of sales from complex generic injectables
from US, Gland has maintained an impeccable track record on compliance. The company
has not received any warnings or observations from the USFDA in the last 5 years.
It has 7 manufacturing facilities in India (4 formulations and 3 Active Pharmaceutical
Ingredients (API)).
Emphasis on R&D and quality
Gland spends about 3.5-4% of revenues on R&D in order to maintain high standards
of quality andcarve a niche in complex generics. The company has filed 265 ANDAs
with USFDA. Out of these, injectable products account for 189 (~70%), Oncology products
account for 50 (20%) and Ophthalmic products account for 26 (10%). The company files
ANDA directly and through its partners. Currently, out of 265 ANDAs, 100 are owned
products and 165 are filed through partners. The company has 61 ANDAs pending for
approvals out of which 37 are own and 24 through partners.
ANDA filings
| Total Filings | Approved | Pending | |
|---|---|---|---|
| 265 | 204 | 61 | |
| Own | 100 | 63 | 37 |
| Partners | 165 | 141 | 24 |
Chinese parent offers twin advantages of new market (China) and raw material source
Gland’s main promoter is Shanghai FosunPharma of China, which gives the company
access to the Chinese market. Gland filed its first product in China in 2019 and
has filed applications for 6 products in 2020. The company plans to file applications
for a few more products in 2021. The Chinese parent also provides Gland with bargaining
power and favourable scale to procure raw material andequipment from China.
Fosun is also a candidate for a vaccine for Covid-19. There is a possibility that Fosun may use Gland’s facility to produce vaccines or provide it with technology to cater to the Indian and/or other markets.
Niche products with limited competitors
According to the company’s IPO prospectus, about 40% of Gland’s key
molecules have only 5 competitors; another 40% have 4-10 players. Only 20% of the
company’s products have more than 10 competitors. With fewer players in this
space, the company faces a lower risk of price erosion.
Few competitors in Gland’s key API portfolio
Gland has almost no competition among Indian pharma companies in Drug Master Filings
(DMF) for most of its products. There are about 2 other DMF filers only in Enaxoparin
Sodium and Dexrazaxone besides Gland. Gland has filed a total of 42 DMF which gives
it the advantage of vertical integration.
Para IV opportunities to be the next growth driver
Encouraged by strong technical capabilities of its parentand strong financial muscle,
the company is now embarking on exploring opportunities in Para IV molecules. The
company is targeting 8 Para IV opportunities which should fructify in the next 2-3
years.
Financials
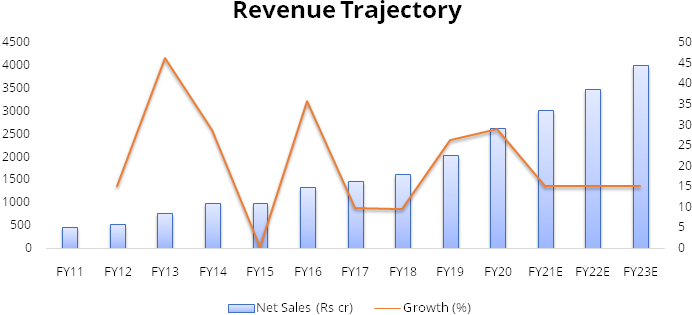
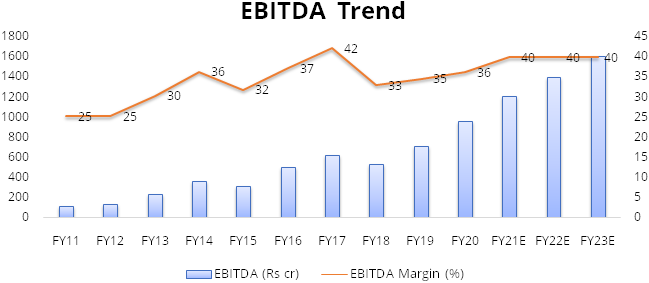
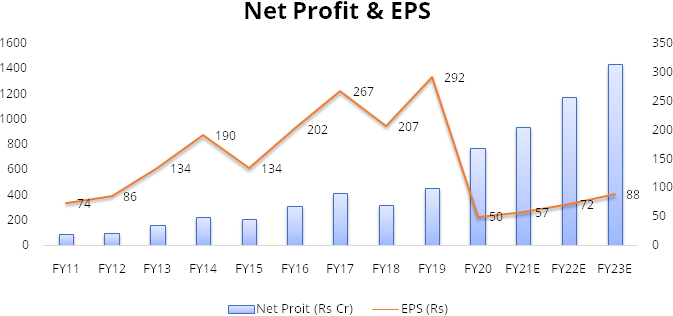
Gland has recorded strong financial performance over the last 3 years. The company has recorded high margins on the back of its cost leadership. The company recorded revenue growth of 21% over FY17-20 along with average EBITDA margin of 37% in this period.
U.S. is the key geography for Gland, accounting for 67% of total revenue of FY20, followed by India at 18%.
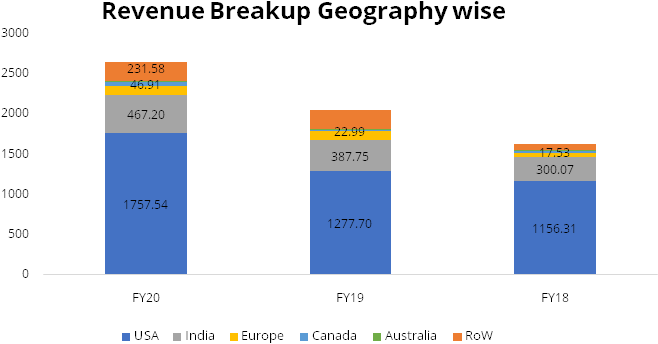
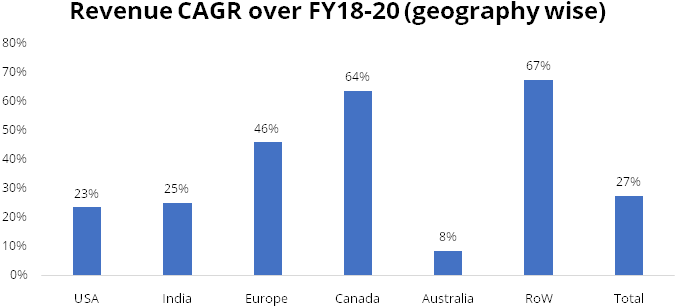
We expect revenue CAGR of 15% over FY20-23 led by increasing penetration in injectables in US, 6-8 new product launches by Gland every year andaccelerationin pace of approvals from USFDA.
We expect the company to maintain 40% average EBITDA margin over FY20-23as it faces limited competition due to stringent compliance requirementsand Gland’s cost leadership. Gland will also benefit from economies of scale. Currently, the company is running its facilities at ~60% utilization. As utilization picks up, overhead costs will decreaseandhelp in maintaining high margins of about 40%.
Assuming no significant deterioration in other expenses or Selling, general and administrative expense (SGA) we expect net profit to grow at CAGR of ~23% over FY20-23.
Risks & Concerns
Regulatory Risks
The company’s business is dependent on various permissions from USFDA and
other drug regulators. Any adverse action by these regulators can delay approvals
process and impact the business in a significant way. However, till date, Gland
has maintained an impeccable track record on regulatory requirements.
Key customer risk
The company gets almost 50% of its business from top 5 clients. Thus, client concentration
is quite high. However, this is due to B2B business model adopted by the company.
Foreign currency risk
Almost 80% of the top line is from exports mainly to US and Europe. Any adverse
movement in currency will have an impact on the company.
Chinese parentage
Gland’s main promoter is from China. Given the current geo-political situation,
negative sentiments against the company can easily build-up especially in times
of any pro-nationalism movement.
Outlook & valuation
Gland has recently listed on the Indian bourses at prices that are higher than expectations. At CMP of Rs 2,178, the stock is trading at 34x/29x FY22E/FY23E EPS. Investors question whether the company can continue trading at the steep P/E multiple. We strongly believe that Gland deserves a higher multiple than its peers mainly because of the following aspects:
- Its business model is unique. 96% of sales come from B2B which means the company has long term supply contracts that ensure predictable cash flows.
- No conflict of interest with customers: Gland does not have its own marketing setup or any brands. It only manufactures for its clients. Hence, there is no chance of conflict of interest with customers.
- In B2B models, usually clients enter into cost-sharing agreements over R&D expenses and litigations costs. This mitigates adverse impact of such lumpy expenses.
- In this model, working capital requirement is usually lower as inventory, payables and receivables are better managed.
So what is a fair PE multiple for Gland?
Prima facie Gland’s business appears to be comparable with Aurobindo and Divis
amongst Indian players, and Recipharm and Lonza amongst global players. However,
we wish to clarify that all these companies are not exactly comparable due to their
specific business models, but they come quite close to Gland.
Aurobindo (Auro) trades at 13-15x I year forward PE multiple. Auro has a much lower contribution from injectables and far lesser number of complex products as compared to Gland. Auro has a very wide portfolio with oral generics being a major contributor to its sales. Therefore, Auro’s margin profile is much weaker than Gland’s. Auro has debt while Gland has cash accumulation of more than Rs.1,600 crore on its books, which makes Gland financially stronger. Therefore, Auro deserves a much lower multiple.
Divis trades around 41x 1 year forward PE multiple. For Divis, API accounts for 51% of sales, 41% comes from custom synthesis and 8% comes from Nutraceuticals. Divis has very strong innovator connect whereas Gland has relationships with generic marketers which do not have strong pricing power as in case of Divis’s clients. In our opinion, due to inferior customer mix, we believe Gland should trade at discount to Divis.
Lonza trades 38x 1 year forward PER but Lonza has 47% sales contribution from Biologics while Gland has absolutely no presence in Biologics. Hence in our opinion Gland should get lower PER than Lonza.
Recipharm has almost similar business as Gland and trades at 20-22x I year forward PER multiple. However, Recipharm has much lower margins at 19-20% v/s 37-40% of Gland.
We believe Gland deserves premium PER multiple of ~30x I year forward as compared to median multiple of major companies comprising the Indian pharma sector (18x-23x) including Cadila, Cipla, SunPharma, Dr Reddy’s, Auro, etc. We expect Gland to trade at a multiple between that of Divis and median of the industry.
Financial Statement
Profit & Loss statement
| Yr End March (Rs Cr) | FY18 | FY19 | FY20 | FY21E | FY22E | FY23E |
|---|---|---|---|---|---|---|
| Net Sales | 1619.94 | 2044.20 | 2633.24 | 3028.23 | 3482.46 | 4004.83 |
| Growth % | 26.00% | 29.00% | 15.00% | 15.00% | 15.00% | |
| Expenditure | ||||||
| Material Cost | 660.75 | 857.02 | 1102.02 | 1226.43 | 1392.98 | 1601.93 |
| Employee Cost | 179.08 | 222.95 | 277.66 | 317.96 | 365.66 | 420.51 |
| Other Expenses | 245.00 | 257.92 | 298.09 | 272.54 | 330.83 | 380.46 |
| EBITDA | 535.11 | 706.31 | 955.47 | 1211.29 | 1392.98 | 1601.93 |
| Growth % | 0.32 | 0.35 | 0.27 | 0.15 | 0.15 | |
| EBITDA Margin | 0.33 | 0.35 | 0.36 | 0.40 | 0.40 | 0.40 |
| Depreciation & Amortization | 78.21 | 81.96 | 94.59 | 104.85 | 115.35 | 125.85 |
| EBIT | 456.90 | 624.35 | 860.88 | 1106.44 | 1277.64 | 1476.08 |
| EBIT Margin % | 0.28 | 0.31 | 0.33 | 0.37 | 0.37 | 0.37 |
| Other Income | 48.79 | 85.56 | 139.17 | 107.95 | 137.51 | 171.00 |
| Interest & Finance Charges | 4.13 | 3.56 | 7.18 | 7.00 | 7.00 | 7.00 |
| Profit Before Tax - Before Exceptional | 501.56 | 706.36 | 992.87 | 1207.40 | 1408.15 | 1640.08 |
| Profit Before Tax | 501.56 | 686.36 | 992.87 | 1207.40 | 1408.15 | 1640.08 |
| Tax Expense | 180.45 | 234.45 | 220.01 | 303.90 | 354.43 | 412.81 |
| Effective Tax rate | 0.36 | 0.33 | 0.22 | 0.25 | 0.25 | 0.25 |
| Exceptional Items | - | -20.00 | - | - | - | - |
| Net Profit | 321.11 | 451.91 | 772.86 | 903.50 | 1053.72 | 1227.27 |
| Growth % | 41.00% | 71.00% | 17.00% | 17.00% | 16.00% | |
| Net Profit Margin | 20.00% | 22.00% | 29.00% | 30.00% | 30.00% | 31.00% |
| Consolidated Net Profit | 321.11 | 451.91 | 772.86 | 903.50 | 1053.72 | 1227.27 |
| Growth % | 41.00% | 71.00% | 17.00% | 17.00% | 16.00% |
Balance Sheet
| Yr End March (Rs Cr) | FY18 | FY19 | FY20 | FY21E | FY22E | FY23E |
|---|---|---|---|---|---|---|
| Share Capital | 15.50 | 15.50 | 15.50 | 15.50 | 15.50 | 15.50 |
| Total Reserves | 2394.93 | 2846.62 | 3614.26 | 4454.51 | 5434.47 | 6575.83 |
| Shareholders' Funds | 2410.42 | 2862.11 | 3646.24 | 4486.49 | 5466.44 | 6607.81 |
| Minority Interest | - | - | - | - | - | - |
| Non Current Liabilities | ||||||
| Long Term Burrowing | 5.49 | 4.96 | 4.07 | 4.96 | 4.96 | 4.96 |
| Deferred Tax Assets / Liabilities | 95.75 | 107.63 | 74.05 | -1082.51 | -1082.51 | -1082.51 |
| Long Term Provisions | - | - | - | - | - | - |
| Current Liabilities | ||||||
| Short Term Borrowings | - | - | - | - | - | - |
| Trade Payables | 292.42 | 446.20 | 249.09 | 426.55 | 445.94 | 512.83 |
| Other Current Liabilities | 71.13 | 72.60 | 81.73 | 81.73 | 81.73 | 81.73 |
| Short Term Provisions | 15.01 | 13.89 | 28.20 | 28.20 | 28.20 | 28.20 |
| Total Equity & Liabilities | 2928.34 | 3522.58 | 4086.04 | 3948.08 | 4947.42 | 6155.68 |
| Assets | ||||||
| Net Block | 842.64 | 928.74 | 968.10 | 1013.25 | 1047.91 | 1072.06 |
| Non Current Investments | - | - | - | - | - | - |
| Long Term Loans & Advances | 33.89 | 111.89 | 81.52 | 81.52 | 81.52 | 81.52 |
| Current Assets | ||||||
| Currents Investments | - | - | - | - | - | - |
| Inventories | 512.83 | 911.88 | 756.28 | 697.99 | 802.69 | 923.09 |
| Sundry Debtors | 475.21 | 506.10 | 601.79 | 697.99 | 713.50 | 820.52 |
| Cash and Bank | 670.84 | 753.35 | 1325.19 | 1104.14 | 1948.62 | 2905.29 |
| Long Term Loans & Advances | 33.89 | 111.89 | 81.52 | 81.52 | 81.52 | 81.52 |
| Total Assets | 2928.34 | 3522.58 | 4086.04 | 3948.05 | 4947.40 | 6155.65 |
Cash Flow Statement
| Yr End March (Rs Cr) | FY18 | FY19 | FY20 | FY21E | FY22E | FY23E |
|---|---|---|---|---|---|---|
| Profit After Tax | 321.11 | 451.91 | 772.86 | 903.50 | 1053.72 | 1227.27 |
| Depreciation | 78.21 | 81.96 | 94.59 | 104.85 | 115.35 | 125.85 |
| Others | -105.11 | -77.79 | 57.25 | - | - | - |
| Changes in Working Capital | -193.43 | -353.95 | -79.94 | 139.54 | -100.82 | -160.54 |
| Cash Flow From Operations | 100.78 | 102.13 | 844.75 | 1147.88 | 1068.24 | 1192.58 |
| Purchase of Fixed Assets | -85.18 | -135.74 | -194.66 | -150.00 | -150.00 | -150.00 |
| Free Cash Flow | 15.60 | -33.62 | 650.09 | 997.88 | 918.24 | 1042.58 |
| Others | -105.11 | -77.79 | 57.25 | - | - | - |
| Cash Flow From Investments | -190.29 | -213.54 | -137.41 | -150.00 | -150.00 | -150.00 |
| Increase / (Decrease) in Loan Funds | -0.46 | -0.43 | -0.53 | - | - | - |
| Equity Dividend Paid | - | - | - | -63.24 | -73.76 | -85.91 |
| Others | -105.11 | -77.79 | 57.25 | - | - | - |
| Cash Flow From Financing | -105.57 | -78.22 | 56.72 | -63.24 | -73.76 | -85.91 |
| Net Change in Cash | -195.08 | -189.62 | 764.06 | 934.64 | 844.48 | 956.67 |
| Opening Cash & Cash Equivalents | 533.08 | 372.84 | 236.40 | 169.50 | 1104.14 | 1948.62 |
| Cash at the end of the year | 338.00 | 183.22 | 1000.46 | 1104.14 | 1948.62 | 2905.29 |
Key Ratios
| Yr End March | FY18 | FY19 | FY20 | FY21E | FY22E | FY23E |
|---|---|---|---|---|---|---|
| Basic EPS | 207.24 | 291.65 | 49.65 | 55.43 | 64.65 | 75.29 |
| Diluted EPS | 207.24 | 291.65 | 49.65 | 55.43 | 64.65 | 75.29 |
| DPS | 1.00 | 1.00 | 1.00 | 3.88 | 4.53 | 5.27 |
| Book value (Rs/share) | 1555.61 | 1847.12 | 234.25 | 275.24 | 335.36 | 405.39 |
| ROCE (%) Post Tax | 14.40% | 18.00% | 23.90% | 22.30% | 21.30% | 20.40% |
| ROE (%) | 13.30% | 15.80% | 21.20% | 20.10% | 19.30% | 20.30% |
| Inventory Days | 100.44 | 127.19 | 115.61 | 87.64 | 78.64 | 78.64 |
| Receivable Days | 100.61 | 87.61 | 76.78 | 78.33 | 73.97 | 69.91 |
| Payable Days | 54.27 | 65.94 | 48.19 | 40.72 | 45.72 | 43.69 |
| PE | - | - | - | 39.60 | 33.70 | 28.90 |
| P/BV | - | - | - | 1.34 | 1.10 | 0.91 |
| EV/EBITDA | - | - | - | 4.06 | 2.92 | 1.94 |
| Dividend Yield (%) | - | - | - | 0.01 | 0.01 | 0.01 |
| P/Sales | - | - | - | 11.72 | 10.19 | 8.86 |
| Net Debt/EBITDA (X) | -1.24 | -1.06 | -1.38 | -0.91 | -1.40 | -1.81 |