
Elecon Engineering Company Ltd
Engineering - Industrial Equipments
Elecon Engineering Company Ltd
Engineering - Industrial Equipments
Stock Info
Shareholding Pattern
Price performance
Indexed Stock Performance

Leading player in transmission products segment
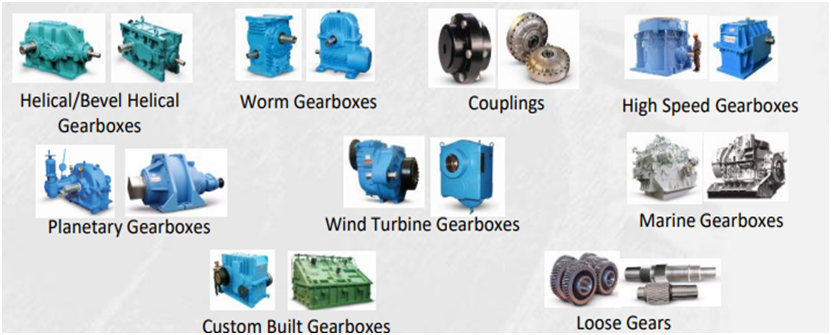
Elecon Engineering Co (EEC) is a Gujarat-based manufacturer of industrial gears and material handling equipment (MHE). The company operates under two divisions: power transmission (industrial gears) and material handling equipment (MHE). It offers helical and bevel helical, planetary, worm, high speed, wind turbine, marine, and custom-built gearboxes; customised gearboxes; vertical roller mill drives; and align geared, elflex flexible couplings, fluid, scoop controlled variable speed controlled fluid, and torsion shaft couplings.
Elecon’s key segments:
Power Transmission
Material Handling Equipment
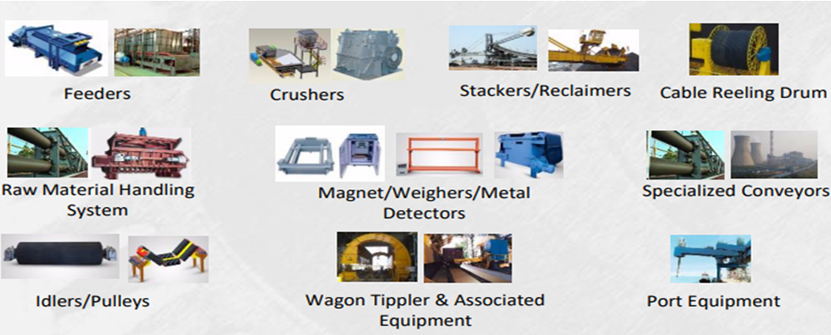
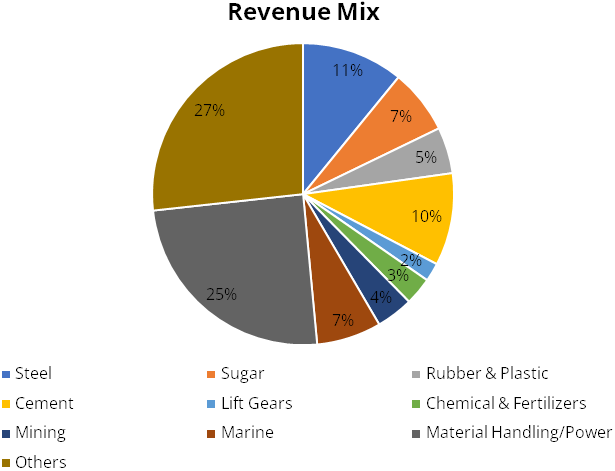
The company also provides material handling equipment, such as raw material handling systems, stackers, reclaimers, bagging and weighing machines, wagon and truck loaders, crushers, wagon tipplers, feeders, idlers and pulleys, magnates/weighers/detectors, port equipment, and cable reeling drums; and alternate energy products. In addition, it engages in the steel and non-ferrous foundry business. Furthermore, the company offers gearbox repair and refurbish services; and material handling equipment support services. It serves cement, sugar, steel, power, plastic, material handling, chemical, palm oil, crane, elevator, paper, rubber, marine, mining, and fertilizer industries, as well as ports.
Investment Rationale
Significant rejig in business model with clear focusing on industrial gears &
moving away from MHE:
Elecon struggled as demand slowed and liquidity issues arose. Simultaneously, it
acquired Radicon and Benzlers' overseas businesses in 2011, putting additional
strain on the group's resources. Elecon's attempt to reduce MHE's contribution
and expand industrial gears was disrupted by a temporary slowdown in demand. As
a result, it closed the majority of its legacy projects, recovered the retention
money, and paid the debt at the subsidiary level. The company's revenue mix
was significantly altered as a result of the change in strategy and prevalent business
conditions.
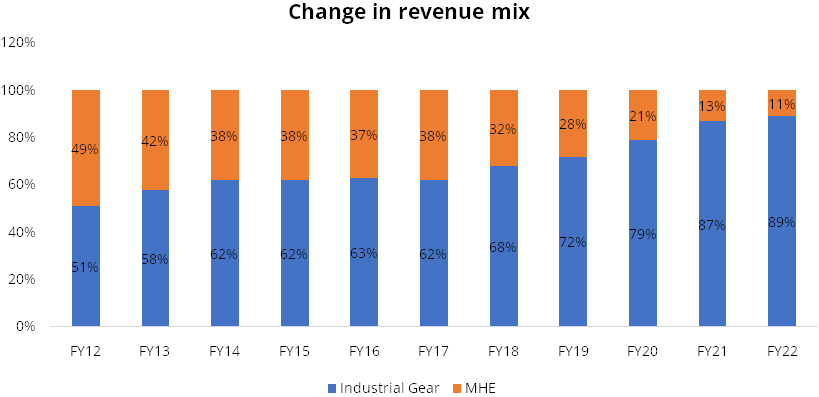
Elecon's revenue mix is heavily weighted toward power transmission (90% of sales). Because of the strategy change, the MHE division now accounts for only 10% of total sales, with no new projects in the MHE segment. Elecon will benefit from the high demand and has significant room to improve capacity utilisation (60-65% in the gear segment).
Leading player in transmission products segment:
EECL is a market leader in the transmission products segment, specifically gears,
with a 38% market share in India. In the past, the company had a strong presence
in the material handling equipment segment for both products and EPC (Engineering,
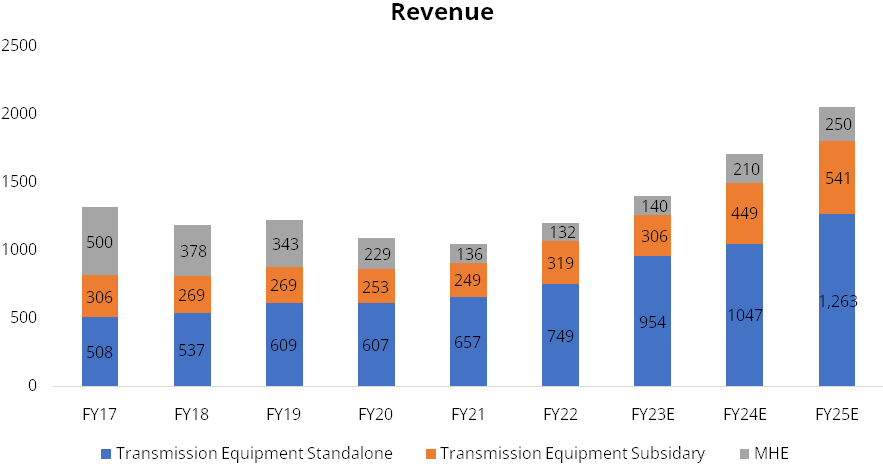
Procurement, and Construction) services, with a revenue contribution of 40% in FY2017.
However, in recent years, it has limited its exposure to the products and after-sales
segment, even as it completes some legacy EPC projects with an 11% revenue contribution
in FY2022.
The company benefits from strong design and engineering capabilities, technical collaborations as well as backward-integrated facilities with in-house foundry that has allowed it to enhance its product offerings over the years with increased complexity, reflected in its ability to bag orders for marine gears from the Indian Navy.
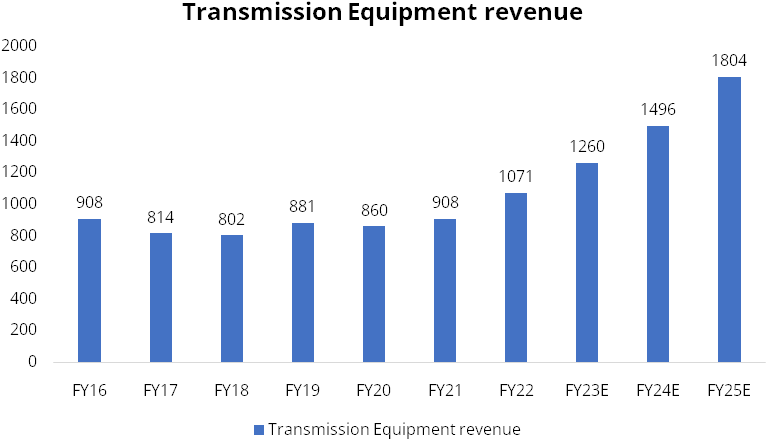
We expect Elecon’s transmission equipment revenue to increase at a CAGR of 19% over FY22–25E, with domestic sales recording a CAGR of 19% and international subsidiaries posting a CAGR of 20%.
Strong geographic presence across globe:
Over the years, the company has widened its product offerings and geographic presence
in transmission products through in-house development and acquisitions globally.
The company expects to increase the share of revenue from exports to 50% in the
long term (current exports account for 35%).
Additionally, company has developed a reasonable global footprint in recent years and its revenue mix is diversified across geographies with focus on increasing its presence in the US, South America and Europe from where revenue contribution is expected to increase going forward.
Strong order book provides revenue visibility:
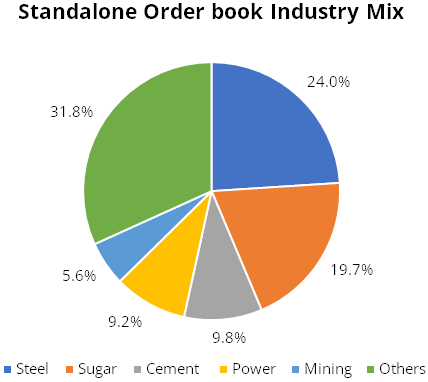
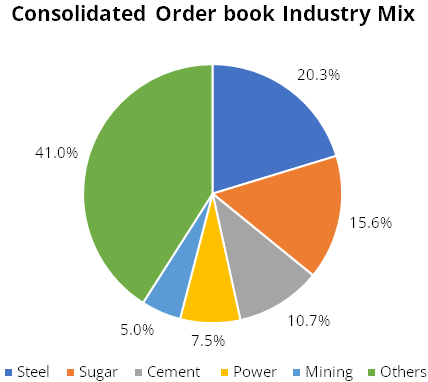
EECL had received a healthy order inflow of more than Rs. 800 crores in FY2022 in
the transmission segment with a standalone order book position of Rs. 410 crore
and a consolidated order book of Rs. 605 crores as on March 31, 2022. Moreover,
an order inflow guidance of Rs. 1,000 crores for FY2023 provides revenue visibility
over the near term. The product offerings encompass the standard/catalogue products
as well as engineered products in the gears division. Standard products, which account
for 55% of the gear sales, are available off the shelf and have a shorter execution
cycle. The execution cycle of engineered products varies between three months and
eight months. The order inflow is expected to remain strong in FY2023 with increased
demand from end-users such as steel, cement, sugar and power (flue gas desulphurisation
or FGD projects) sectors.
MHE on a recovery path under revised strategy:
The MHE segment has been under pressure for several years, with the power sector
slowing and subsequent delays in EPC projects causing liquidity issues. As the company
struggled to free up retention money, a significant portion of receivables got stuck.
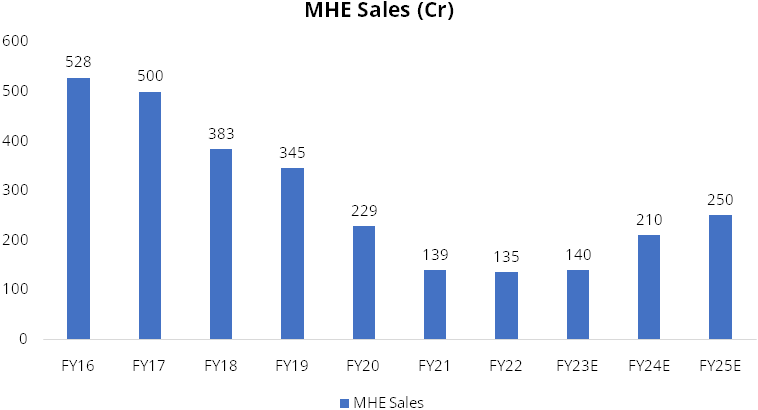
As a result, Elecon had to change its strategy for the MHE division and stop pursuing EPC orders. It is now solely focused on product-based orders and after-market sales. This resulted in a significant shift in the revenue mix of the company. Previously, MHE accounted for 40-50 % of Elecon's sales. This has now dropped to around 10-15%.
The order inflow in the MHE segment has remained modest at around Rs. 162.4 crore and order book position at Rs. 127.0 crore (March 2022) and is expected to remain around this level going forward.
Established and Reputed Customer Base:
The company’s customer base consists of reputed companies, namely, Garden
Reach Shipbuilders & Engineers Ltd, Mazagon Dock Shipbuilders Ltd, Larsen &
Toubro, NTPC Ltd, and Shree Cement. Over the years, the company has been able to
develop healthy business relations with its customers, leading to repeat orders.
Healthy Q1FY23 performance:
- Elecon has posted a decent set of numbers in Q1FY23 as order book remains healthy at INR617cr. PAT of INR43cr (+60% YoY). PAT growth appears strong due to the high interest component in the base quarter. Elecon has turned net debt-free before its target of FY23, and lower interest cost is supporting the bottom line. EBITDA came in at INR65cr (+11% YoY), EBITDA margin stood at 19.8%, as the MHE division bounced back sharply.
- On a consolidated basis, the Gear segment’s order book stands at INR515cr, excluding the recent INR140cr order from the Indian Navy. The new Navy order will be executed over two years and will have similar healthy margins as the one completed last quarter. Gear segment grew 12% YoY at standalone level, while subsidiary growth remained muted at -4% YoY. MHE segment bounced back strongly with 44% YoY growth in revenue, as it recorded 11% EBIT margin.
- The management has kept the guidance unchanged. It expects Elecon to record INR1,500cr sales at consolidated level in FY23E and reach the same INR1,500cr at standalone level by FY24E
Steady improvement in profitability and earnings with focus on manufacturing operations:
In the last five years, the company's revenues have remained in the range of
Rs. 1,100-1,200 crores. A favourable revenue mix with a higher share of the manufacturing
business (89% gears in FY2022 versus around 60% in FY2017), supplies of technically
complex products (naval gears), and a scaled-down EPC business under the MHE segment
have allowed for the release of long-standing dues and partial retention money,
which has improved the return metrics. Despite the increase in raw material prices,
provisions, and write-offs, the company's operating profit margin increased
to 21% in FY2022 from 11.6% in FY2019, while the core RoCE increased to 20.5% in
FY2022 (7.6% in FY2019).
Financials
Revenue to grow at a CAGR of 20% over FY22 25E, driven by industrial gears:
We expect Elecon’s consolidated revenue to increase at a CAGR of 20% over
FY22–25E, with standalone sales posting a CAGR of 19.5% and international
subsidiaries recording a CAGR of 19%.
EBITDA margin to remain healthy
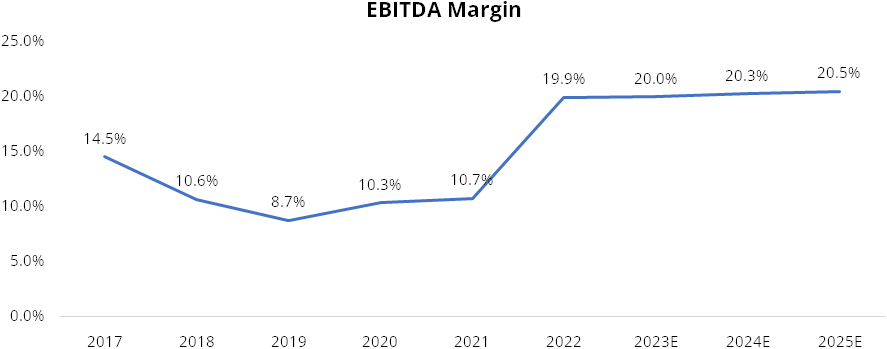
Elecon clocked EBITDA margin of 19.9% in FY22, The management remains confident
on margins & believes any pressure will be countered by strong sales-led operating
leverage. It continues to guide margins levels to be around the current level. However,
MHE’s margins will increase as it turns around and the latest order book with
better margins is executed. Overall, we expect margins to remain around 20.5%.
Significant reduction in interest costs to boost PAT further
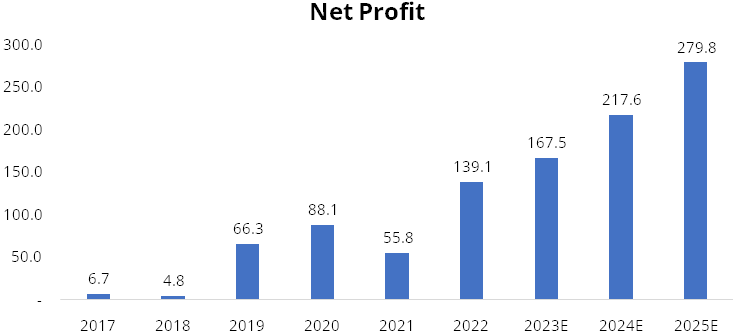
As the issues in the MHE segment were resolved, Elecon decreased its debt substantially.
Elecon has turned net debt-free before its target of FY23. The capex plan of INR50cr
for the next two years will be met through internal accruals. Therefore, Elecon
expects the remaining debt to be of working capital nature only. This will lead
to interest costs reducing from INR37cr in FY22 to INR12 cr in FY23E.
Due to the reduction in interest cost, we expect PAT to increase at a CAGR of 26.24% over FY22–25E.
Better utilisation to help improve return ratios
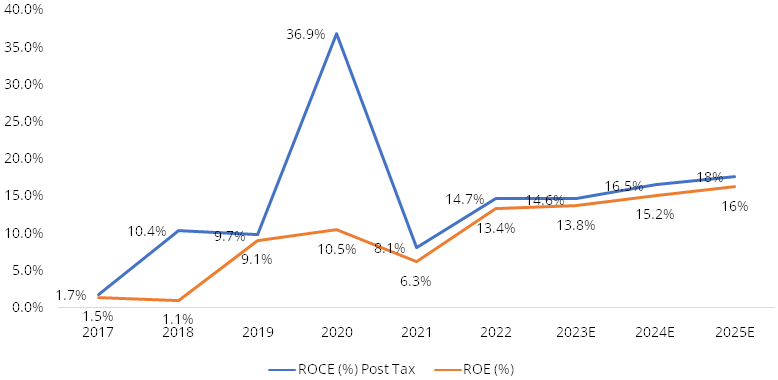
We expect Elecon’s ROCE to improve considerably from 15% currently to 18%
by FY25E. This will be majorly driven by higher asset turns and reduced leverage.
The management indicated they won’t be needing incremental capex for the future
growth. Thus, there is significant room for operating leverage as Elecon rides the
capex demand cycle.
Risks & Concerns
- The MHE division, which is dependent mainly on the thermal power sector to provide turnkey project services, has been making losses for the last five years ended FY22. Delays in project execution, lengthy working capital cycles, and headwinds in the thermal power sector have led the company to register losses continuously.
- Company’s revenues are exposed to the cyclicality in the domestic capex cycle and any economic slowdown could impact its revenues as witnessed in the past.
- The company’s margins are susceptible to the fluctuations in raw material prices due to a lag of two to three months in manufacturing lead time, especially for engineered products.
- Competition from other smaller players who bid at lower margins will have a negative impact on the company’s business growth.
- Both the main businesses of EECL benefit indirectly from improvement in infrastructure as well as capex in core sectors. Contraction in capex will have a negative impact on the business.
Outlook & valuation
EECL offers strong growth visibility with improving balance sheet. The impending improvement in the economic scenario and the resultant capex is expected to drive up demand for the MHE business. Considering the healthy order inflow of more than Rs. 800 crores in FY2022 provides strong revenue visibility in the coming years.
At CMP of Rs 315 the stock is trading at 12.8x FY25E EPS. We initiate Buy on Elecon Engineering Ltd with target price of Rs 444 Valuing the stock at 18x FY25E EPS.
Financial Statement
Profit & Loss statement
| Year End March (Rs. in Crores) | 2021 | 2022 | 2023E | 2024E | 2025E |
|---|---|---|---|---|---|
| Net Sales | 1044.40 | 1203.60 | 1400.00 | 1700.00 | 2050.00 |
| Expenditure | |||||
| Material Cost | 485.40 | 571.70 | 672.00 | 816.00 | 984.00 |
| Employee Cost | 117.90 | 128.20 | 142.80 | 173.40 | 205.00 |
| Other Expenses | 328.90 | 263.90 | 305.90 | 366.40 | 441.80 |
| EBITDA | 112.20 | 239.80 | 279.30 | 344.30 | 419.20 |
| EBITDA Margin | 10.70% | 19.90% | 20.00% | 20.30% | 20.50% |
| Depreciation & Amortization | 52.10 | 48.60 | 53.40 | 55.70 | 56.40 |
| EBIT | 60.10 | 191.20 | 225.90 | 288.50 | 362.90 |
| EBIT Margin % | 5.80% | 15.90% | 16.10% | 17.00% | 17.70% |
| Other Income | 79.60 | 16.00 | 10.00 | 12.50 | 15.00 |
| Interest & Finance Charges | 60.30 | 38.10 | 12.00 | 10.20 | 8.70 |
| Profit Before Tax - Before Exceptional | 79.40 | 169.10 | 223.90 | 290.80 | 369.20 |
| Profit Before Tax | 79.40 | 169.10 | 223.90 | 290.80 | 369.20 |
| Tax Expense | 23.70 | 30.00 | 56.40 | 73.20 | 92.90 |
| Effective Tax rate | 29.80% | 17.80% | 25.20% | 25.20% | 25.00% |
| Net Profit | 55.80 | 139.10 | 167.50 | 217.60 | 276.30 |
| Net Profit Margin | 5.30% | 11.60% | 12.00% | 12.80% | 13.50% |
Balance Sheet
| As of March (Rs. in Crores) | 2021 | 2022 | 2023E | 2024E | 2025E |
|---|---|---|---|---|---|
| Share Capital | 22.40 | 22.40 | 22.40 | 22.40 | 22.40 |
| Total Reserves | 896.80 | 1027.80 | 1195.30 | 1413.00 | 1689.20 |
| Shareholders' Funds | 919.20 | 1050.20 | 1217.80 | 1435.40 | 1711.70 |
| Non Current Liabilities | |||||
| Long Term Burrowing | 117.40 | 19.70 | 9.70 | 0.00 | 0.00 |
| Deferred Tax Assets / Liabilities | 25.20 | 23.90 | 23.90 | 23.90 | 23.90 |
| Long Term Provisions | 54.70 | 48.90 | 48.90 | 48.90 | 48.90 |
| Current Liabilities | |||||
| Short Term Borrowings | 130.20 | 80.40 | 40.40 | - | - |
| Trade Payables | 424.30 | 270.40 | 321.00 | 339.70 | 411.00 |
| Other Current Liabilities | 241.40 | 145.00 | 145.00 | 145.00 | 145.00 |
| Short Term Provisions | 42.90 | 43.80 | 43.80 | 43.80 | 43.80 |
| Total Equity & Liabilities | 1987.70 | 1714.60 | 1882.80 | 2069.10 | 2416.60 |
| Assets | |||||
| Net Block | 732.40 | 713.80 | 685.40 | 654.70 | 623.30 |
| Non Current Investments | 78.90 | 79.60 | 79.60 | 79.60 | 79.60 |
| Long Term Loans & Advances | 22.60 | 23.60 | 23.60 | 23.60 | 23.60 |
| Current Assets | |||||
| Currents Investments | - | - | - | - | - |
| Inventories | 250.20 | 261.70 | 260.40 | 288.80 | 344.20 |
| Sundry Debtors | 507.70 | 415.10 | 445.80 | 467.10 | 513.70 |
| Cash and Bank | 141.50 | 112.10 | 279.30 | 446.60 | 723.50 |
| Short Term Loans and Advances | 214.40 | 79.20 | 79.20 | 79.20 | 79.20 |
| Total Assets | 1987.70 | 1714.60 | 1882.80 | 2069.10 | 2416.60 |
Cash Flow Statement
| Year End March (Rs. in Crores) | 2021 | 2022 | 2023E | 2024E | 2025E |
|---|---|---|---|---|---|
| Profit After Tax | 55.80 | 139.10 | 167.50 | 217.60 | 276.30 |
| Depreciation | 52.10 | 48.60 | 53.40 | 55.70 | 56.40 |
| Changes in Working Capital | 18.20 | -22.50 | 21.20 | -31.00 | -30.80 |
| Cash From Operating Activities | 248.00 | 250.00 | 242.10 | 242.40 | 301.90 |
| Purchase of Fixed Assets | -4.00 | -48.60 | -25.00 | -25.00 | -25.00 |
| Free Cash Flows | 244.10 | 201.50 | 217.10 | 217.40 | 276.90 |
| Cash Flow from Investing Activities | -18.70 | -11.80 | -25.00 | -25.00 | -25.00 |
| Increase / (Decrease) in Loan Funds | -138.40 | -180.10 | -50.00 | -50.00 | - |
| Cash from Financing Activities | -210.50 | -250.00 | -50.00 | -50.00 | - |
| Net Cash Inflow / Outflow | 18.90 | -11.80 | 167.10 | 167.40 | 276.90 |
| Opening Cash & Cash Equivalents | 77.30 | 96.10 | 84.40 | 251.50 | 418.90 |
| Closing Cash & Cash Equivalent | 96.10 | 84.40 | 251.50 | 418.90 | 695.70 |
Key Ratios
| Year End March | 2021 | 2022 | 2023E | 2024E | 2025E |
|---|---|---|---|---|---|
| Basic EPS | 5.10 | 12.50 | 14.90 | 19.40 | 24.60 |
| Diluted EPS | 5.10 | 12.50 | 14.90 | 19.40 | 24.60 |
| Book value (Rs/share) | 81.90 | 93.60 | 108.50 | 127.90 | 152.60 |
| ROCE (%) Post Tax | 8.10% | 14.70% | 14.60% | 16.70% | 18.00% |
| ROE (%) | 6.30% | 13.40% | 13.80% | 15.20% | 16.00% |
| Inventory Days | 97.30 | 77.60 | 73.00 | 68.00 | 67.00 |
| Receivable Days | 195.70 | 139.90 | 125.00 | 110.00 | 100.00 |
| Payable Days | 164.90 | 105.30 | 90.00 | 80.00 | 80.00 |
| PE | 12.40 | 11.50 | 21.10 | 16.20 | 18.00 |
| P/BV | 0.80 | 1.50 | 2.90 | 2.50 | 2.90 |
| EV/EBITDA | 7.60 | 6.70 | 11.90 | 9.10 | 10.20 |
| Dividend Yield (%) | 0.00% | 0.00% | 0.00% | 0.00% | 0.00% |
| P/Sales | 0.70 | 1.30 | 2.50 | 2.10 | 2.40 |
| Net debt/Equity | 0.20 | - | - | - | - |
| Net Debt/ EBITDA | 1.30 | -0.10 | -0.70 | -1.20 | -1.70 |
| Sales/Net FA (x) | 1.40 | 1.70 | 2.00 | 2.50 | 3.20 |