
Coforge Ltd
IT - Software Services
Coforge Ltd
IT - Software Services
Stock Info
Shareholding Pattern
Price performance
Indexed Stock Performance
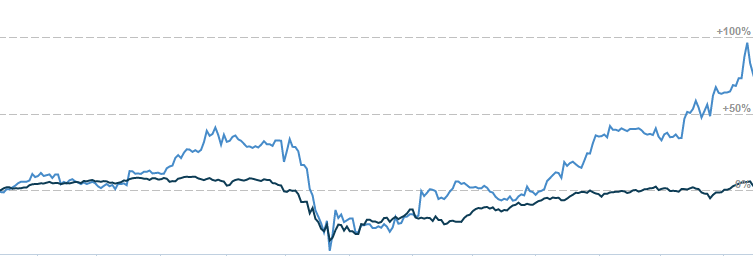
Large deal wins with strong execution capabilities
Company Profile
Coforge Ltd is a leading global IT solutions and services organization engaged in
Application development and maintenance, managed services, business process outsourcing
and cloud computing to various organizations around the world. The company has a
distinct advantage due to concentrated focus on select industries, a detailed understanding
of the underlying processes of those industries and partnerships with leading platforms.
The company delivers services around the world directly and through its network
of subsidiaries and overseas branches. The company was formerly known as NIIT Technologies
Ltd. and was incorporated in April 2003 when NIIT Ltd (NIIT) spun off its software
solutions business (excluding knowledge solutions) into a separate legal entity.
In May 2019, NIIT and its founder's family members sold their stakes totaling
30.2% in Coforge to Hulst B.V (Hulst; affiliate of Baring Private Equity Asia).
In August 2019, Hulst also made an open offer and acquired 39.85% stake from the
public, increasing its total stake in Coforge to 70.05% in September 2019.
Investment Rationale
Healthy order book aided by large deal wins
The company has healthy executable orders of $465 million over the next 12 months
which is 18% higher than last year. Further, in pandemic-infused Q1FY21 the company
secured fresh business of $186 million on the back of the three material deals,
whereby the first deal was in the BFS vertical whereas the other two deals were
in the Travel verticals. Furthermore, beyond the three deals the company has also
signed two other material deals in July 2020 that sets roadmap for next stage of
robust growth.
Investing in new platforms and technologies to provide impetus to growth
The company continues to strengthen its offerings portfolio in Digital engineering,
Cloud, Machine Learning and Artificial intelligence. During FY20 the company made
a strategic investment in WHISHWORKS IT consulting, a Mulesoft and Big Data specialist,
thus augmenting its powerful offerings combination in the Digital integration and
process automation space.
Balanced revenue profile across segments
The company has broad based revenue profile with focus on application development
and maintenance services in BFSI (46% of turnover in FY20), travel, transport and
logistics (28%), manufacturing, media and others (26%). Further, the company has
a geographically diverse revenue profile, which enables them to shield against downturn
in any single region.
Outlook & Valuation
We expect the company to deliver robust growth supported by strong order book visibility,
continued momentum in large deal wins and long standing client relationship. The
company’s leadership team has proved its mettle by strong order execution
capabilities and new customer acquisition. At CMP, the stock trades at PE of 23.4/19.8x
our FY22/23E estimates and we initiate coverage on the stock with a Buy recommendation.
Consolidated Financial Statements
| Rs in Crores | Revenue | EBITDA | EBITDA% | PAT | EPS | ROE% | PER | EV/EBITDA |
|---|---|---|---|---|---|---|---|---|
| FY18 | 2991.00 | 501.00 | 16.80% | 309.00 | 45.60 | 17.60% | 19.00 | 9.20 |
| FY19 | 3676.00 | 649.00 | 17.60% | 422.00 | 65.30 | 21.80% | 20.30 | 11.30 |
| FY20 | 4184.00 | 723.00 | 17.30% | 468.00 | 71.00 | 20.90% | 16.90 | 9.20 |
| FY21E | 4696.00 | 808.00 | 17.20% | 479.00 | 76.30 | 18.80% | 29.50 | 15.90 |
| FY22E | 5461.00 | 956.00 | 17.50% | 604.00 | 96.30 | 20.90% | 23.40 | 13.00 |
| FY23E | 6308.00 | 1117.00 | 17.70% | 713.00 | 113.70 | 21.50% | 19.80 | 10.80 |
Investment Rationale
Healthy order book aided by large deal wins
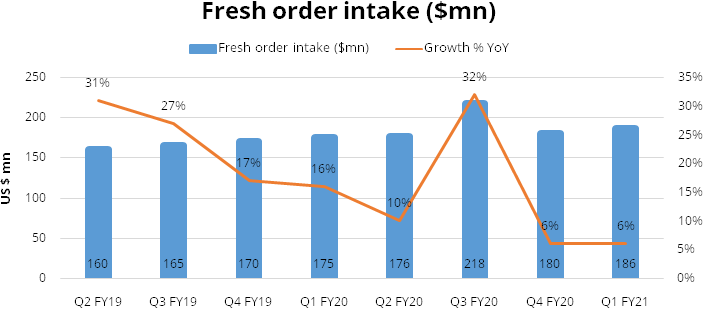
During FY20, the company was engaged in multiple new engagements and large deal
closures and they secured fresh orders worth $748 million (compared to $646 million
during FY2019) a 20% increase in order book. Further, in pandemic-infused Q1FY21
the company secured fresh business of $186 million on the back of the three material
deals. The first deal was in the Banking & Finance vertical where they signed
a $30 million plus multi- year deal specifically catering to infrastructure and
testing based services. Whereas the other two deals were in the Travel verticals,
the first of these two was $15 million deal to be executed over 18-months in the
travel tech space. And the other deal was a part of a vendor consolidation exercise
at a large airport which was focussed more around Cloud and Infrastructure.
Furthermore, beyond the three deals the company has also signed two other significant deals in July 2020 (one of which is a $30 million deal). The company has healthy executable orders of $465 million over the next 12 months (18% higher than last year) that sets the roadmap for next stage of robust growth.
Investing in new platforms and technologies to provide impetus to growth
The company continues to bolster its offerings portfolio in Digital engineering,
Cloud, Machine Learning, Artificial intelligence and block chain. During FY20 the
company made a strategic investment in WHISHWORKS IT consulting, a Mulesoft and
Big Data specialist, thus augmenting its powerful offerings combination in the Digital
integration and Digital process automation space. The company has major focus on
honing its cloud capabilities, even though it has very small base, cloud revenues
have shown robust growth in recent years. We expect the company to maintain this
momentum going forward supported by strong partner ecosystem of Salesforce, AWS
Cloud platform. The company’s investment in two subsidiaries: Incessant and
RuleTek turned out to be game changers as they possess both execution capabilities
and architecture consulting.
The company has focussed initiatives around automation, artificial intelligence, integration and data science, thus the team has been leveraging Artificial intelligence in multiple client engagements enabling business value to its clients. The company is a Pega Platinum partner and has the world’s largest number of Pega certified consultants, who provide Case Management, CRM, RPA and Decision-based solutions.
Scaling up Healthcare & Hi-tech verticals to provide next levers of growth
The company is tuning themselves to ramp up its healthcare and Hi-tech segments.
On the healthcare front, the company saw substantial traction within a material
healthcare client in Q4FY20, which led to ramping up the business to 100 employees
within the quarter itself. The business traction within that client relationship
continues to be very robust and we expect further ramp ups in that client relationship
in the subsequent quarters. Provided that Hi-Tech and Healthcare being their new
growth drivers, the company recently hired new sales heads based in the markets
under a new overall global sales leader. Within Healthcare, the company will focus
on the provider segment and aim to lead with its Pega capabilities.
Lowest client concentration amongst peers
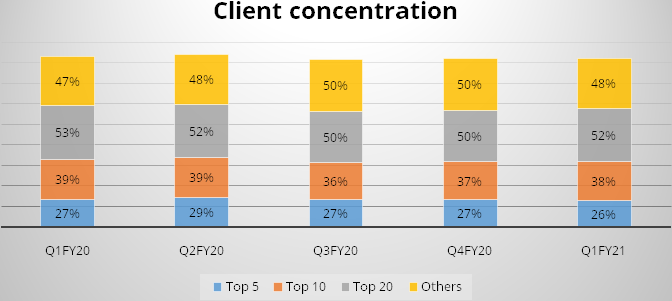
The company’s client mix is balanced with top 5 clients constituting 26%,
top 10 clients constituting 38%, top 20 clients constituting 52% whereas others
constituting 48% as of Q1FY21. The company’s strong performance in the recent
past has been on back of head hunting new clients and swiftly increasing its client
base. Going forward, we expect the company to increase its focus on mining a select
group of accounts and also future client acquisition strategies will be more concentrated
towards identifying accounts with significant potential to scale up. Further we
believe there is tremendous scope for the company to drive growth among these strategic
accounts.
| Client Size | Q1FY20 | Q2FY20 | Q3FY20 | Q4FY20 | Q1FY21 |
|---|---|---|---|---|---|
| Between 1mn- 5mn | 66 | 70 | 74 | 80 | 81 |
| 5mn-10 mn | 17 | 16 | 17 | 15 | 15 |
| Above 10 mn | 8 | 9 | 9 | 11 | 11 |
| Total | 91 | 95 | 100 | 106 | 107 |
Balanced revenue profile across segments
The company has broad based revenue profile with focus on application development
and maintenance services in Insurance (30% of turnover in FY20), Banking & financial
services (16% of turnover in FY20), Travel & transport (28% of turnover in FY20)
and Manufacturing, media and others (26% of turnover in FY20). Further, the company
has a geographically diverse revenue profile, which enables them to shield against
downturn in any single region.
Insurance vertical major growth driver
Insurance is largest vertical (30% of revenue) and it caters to clients across all
the three sub-segments of insurance: a) Life and annuities b) Specialty Insurance
and c) Property & Casualty. The company differentiates itself through insurance
domain skills, industry knowledge and customer centricity. The Life & Annuities
segment is witnessing traction and has seen increased investments in digital engagement
platforms for sales especially for agents and brokers. Further there is also need
to improve underwriting capabilities, which is driving investments in analytics
and data.
The company has accelerated adoption of digital within the Property & Casualty space majorly supported by i) customer interaction through digital channels, ii) need to reduce operational expenses, and iii) rise in data consumption from third-party non-insurance entities. The company is a platinum partner for Duck Creek and has been in the top three integration partners for them. They have long lasting relationships of over 10 years with many of its clients.
Further the company has stronghold in the Specialty insurance segment and has reported robust growth in their “Advantage Go” platform. The insurance technology platform of Advantage Go has almost doubled over last four years and they will continue to strongly invest in this business as it is highly differentiated, high value and high profit asset. Advantage Go has been named as one of the “Hot 100 Insure tech platforms” by Intelligent Insurer magazine. The ability to lead client conversations by referencing this platform underlines the company’s deep domain knowledge.
Banking & Financial service business: A stronghold in Asset Management space
The company’s BFS business constitutes 16% of the FY20 revenue and has a superior
mix of financial services clients (~60% of revenue) as compared to banks. The company
has a healthy portfolio of strategic clients in both investment management and retail
banking business and marquee financial institutions in the public sector. The company
is concentrating majorly on the capital markets as well as asset and wealth management
space, where it has the proficiency, experience and client references to wrestle
with larger peers. The company is growing and strengthening existing business, including
expanding their footprint to achieve larger wallet share. The company’s forte
lies in combining digital integration space with back-office & middle-office
automation.
The company is focusing on large deals, thereby capitalizing on their competitive strengths. They have a healthy large deal pipeline and we expect the company to become more aggressive in acquiring large tier-1 banking accounts. In Q1 FY21, the company signed a $30 million plus multi- year deal, specifically catering to infrastructure and testing based services. The deal was won by a combination of company’s domain knowledge as well as significant intervention from the business leadership team.
The company’s leadership team has rich experience in BFS vertical which will help fortifying client relationships within related accounts. Further BFS vertical is a highly competitive space, but we believe that company has sufficient headroom to build wallet-share within new accounts.
Travel Transportation & Hospitality
The TTH segment is divided into six sub-segments: i) Airlines ii) Airports iii)
Hospitality iv) Travel distribution v) Travel technology and vi) Surface transport.
This vertical grew in past years supported by smart application of agile methods,
digital customer experience and reduction of product lifecycles. The Covid-19 pandemic
proved to be a dampener for the airlines segment and has caused severe stress over
the past two quarters. The company expects stable revenues in travel vertical led
by wallet share expansion amongst existing large clients. The company has announced
two deal-wins in Q1FY21. The first of these two was $15 million deal to be executed
over 18-months in the travel tech space. And the other deal was a part of a vendor
consolidation exercise at a large airport and had a very big component of rebadge
which was focussed more around Cloud and Infrastructure.
Rejig in top level management brought in breath of fresh air
The company underwent a change in senior management in June 2017, with the induction
of Sudhir Singh as CEO designate and then as CEO. This was succeeded by a significant
revamp in the senior leadership and all of the new hires came from a background
of tier-1 organization. Management overhaul enabled the company to change its rewards
and recognition philosophy by focusing on nurturing a culture that encourages value
creation and promotes innovation. Further the philosophy became largely focussed
on large deal wins and remarkable execution of deal wins.
Sales incentives scheme revamped to promote large deal wins
The company offers its employees a competitive compensation as well as opportunity
to work on new technologies & projects. The company considers TCV of $20 million
as large deal and to encourage the employees to focus on large deals, it increased
the incentive and bonus that came for signing a large deal, by a factor of 4x. Secondly
the pay-out period of this reward was reduced. The company also started recreating
the management team by hiring people, preferably only from Tier 1 firms and at relatively
high compensation structures into the team.
Financials
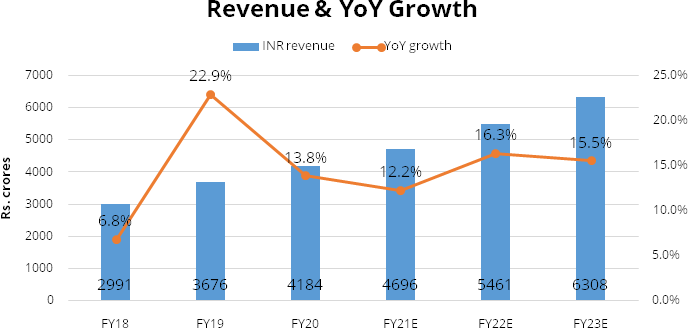
Revenue is expected to grow @~ 14.7% CAGR over FY20-FY23E We expect Coforge’s consolidated revenue to grow at ~14.7% CAGR over FY20-FY23E to Rs 6308 crores majorly supported by i) strong execution capabilities of large deal wins ii) robust order book visibility iii) uptick in growth in top-20 accounts. Further, management guided for FY21 revenue growth to be at least 6%, in constant currency terms and we believe healthy executable order book of $465 million over the next 12 months and TTM book-to-bill of 1.3x provides confidence on revenue trajectory. The company has grown its revenues by 14% CAGR during FY17-FY20 on the back of new order wins.
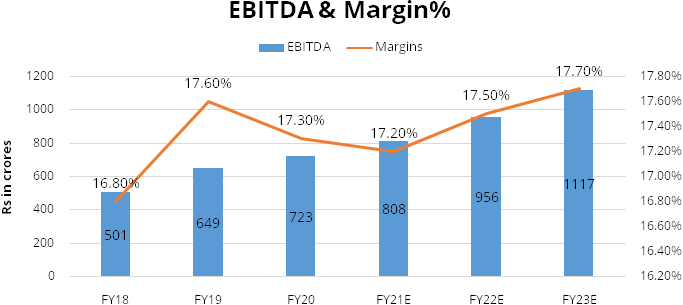
EBIT is expected to grow @~ 17% CAGR over FY20-FY23E
We expect EBIT to grow at ~17% CAGR over FY20-FY23E to Rs 888 crores and EBIT margins
to expand by 93 bps to 14.08% over FY20-FY23E aided by increasing mix of digital
revenue and healthy revenue growth. The company’s EBIT grew by 16% CAGR during
FY17-FY20 whereas EBIT margins expanded by 58 bps during FY17-FY20. Further management
guided for EBITDA margins pre RSU costs to be in range of 17.8% for the full year
FY21 (in line with FY20 margins).
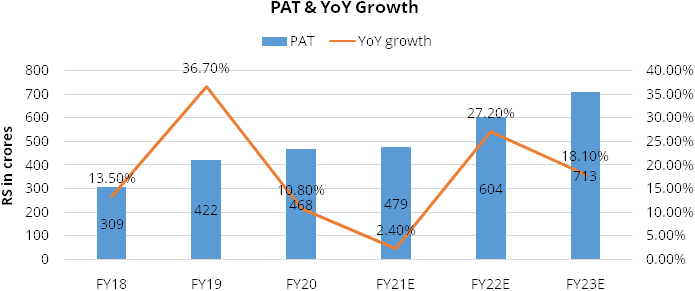
Net Profit is expected to grow @~ 15% CAGR over FY20-FY23E
We expect Net profit to grow at ~15% CAGR over FY20-FY23E to Rs 713 crores and PAT
margins to be stable at 11.30% in FY23E. Further we expect PAT to grow in lower
single digit in FY21E due to lower other income caused by difference in exchange
rates and decision making delays at client’s end.
Industry
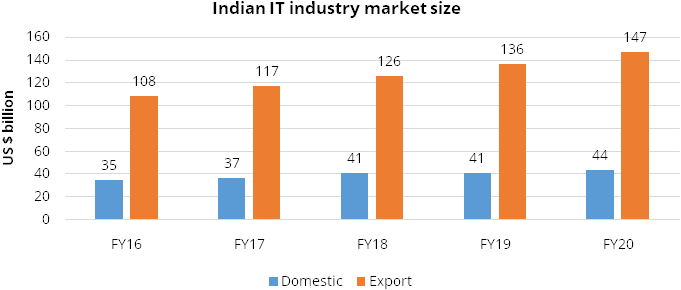
During FY2020, the industry body NASSCOM estimates that Indian IT services grew by 6.7% and approached the $100 billion mark. Among other segments, BPM is estimated to have grown by 8%, IT services, BPM, ER&D and products together generated $175 billion in revenues for the industry. This growth has been realized amidst some weakness in several major economies, which is likely to be further exacerbated on account of COVID-19 led factors. The Indian IT industry’s growth has been driven by significant digital disruption, hyper-personalization, core modernization, automation and other emerging technologies. NASSCOM expects this trend to sustain over the next several years as technology continues to play a critical role in facilitating multiple megatrends likely to be witnessed globally. While the COVID-19 pandemic has created some medium-term challenges for the industry, the long-term outlook for the Indian IT sector remains positive. Within the industry, firms that possess deep domain expertise in specific industry verticals and have managed to transform themselves through substantial investments in developing strong capabilities in emerging technologies are likely to be better positioned to benefit from the opportunities generated by shifts in technology trends and customer behaviour.
The global sourcing market in India continues to grow at a higher pace compared to the IT-BPM industry. India is the leading sourcing destination across the world, accounting for approximately 55% market share of the US$ 200–250 billion global services sourcing business in 2019–20. Indian IT & BPM companies have set up over 1,000 global delivery centres in about 80 countries across the world. India has become the digital capabilities hub of the world with around 75% of global digital talent present in the country.
Indian IT's core competencies and strengths have attracted significant investment from major countries. The computer software and hardware sector in India attracted cumulative Foreign Direct Investment (FDI) inflow worth US$ 44.91 billion between April 2000 and March 2020 (Source: ibef.org). The sector ranked second in FDI inflow as per the data released by Department for Promotion of Industry and Internal Trade (DPIIT).
Leading Indian IT firms are diversifying their offerings and showcasing leading ideas in block chain and artificial intelligence to clients using innovation hubs and research and development centres to create differentiated offerings.
India is the topmost offshoring destination for IT companies across the world. Having proven its capabilities in delivering both on-shore and off-shore services to global clients, emerging technologies now offer an entire new gamut of opportunities for top IT firms in India. The industry is expected to grow to US$ 350 billion by 2025 and BPM is expected to account for US$ 50 55 billion of the total revenue.
In comparison with peers, Coforge has a competitive advantage in digital integration and process automation which act as the mainstay of the company’s digital strategy whereas majority of midcap IT peers tend to have higher focus on cloud migration & customer experience. The company has the lowest client concentration among mid-cap peers enabling its portfolio to be balanced and less risky. Further the company has the highest onsite revenue mix compared with peers which signals high digital mix. Further its geography wise revenue mix is balanced vis-à-vis its midcap IT peers, wherein contribution of the North America to overall revenue hovers around 48%, which is lower versus peers where the region typically contributes over ~60%. Lastly the company has traded at ~19% premium to mid-cap peers over the past two years led by consistent growth.
Risks & Concerns
Overhang of delayed resurgence in the TTH vertical
The most affected sub-segment in this vertical is Airlines and any further delay
in recovery will impact the growth. However, the company has focused on deal wins
within other sub-segments.
Inorganic growth expansion risks
The company has chosen inorganic routes to grow exponentially in future years thus
it may be exposed to practical challenges in integration which may lead to dilution
of returns for the company.
Foreign currency exposure
Foreign currency forwards and options contracts are entered into to mitigate the
risk of changes in exchange rates on foreign currency exposures.
Outlook & valuation
We expect the company to deliver robust growth supported by strong order book visibility, continued momentum in large deal wins and long standing client relationship. The company’s leadership team has proved its mettle by strong order execution capabilities and new customer acquisition. At CMP the stock trades at PE of 23.4/19.8x our FY22/23E estimates and we initiate coverage on the stock with a Buy recommendation.
Financial Statement
Profit & Loss statement
| Year End March | FY18 | FY19 | FY20 | FY21E | FY22E | FY23E |
|---|---|---|---|---|---|---|
| Net Sales | 2991.00 | 3676.00 | 4184.00 | 4696.00 | 5461.00 | 6308.00 |
| % Growth | 6.80% | 22.90% | 13.80% | 12.20% | 16.30% | 15.50% |
| Material Cost | 32.00 | 29.00 | 84.00 | 94.00 | 109.00 | 126.00 |
| Employee Cost | 1760.00 | 2153.00 | 2530.00 | 2841.00 | 3288.00 | 3785.00 |
| Other Expenses | 698.00 | 845.00 | 846.00 | 953.00 | 1109.00 | 1281.00 |
| EBITDA | 501.00 | 649.00 | 723.00 | 808.00 | 956.00 | 1117.00 |
| Growth (%) | 4.50% | 29.40% | 11.50% | 11.70% | 18.30% | 16.80% |
| EBITDA Margin | 16.80% | 17.60% | 17.30% | 17.20% | 17.50% | 17.70% |
| Depreciation & Amortization | 127.00 | 125.00 | 173.00 | 189.00 | 198.00 | 229.00 |
| EBIT | 374.00 | 524.00 | 550.00 | 619.00 | 758.00 | 888.00 |
| Other Income | 39.00 | 54.00 | 68.00 | 23.00 | 29.00 | 41.00 |
| Interest & Finance Charges | 9.00 | 9.00 | 16.00 | 16.00 | 0.00 | 0.00 |
| Profit Before Tax - Before Exceptional | 404.00 | 568.00 | 603.00 | 626.00 | 787.00 | 929.00 |
| Exceptional Items | 0.00 | -6.00 | -7.00 | 0.00 | 0.00 | 0.00 |
| Profit Before Tax | 404.00 | 562.00 | 595.00 | 626.00 | 787.00 | 929.00 |
| Tax Expense | 95.00 | 140.00 | 128.00 | 147.00 | 183.00 | 215.00 |
| Effective Tax rate | 23.50% | 24.70% | 21.20% | 23.50% | 23.20% | 23.20% |
| Net Profit | 309.00 | 422.00 | 468.00 | 479.00 | 604.00 | 713.00 |
| Net Profit Margin | 10.30% | 11.50% | 11.20% | 10.20% | 11.10% | 11.30% |
| Growth | 13.50% | 36.70% | 10.80% | 2.40% | 27.20% | 18.10% |
| EPS | 45.60 | 65.30 | 71.00 | 76.30 | 96.30 | 113.70 |
Balance Sheet
| Year End March | FY18 | FY19 | FY20 | FY21E | FY22E | FY23E |
|---|---|---|---|---|---|---|
| Share Capital | 62.00 | 62.00 | 63.00 | 63.00 | 63.00 | 63.00 |
| Total Reserves | 1716.00 | 2000.00 | 2326.00 | 2630.00 | 3015.00 | 3472.00 |
| Share Warrants | 19.00 | 18.00 | 8.00 | 8.00 | 8.00 | 8.00 |
| Net Worth | 1796.00 | 2080.00 | 2397.00 | 2701.00 | 3086.00 | 3542.00 |
| Non-current Liabilities | ||||||
| Long Term Burrowing | 18.00 | 10.00 | 5.00 | 0.00 | 0.00 | 0.00 |
| Deferred Tax Liabilities | -78.00 | -64.00 | -91.00 | -91.00 | -91.00 | -91.00 |
| Other Long Term Liabilities | 151.00 | 55.00 | 145.00 | 145.00 | 145.00 | 145.00 |
| Long Term Provisions | 74.00 | 73.00 | 59.00 | 59.00 | 59.00 | 59.00 |
| Current Liabilities | ||||||
| Trade Payables | 145.00 | 165.00 | 263.00 | 219.00 | 223.00 | 258.00 |
| Other Current Liabilities | 369.00 | 419.00 | 498.00 | 468.00 | 468.00 | 468.00 |
| Short Term Provisions | 596.00 | 621.00 | 764.00 | 764.00 | 764.00 | 764.00 |
| Total Liabilities | 3072.00 | 3358.00 | 4041.00 | 4266.00 | 4655.00 | 5146.00 |
| ASSETS | ||||||
| Net Block | 879.00 | 819.00 | 1079.00 | 1025.00 | 982.00 | 938.00 |
| Long Term Loans & Advances | 43.00 | 52.00 | 52.00 | 52.00 | 52.00 | 52.00 |
| Other Non Current Assets | 38.00 | 26.00 | 69.00 | 69.00 | 69.00 | 69.00 |
| Current Assets | ||||||
| Currents Investments | 365.00 | 365.00 | 14.00 | 290.00 | 390.00 | 490.00 |
| Sundry Debtors | 586.00 | 588.00 | 857.00 | 754.00 | 835.00 | 935.00 |
| Cash and Bank | 418.00 | 558.00 | 903.00 | 1009.00 | 1260.00 | 1595.00 |
| Other Current Assets | 144.00 | 336.00 | 289.00 | 289.00 | 289.00 | 289.00 |
| Loans and Advances | 598.00 | 613.00 | 778.00 | 778.00 | 778.00 | 778.00 |
| Total Assets | 3072.00 | 3358.00 | 4041.00 | 4266.00 | 4655.00 | 5146.00 |
Cash Flow Statement
| Year End March | FY18 | FY19 | FY20 | FY21E | FY22E | FY23E |
|---|---|---|---|---|---|---|
| Profit After Tax | 309.00 | 422.00 | 468.00 | 479.00 | 604.00 | 713.00 |
| Depreciation | 127.00 | 125.00 | 173.00 | 189.00 | 198.00 | 229.00 |
| Changes In working Capital | -13.00 | -71.00 | -266.00 | 58.00 | -77.00 | -65.00 |
| Other Items | -41.00 | -23.00 | -77.00 | 0.00 | 0.00 | 0.00 |
| Cash Flow from Operations | 382.00 | 453.00 | 297.00 | 726.00 | 725.00 | 877.00 |
| Capital expenditure | -89.00 | -70.00 | -73.00 | -135.00 | -155.00 | -185.00 |
| Free Cash Flows | 294.00 | 382.00 | 224.00 | 591.00 | 570.00 | 692.00 |
| Other Items | -183.00 | -162.00 | 183.00 | -192.00 | -100.00 | -100.00 |
| Cash Flow from Investments | -270.00 | -230.00 | 112.00 | -327.00 | -255.00 | -285.00 |
| Increase / (Decrease) in Loan Funds | 1.00 | -5.00 | 24.00 | -35.00 | 0.00 | 0.00 |
| Equity Dividend Paid | -81.00 | -109.00 | -147.00 | -144.00 | -182.00 | -213.00 |
| Income tax on dividend | 0.00 | 0.00 | 0.00 | -30.00 | -37.00 | -44.00 |
| Others | 5.00 | 8.00 | -10.00 | 0.00 | 0.00 | 0.00 |
| Cash Flow from Financing | -74.00 | -106.00 | -133.00 | -209.00 | -219.00 | -257.00 |
| Net Change in Cash | 38.00 | 116.00 | 277.00 | 190.00 | 251.00 | 335.00 |
| Opening Cash & Cash Equivalents | 350.00 | 410.00 | 519.00 | 820.00 | 1009.00 | 1260.00 |
| Closing Cash & Cash Equivalent | 410.00 | 519.00 | 820.00 | 1009.00 | 1260.00 | 1595.00 |
Key Ratios
| Year End March | FY18 | FY19 | FY20 | FY21E | FY22E | FY23E |
|---|---|---|---|---|---|---|
| EPS reported | 45.60 | 65.30 | 71.00 | 76.30 | 96.30 | 113.70 |
| DPS | 15.00 | 0.00 | 20.00 | 23.00 | 29.00 | 34.00 |
| Book value (Rs/share) | 288.90 | 333.60 | 382.10 | 430.70 | 492.10 | 564.80 |
| ROE (%) | 18.00% | 22.00% | 21.00% | 19.00% | 21.00% | 22.00% |
| ROCE (%) Post Tax | 18.00% | 22.00% | 22.00% | 19.00% | 21.00% | 22.00% |
| Receivable Days | 64.30 | 58.30 | 63.00 | 62.60 | 53.10 | 51.20 |
| Inventory Days | 0.00 | 0.00 | 0.00 | 0.00 | 0.00 | 0.00 |
| Payable Days | 16.10 | 15.40 | 18.70 | 18.70 | 14.80 | 13.90 |
| PE | 18.99 | 20.30 | 16.90 | 0.00 | 0.00 | 0.00 |
| EV/EBITDA | -1.50 | -1.40 | -1.20 | -1.60 | -1.70 | -1.90 |
| Dividend payout ratio (%) | 33.00% | 0.00% | 28.00% | 30.00% | 30.00% | 30.00% |
| Debt/EBITA | 0.04 | 0.02 | 0.05 | 0.00 | 0.00 | 0.00 |
| Total debt/Equity | 0.01 | 0.01 | 0.01 | 0.00 | 0.00 | 0.00 |