
Cholamandalam Investment & Finance Company Ltd
Finance - NBFC
Cholamandalam Investment & Finance Company Ltd
Finance - NBFC
Stock Info
Shareholding Pattern
Price performance
Indexed Stock Performance
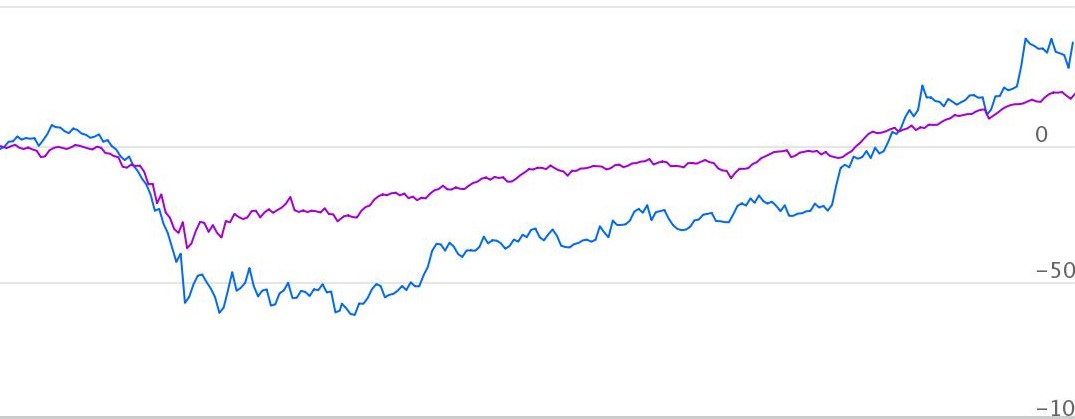
Superior growth and asset quality
Cholamandalam Investment and Finance Company Limited (Chola), incorporated in 1978 as the financial services arm of the Murugappa Group. Chola commenced business as an equipment financing company and has today emerged as a comprehensive financial services provider offering vehicle finance, home loans, loan against property, SME loans, investment advisory services, stock broking and a variety of other financial services to customers. Chola operates from 1132 branches across India with assets under management above INR 74,000 Crores.
Investment Rationale
Improving Asset Quality
Chola witnessed better than expected collections in Q2 FY21. Collection efficiency
improved month over month, it rose from 87% in September to 103% in October. Further,
November too has seen improvement in collection efficiency as compared to October.
Management have guided to reach pre-covid collection levels in Q3 FY21, as 95% of
moratorium customers started repaying their installments as on 30th October
2020. With respect to restructuring, management has identified 1% of loan book to
be restructured and in worst case they expect total restruturing to be less than
5% of overall portfolio.
Well diversified portfolio
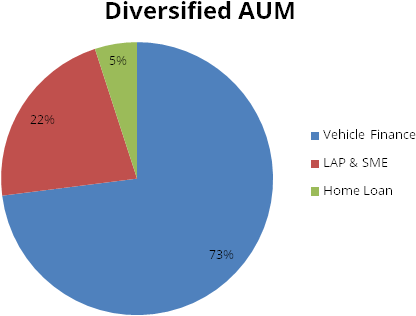
Chola has a well diversified AUM primarily in Vehicle finance, LAP & SME and
Home Loan. Vehicle financing forms 73% of AUM as on 30th September 2020,
while LAP & SME and home loan forms 22% & 5% of AUM respectively.
In terms of vehicle finance, geographical and product mix wise it is well diverfied. It lends to all categories like heavy commercial vehicles (HCV), light commercial vehicle (LCV), 2 wheelers (2W), 3 wheelers (3W), 4 wheelers and used vehicles. Geography mix wise East, South, North and West contribute 32%, 27%, 21% and 20% respectively.
Strong auto demand recovery
We believe with the roll out of vaccine, country will emerge out of Covid and economic
recovery will further gain pace, this should further beneift auto sales. Automobile
demand scenario has been improving month over month, with sales even better than
pre-covid levels in some categories. We expect sales of PVs and tractors to continue
to grow in double digit, as demand sustains post festive season. With regards to
commercial vehicles, strong recovery trend is visible.
High liquidity, reducing cost of funds and improved provisioning buffer
Due to covid, Chola has held liquidity at a record high. Chola holds strong liquidity
position of Rs. 6,802 crores as cash balance, and a total liquidity position of
Rs. 9,797 crores including undrawn sanction lines as on 30th September 2020.
Government and regulatory measures has helped reduce interest rates and improved liquidity in market. This has led to favorable cost of borrowings, which helped in improving overall profitability.
Asset quality as on September 2020 for Stage-3 assets has stood at 2.75% with adequate provision coverage at 42.65% as against 3.18% in H1 of FY20 with the provision coverage ratio of 34.43%. Stage-3 assets have improved from 3.8% in March 20 to 2.75% in September 2020.
Strong parentage
Founded in 1900, the INR 381 Billion Murugappa Group is one of India's leading
business conglomerates. The Group has 28 businesses including nine listed Companies
traded in NSE & BSE. Headquartered in Chennai, the major Companies of the Group
include Carborundum Universal Ltd., Cholamandalam Financial Holdings Ltd., Cholamandalam
Investment and Finance Company Ltd., Cholamandalam MS General Insurance Company
Ltd., Coromandel International Ltd., Coromandel Engineering Company Ltd., E.I.D.
Parry (India) Ltd., Parry Agro Industries Ltd., Shanthi Gears Ltd., Tube Investments
of India Ltd., and Wendt (India) Ltd.
Home Finance – Future growth engine
Chola’s home loan business focuses on end use driven funding to semi-urban
and rural markets, and does not have exposure to developers for construction finance.
Chola’s affordable home loan business is growing at robust pace although at
a low base. Disbursements grew by 30% year on year in FY 20. The business has also
witnessed a steady increase in its number of customers, with 24,000 live accounts
as of Mar’20, an increase of 68% over the previous year. For H1 FY21, Home
loan AUM stood at Rs. 3,630 cr., which has grown by 40% YoY, while PBT has grown
76%, as compared to H1 FY20.
Outlook & Valuation
Chola is one of the best vehicle finance company with strong return ratios, improving NIMs, well capitalised balance sheet, and strong underwriting record & parentage. Transportation of goods is fast recovering, as economy is opening up. We expect demand for tractors and used commercial vehicles to be robust and chola being one of the largest players in these segments will benefit the most. We expect vehicle fianance disbursements to pick up from Q4 FY21 onwards, while FY22 to provide strong growth on back of resilient rural segment, pick up in economic activities and upturn in CV cycle.
Consolidated Financial Statements
| Particulars | NII | PPOP | PAT | EPS | BV | ROE (%) |
|---|---|---|---|---|---|---|
| FY18 | 2819.90 | 1705.00 | 918.20 | 11.70 | 65.20 | 19.60 |
| FY19 | 3403.20 | 2134.30 | 1186.10 | 15.20 | 78.80 | 21.10 |
| FY20 | 4060.40 | 2483.00 | 1052.30 | 13.40 | 99.30 | 14.70 |
| FY21E | 4609.20 | 3084.50 | 1431.10 | 17.50 | 115.40 | 16.20 |
| FY22E | 5572.60 | 3762.90 | 2046.10 | 25.00 | 138.60 | 19.60 |
| FY23E | 6878.80 | 4743.40 | 2806.60 | 34.20 | 170.80 | 22.10 |
Investment Rationale
Improving Asset Quality
Chola witnessed better than expected collections in Q2 FY21. Collection efficiency
improved month over month, it rose from 87% in September to 103% in October. Further,
November too has seen improvement in collection efficiency as compared to October.
Management have guided to reach pre-covid collection levels in Q3 FY21, as 95% of
moratorium customers started repaying their installments as on 30th October
2020. With respect to restructuring, management has identified 1% of loan book to
be restructured and in worst case they expect total restruturing to be less than
5% of overall portfolio.
The company carries total provision of 1.2% of AUM for covid, and management expects no further covid related provision will be required.
| Moratorium months | No. of Agreements | Part EMI | 1 EMI | 2 EMIs | 3 EMI | 4+ EMIs | Total 1+ EMIs |
|---|---|---|---|---|---|---|---|
| 1 Month | 33674 | 7% | 44% | 11% | 3% | 5% | 63% |
| 2 Months | 27282 | 2% | 26% | 22% | 8% | 24% | 81% |
| 3 Months | 43840 | 0% | 5% | 11% | 22% | 60% | 97% |
| 4 Months | 80263 | 0% | 5% | 10% | 17% | 66% | 98% |
| 5 Months | 464437 | 0% | 17% | 32% | 18% | 29% | 97% |
| 6 Months | 428740 | 2% | 41% | 28% | 11% | 13% | 93% |
| Total Active | 1078236 | 1% | 26% | 27% | 14% | 26% | 94% |
| Closed Agreements | 38321 | ||||||
| Total Moratorium | 1116557 | 95% | |||||
Well diversified portfolio
Chola has a diversified AUM primarily in Vehicle finance, LAP & SME and Home
Loan. Vehicle financing forms 73% of AUM as on 30th Sepetember 2021,
while LAP & SME and home loan forms 22% & 5% of AUM respectively.
In terms of vehicle finance, geographical and product mix wise it is well diverfied. It lends to all categories like heavy commercial vehicles (HCV), light commercial vehicle (LCV), 2 wheelers (2W), 3 wheelers (3W), 4 wheelers and used vehicles. Geography mix wise East, South, North and West contribute 32%, 27%, 21% and 20% respectively.
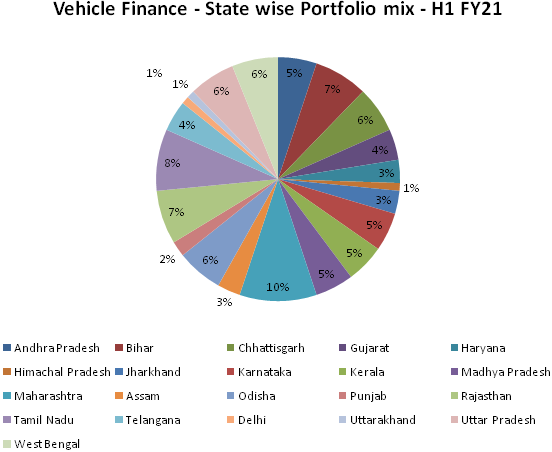
In the above table we can see that portofolio is well diversified across states and not a single state contributes more than 10% of total portfolio.
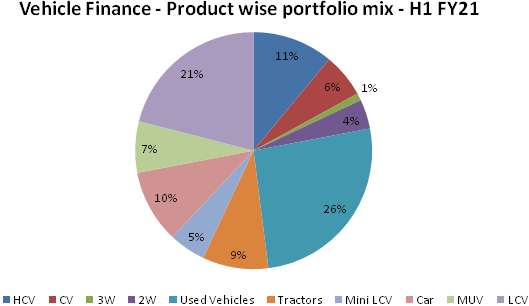
In the above table we can see that portfolio is well diversified across products with highest contribution towards used vehicles and LCV at 26% and 21% respectively.
Strong auto demand recovery
We believe with the roll out of vaccine, country will emerge out of Covid and economic
recovery will further gain pace, this should further beneift auto sales. Automobile
demand scenario has been improving month over month, with sales even better than
pre-covid levels in some categories. We expect sales of PVs and tractors to continue
to grow in double digit, as demand sustains post festive season. With regards to
commercial vehicles, strong recovery trend is visible.
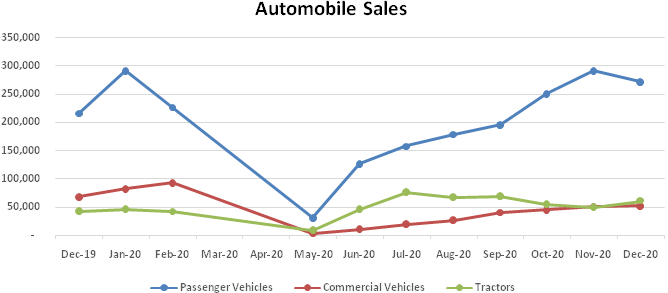
Commercial vehicles
Commercial Vehicle sales have been at a decade low but from July 2020, the sales
have been witnessing a recovery as reflected in e-way bill generation, GST collection,
and pick-up in construction and mining activities. LCVs are witnessing a faster-pace
growth compared to MHCVs. LCVs has grown faster in order to meet last mile connectivity
amid the surge in e-commerce, FMCG and agricultural activities. Fleet utilisation
has witnessed persistent increase from levels of 18%-20% in April-May to 84%-86%
in October-November; this increase in fleet utilisation bodes well for segment.
M&HCV sales for FY20 were lowest in the decade, which is followed by further
de-growth in FY21 due to covid. We expect multi-year up-cycle in M&HCV starting
next year and Chola being leader in commercial vehicle financing to benefit the
most.
Tractors
A faster recovery of the rural sector, a good Rabi harvest, higher farm output and
timely monsoon is expected to support tractor demand. The tractor registration from
July – November of 2020 has grown ~20% compared to same period last year.
Chola intends to maintain a strong focus on financing of tractors given the positive
industry trends. More than 80% of Chola’s branches are present in the rural
areas, towns and semi urban areas which give Chola a clear advantage to capitalize
on the uptick in rural demand.
Used commerical vehicle
Used commercial vehicle transactions are likely to be least impacted in FY21 considering
lower market prices of used CVs and BS VI transitioning which has led to 10%-15%
increase in prices for new vehicles. Chola is one of the largest players in the
used vehicle financing business with a disbursement mix of almost 30%. Also, the
proposed scrappage policy will help in generating higher demand for pre-owned vehicles.
High liquidity, reducing cost of funds and improved provisioning buffer
Record high liquidity
Due to covid, Chola has held liquidity at a record high. Chola holds strong liquidity
position of Rs. 6,802 crores as cash balance, and a total liquidity position of
Rs. 9,797 crores including undrawn sanction lines as on 30th September 2020. The
capital adequacy ratio of the company as on 30th September 2020 was at 19.5% as
against the regulatory requirement of 15%. The Asset Liability Management (ALM)
is comfortable with no negative cumulative mismatches across all time buckets. We
believe chola’s comfortable liquidity position, strong execution capabilities
will help to capture growth opportunities.
Strong provisioning buffer
Asset quality as on September 2020 for Stage-3 assets has stood at 2.75% with adequate
provision coverage at 42.65% as against 3.18% in H1 of FY20 with the provision coverage
ratio of 34.43%. Stage-3 assets have improved from 3.8% in March 20 to 2.75% in
September 2020. Apart from the provision coverage mentioned above, additional provision
of Rs. 585 crores created towards Stage-1 and Stage-2 to cover any contingencies
arising out of the COVID-19 pandemic. Total provision currently carried against
the overall book is 2.64% against the normal pre COVID level of 1.75%.
Cost of funds
Government and regulatory measures has helped reduce interest rates and improved
liquidity in market. This has led to favorable cost of borrowings, which helped
in improving overall profitability. Ratio of cost of funds to average assets saw
a reduction at 6.9% for Q2 FY21 as against 7.7% in Q2 FY20.
Strong parentage
Founded in 1900, the INR 381 Billion (38,105 Crores) Murugappa Group is one of India's
leading business conglomerates. The Group has 28 businesses including nine listed
Companies traded in NSE & BSE. Headquartered in Chennai, the major Companies
of the Group include Carborundum Universal Ltd., Cholamandalam Financial Holdings
Ltd., Cholamandalam Investment and Finance Company Ltd., Cholamandalam MS General
Insurance Company Ltd., Coromandel International Ltd., Coromandel Engineering Company
Ltd., E.I.D. Parry (India) Ltd., Parry Agro Industries Ltd., Shanthi Gears Ltd.,
Tube Investments of India Ltd., and Wendt (India) Ltd.
As a part of the Murugappa group, Chola gets management, financial and operational
support from parent and group companies. We believe strong parent helps in getting
better funding access. In difficult times, access to capital market funding remains
highly confidence sensitive, during these difficult time strong parent backed entities
are relatively less hurt.
Home Finance – Future growth engine
The Indian Housing Finance market is estimated to be Rs.21 lakh crore and grew at
around 10 - 14% in FY 20. The growth in the affordable housing finance segment (estimated
at Rs.3 lakh crore), continued to out-pace the overall housing finance market and
is estimated to grow between 15 - 20% in the coming years. The national mission
of ‘Housing for All by 2022’ continues to be at the forefront of the
Government’s initiatives. The subsidy offered to customers through the PMAY
(Pradhan Mantri Awas Yojana) - CLSS (Credit Linked Subsidy Scheme) has helped in
growing affordable housing segment. Sustained support from the government has allowed
the industry to thrive in India. Given this environment, the demand for affordable
housing continues to remain intact.
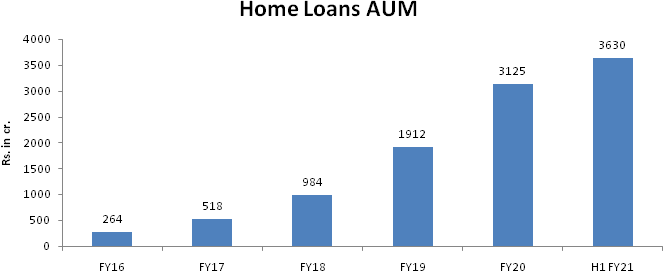
Chola’s home loan business focuses on end use driven funding to semi-urban and rural markets, and does not have exposure to developers for construction finance. Affordable Home loan business is growing at robust pace although at a low base. Disbursements grew by 30% year on year in FY 20. The business has also witnessed a steady increase in its number of customers, with 24,000 live accounts as of Mar’20, an increase of 68% over the previous year. For H1 FY21, Home loan AUM stood at Rs.3,630 cr., which has grown by 40% YoY, while PBT has grown 76%, as compared to H1 FY20.
We believe home loan business has huge growth potential with strong industry prospects and government push. Currently as on H1 FY21, chola has activated home loan business in 167 branches covering 9 states. We believe over time home loan business will be done across all existing 1132 branches, which will provide robust growth.
Financials
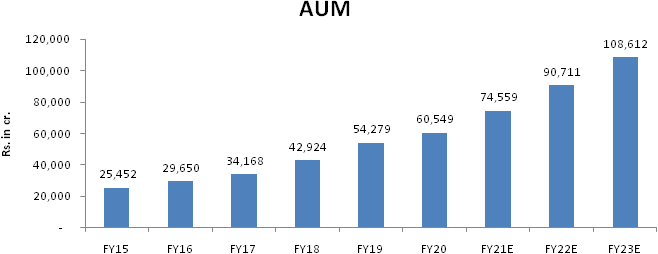
Chola has been most consistent performer and has a strong financial & operational track record. We have estimated 19% CAGR growth in NII for FY20-23E, led by 21.5% CAGR in AUM growth from FY20-23E. High AUM growth is estimated on back of unlocking of economy, upturn in CV cycle, consolidation in NBFC sector, and robust growth in home loans. With regards to asset quality, we expect with improving fleet utilization levels, vehicle finance NPAs will remain stable and reduce over period of time. We estimate provisions to remain elevated for FY21 and reduce in FY22 with improving collections.
Profitabiity and AUM growth
AUM has grown at 3-year CAGR of 21%, 5-year CAGR of 20% and 10-year CAGR of 23%.
Disbursements have grown at 5-year CAGR of 15% and 10-year CAGR of 20%. Despite
industry facing lot of challenges, Chola has been able to maintain its asset quality
with lowest NPAs in the industry. Chola’s PAT has grown at 5-year CAGR of
17% and 10-year CAGR of 37%.
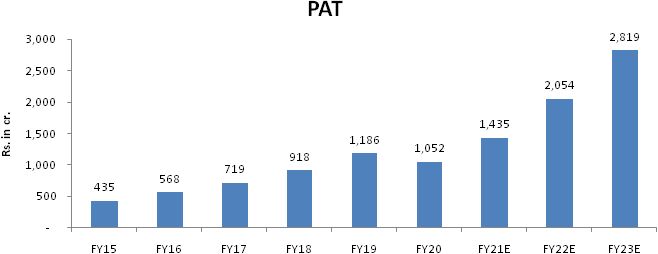
For FY20, if we exclude one time provision for covid, PAT would stand at Rs. 1387 cr.
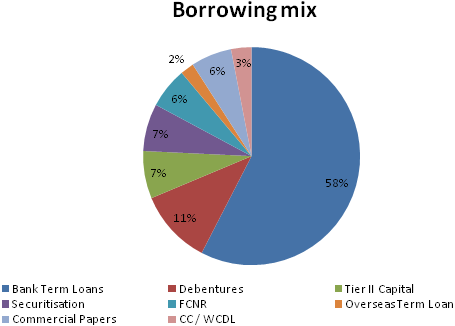
Diversified Liability profile
After IL&FS crisis, Chola has steadily increased its borrowings from Banks.
Bank Term Loans increased from 47% in Q2 FY20 to 57% in Q2 FY21. Currently with
excess liquidity in system, Chola is able to borrow at <7% interest rate, which
inturn will improve spreads.
Strong Return Ratios
Chola has consistently improved its RoE and RoA year after year. FY20 was an exceptional
year because of covid related provisions impacting profitability. We expect these
ratios to further improve and reach RoE of 22.2% and RoA of 2.84% by FY23.
| Return Ratios | FY 2018 | FY 2019 | FY 2020 | H1 FY2021 |
|---|---|---|---|---|
| RoA | 2.5% | 2.4% | 1.8% | 2.6% |
| RoE | 19.6% | 20.9% | 15.2% | 20.0% |
Industry
NBFCs
NBFCs play a crucial role in financial inclusion by providing last mile access to
meet the diversified financial needs of less-banked customers. The sector also plays
a vital role by meeting the credit needs of retail and MSME segment. Over the years,
the sector has rapidly grown with a few large players becoming comparable in size
to some of the private sector banks and has also witnessed advent of many non-traditional
players leveraging technology to adopt tech-based innovative business models.
The primary activities of NBFCs are providing consumer credit, including automobile finance, home finance and consumer durable products finance, wholesale finance products such as bills discounting for small and medium companies and infrastructure finance, and fee-based services such as investment banking and underwriting.
NBFCs mobilise resources largely from debentures and bank borrowings. The default by one large NBFC a couple of years ago has shaken the market confidence and created ripple effect over the entire sector which had resulted in drying-up bank lending, thereby forcing NBFCs to scout for alternate sources of funding. However, in 2020-21, up to September, market confidence revived and NBFCs’ borrowings from banks and FIs accelerated, buoyed by various policy measures taken by the RBI and the government to combat the impact of covid-19 pandemic.
| Items (INR in Crores) | March 2019 | March 2020 | September 2020 |
|---|---|---|---|
| Debentures | 9,19,314 | 9,40,499 | 9,15,293 |
| Bank Borrowings | 6,26,495 | 7,08,035 | 7,34,322 |
| Borrowings from FIs | 40,459 | 73,811 | 1,16,443 |
| Inter-corporate Borrowings | 75,805 | 78,288 | 81,044 |
| Commercial Papers | 1,59,158 | 70,066 | 89,065 |
| Other Borrowings | 2,89,254 | 4,09,642 | 4,16,276 |
| Total | 21,10,785 | 22,80,341 | 23,52,444 |
Source: RBI report on trend and progress of banking in India, StockAxis Research
In FY20, bank subscription to NBFCs debentures and CPs declined, however in H1 FY2021, the banks’ exposure increased in direct lending and debenture investments. Investments in debentures by banks have increased on the back of abundant liquidity, partial guarantee schemes by GoI, TLTRO and SLS. On the backdrop of Covid-19 pandemic, issuance of CPs by NBFCs fell and borrowing rates saw an uptick due to risk aversion. However, an easing of rates was witnessed in July due to intervention by the Government and the RBI to restore the confidence in the sector. Mutual funds’ investments to NBFCs’ paper was largely in a few large and well-rated NBFCs. Further, the RBIs policy has aided in easing external commercial borrowings by NBFCs; Interest of foreign investors was prompted by higher yields, while lower overall costs, might have encouraged NBFCs to utilise this window.
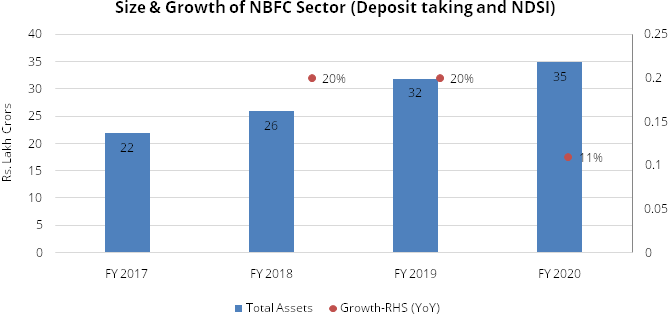
During March 2009 and March 2019, the total assets of NBFCs grew at a CAGR of 18.6%. In absolute terms, the asset size of NBFC sector, including HFCs, as on March 2020, is INR 51.47 lakh crore.
Source: RBI report on trend and progress of banking in India, StockAxis Research
As the sector was gradually moving towards normalcy, the on-going pandemic and resulting disruptions in economic activity has led to building up of huge stress in the financial system. While the entire financial system was affected, the impact was significantly greater on NBFCs due to their underlying business models, thereby straining their profitability. NBFCs are here to stay and play a vital role in economic growth as well as in financial inclusion. As the country’s economy grows, the requirement for credit will rise more than proportionately. NBFCs with robust business models, strong liquidity mechanisms and governance & risk management standards are set to reap benefits of the market opportunity.
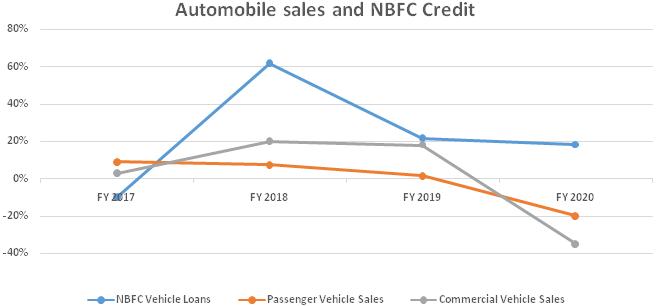
Automobile Financing
NBFCs play an important role in driving the auto demand. Over 40% of the retail
portfolio of NBFCs is vehicle and auto loans. The slowdown in auto loans in 2018-19
could be attributed to a slump in aggregate demand, intensified by postponement
of vehicle purchases in anticipation of the implementation of BS-VI norms, the sharp
increase in insurance costs in case of passenger vehicles and two wheelers, and
sizeable enhancement in permissible axle load for commercial vehicles. Following
that, the global pandemic caused the historic zero sales and subsequent business
disruptions.Thus, the auto industry was already reeling under stress even during
the pre-covid times, when demand for automobiles was way behind the normal levels.
Source: RBI report on trend and progress of banking in India, StockAxis Research
As per the recent report by CRISIL, the vehicle financing of NBFCs have grown at a CAGR of 18% from FY 2016 – FY 2019. In FY 2020, 3% YoY growth was witnessed in vehicle finance. Further, CRISIL is projecting a growth of 1% - 3% YoY in FY 2021 and 7% - 9% YoY in FY 2022P.
Some of the factors that which may prove to be positive for auto finance NBFCs are: 1) lower asset quality stress than initially anticipated 2) access to lower cost of funds for NBFCs backed by strong parentage 3) Data, which suggests that CV cycle is on the turn of the recovery. Large provisions have been built which can be tapped to cover any NPA stress which may arise due to factors like Covid-19 pandemic and other macro factors. Furthermore, the recent capital raises and conservative Asset-Liability Management provide enough balance sheet strength to grow when the cycle turns positive.
Source: FADA India, StockAxis Research
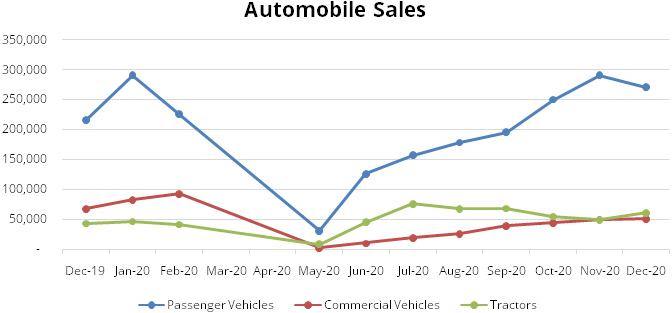
Commercial Vehicle sales have been at a decade low but from July 2020, the sales have been witnessing a recovery as reflected in e-way bill generation, GST collection, and pick-up in construction and mining activities. LCVs are witnessing a faster-pace growth compared to MHCVs. Among LCVs, the truck segment has grown faster in order to meet last mile connectivity amid the surge in e-commerce, FMCG and agricultural activities. Fleet utilisation has witnessed persistent increase from levels of 18%-20% in April-May to 84%-86% in October-November; this increase in fleet utilisation bodes well for segment. The data from the last decade suggests that only three years have witnessed the sales of more than 8 lakhs vehicles and generally, the trend has hovered around 6 – 7 lakhs units per year. In spite of that, the vehicle financiers have been able to grow their disbursements and loan book on consistent basis.
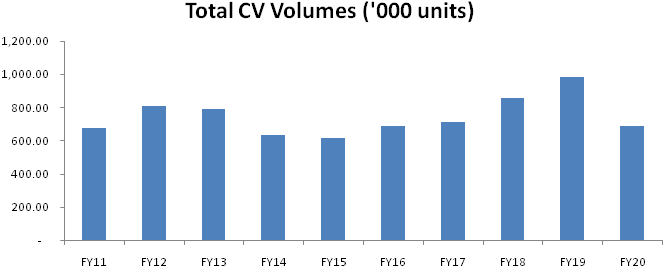
| Volumes | FY11 | FY12 | FY13 | FY14 | FY15 | FY16 | FY17 | FY18 | FY19 | FY20 |
|---|---|---|---|---|---|---|---|---|---|---|
| M&HCV | 3,22,880 | 3,48,775 | 2,68,304 | 2,00,527 | 2,32,740 | 3,02,372 | 3,02,448 | 3,40,505 | 3,70,106 | 1,96,845 |
| LCV | 3,54,742 | 4,59,436 | 5,24,616 | 4,31,890 | 3,82,216 | 3,83,332 | 4,11,706 | 5,16,231 | 6,14,136 | 4,92,392 |
| Total | 6,77,622 | 8,08,211 | 7,92,920 | 6,32,417 | 6,14,956 | 6,85,704 | 7,14,154 | 8,56,736 | 9,84,242 | 6,89,237 |
| Growth % | 19% | -2% | -20% | -3% | 12% | 4% | 20% | 15% | -30% | |
| Chola's AUM (Rs. in cr.) | 9,124 | 13,462 | 18,998 | 23,253 | 25,452 | 29,650 | 34,167 | 42,924 | 54,279 | 60,549 |
| Growth % | 48% | 41% | 22% | 9% | 16% | 15% | 26% | 26% | 12% |
Tractor sales are expected to be healthy backed by higher farm output, good rabi sowing, and timely monsoon. The tractor registration from July – November of 2020 has grown ~20% compared to same period last year. Further, debt servicing capabilities of tractor loan borrowers has improved.
Scrappage Policy to create new demand stimulus in the Auto industry
As per the recent updates, it is expected that the government is set to announce
scrappage policy as early as next month. The policy considers the commercial vehicles
over 15 years and private vehicles over 20 years for scrappage. The policy aims
to increase the demand of vehicles in the market as well as to reduce the dependence
of steel imports. The thesis here is that, when the vehicle owner turns their cars
in, then a need for new and better commute arises, which in turn, push the demand
further. It is expected that over 21 million vehicles could go off-road by 2025,
leading to the growth in vehicle demand. This incremental demand should aid vehicle
financiers to grow disbursements meaningfully.
Micro, Small & Medium Enterprise (MSMEs) Financing
As per the recent report of CIBIL, several lenders have become more cautious and
paused disbursing the loans in this segment in Q1 FY 2021. The Covid-19 pandemic
and the resultant lockdown has impacted the credit growth to MSMEs. In past, NBFCs
have shown a substantially high growth momentum in the micro segment as a strategy
of acquiring low value and granular loans.
SME & LAP (Loan against Property) constitute 22% of Chola’s AUM mix as on 30th September 2020, where company focuses on retail loans with adequate security cover (LTV at 52%). As per the CRISIL Research, non-bank’s loan against property disbursements may decline 2% - 3% in the current fiscal, however, the growth is expected to improve in the next fiscal, though it will be 4% -5% as players are likely to be risk averse.
Home Loan
The affordable housing finance industry received a much-needed growth impetus from
the ‘Housing for All by 2022’ scheme of the GoI. Sustained support from
the government has allowed the industry to thrive in India. Housing Finance Companies
(HFCs), along with Banks are main source of housing credit. HFCs experienced headwinds
in FY 2020 due to liquidity stress and constraints on market access after DHFL event.
Bank credit to the housing sector decelerated in FY 2020.
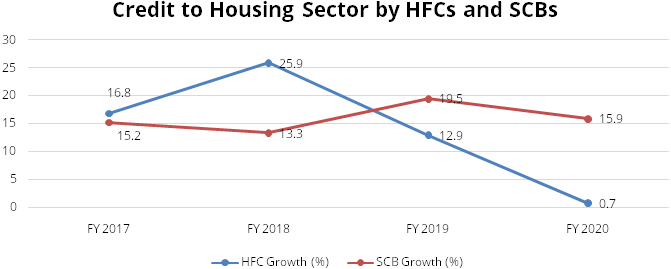
Source: RBI report on trend and progress of banking in India, StockAxis Research
Factors such as muted credit demand, DHFL episode and the slowdown in the housing sector have resulted in a sharp deceleration in loans and advances by HFCs in FY 2020, which, in turn, affected their profitability.
The liquidity position of HFCs has witnessed some improvement after the RBI announced several regulatory and liquidity measures, along with the announcement of Aatmanirbhar Bharat Abhiyan by the GoI. The Liquidity Infusion Facility Scheme and participation in the equity share capital of HFCs by NHB will also help in quick revival of the sector. As per the recent report by CRISIL, home loans have grown 19% CAGR from FY 2016 – FY 2019. Further, it has projected the growth of 1% - 3% in 2021 and 7% - 9% growth on FY 2022.
Peer comparison
Chola has outperformed its peers in AUM growth, return ratios (RoA and RoE) and
asset quality.
| Company | AUM (Rs. Crores) | ||||||
|---|---|---|---|---|---|---|---|
| FY 2017 | FY 2018 | FY 2019 | FY 2020 | H1 FY2021 | 3Yr. CAGR FY17-20 | ||
| Chola finance | 34,167.00 | 42,924.00 | 54,279.00 | 60,549.00 | 67,182.00 | 21.01% | |
| Sundaram finance | 20,735.00 | 24,964.00 | 28,984.00 | 29,936.00 | 30,572.00 | 13.02% | |
| M&MFIN | 42,356.00 | 48,547.00 | 61,250.00 | 64,993.00 | 67,768.70 | 15.34% | |
| SRIRAM TRNS FIN | 78,760.93 | 96,260.61 | 1,04,482.29 | 1,09,749.24 | 1,13,345.93 | 11.69% | |
| Company | GNPA (%) | ||||||
|---|---|---|---|---|---|---|---|
| FY 2018 | FY 2019 | FY 2020 | H1 FY2021 | ||||
| Chola finance | 3.40% | 2.70% | 3.80% | 2.75% | |||
| Sundaram finance | 1.27% | 2.95% | 3.77% | 3.67% | |||
| M&MFIN | 9.76% | 6.45% | 8.44% | 7.03% | |||
| SRIRAM TRNS FIN | 9.80% | 8.90% | 9.00% | 6.42% | |||
| Company | ROA | ||||||
|---|---|---|---|---|---|---|---|
| FY 2018 | FY 2019 | FY 2020 | H1 FY2021 | ||||
| Chola finance | 2.50% | 2.40% | 1.80% | 2.60% | |||
| Sundaram finance | 2.14% | 2.00% | 2.17% | 1.02% | |||
| M&MFIN | 2.20% | 2.60% | 1.30% | 1.20% | |||
| SRIRAM TRNS FIN | 2.64% | 2.33% | 2.17% | 1.64% | |||
| Company | ROE | ||||||
|---|---|---|---|---|---|---|---|
| FY 2018 | FY 2019 | FY 2020 | H1 FY2021 | ||||
| Chola finance | 19.60% | 20.90% | 15.20% | 20.00% | |||
| Sundaram finance | 14.50% | 13.20% | 13.70% | 6.10% | |||
| M&MFIN | 13.30% | 15.20% | 8.10% | 7.50% | |||
| SRIRAM TRNS FIN | 20.78% | 17.52% | 14.71% | 10.78% | |||
| Company | No. of Branches | ||||||
|---|---|---|---|---|---|---|---|
| FY 2018 | FY 2019 | FY 2020 | H1 FY2021 | 3Yr. CAGR | |||
| Chola finance | 870.00 | 900.00 | 1,105.00 | 1,132.00 | 9.17% | ||
| Sundaram finance | 622.00 | 658.00 | 610.00 | 588.00 | -1.86% | ||
| M&MFIN | 1,284.00 | 1,321.00 | 1,322.00 | 1,256.00 | -0.73% | ||
| SRIRAM TRNS FIN | 1,213.00 | 1,545.00 | 1,758.00 | 1,784.00 | 13.72% | ||
We can see from above tables that Chola is better than its peers in multiple metrices. Chola has grown its AUM at 21% CAGR from FY17-20, while M&M Fin, Shriram and Sundaram have grown its AUM at 15%, 12% and 13% respectively. Chola has lowest gross NPAs amongst peers at 2.75% and best RoA & RoE at 2.6% & 20%, while the next best RoA and RoE are of Shriram at 1.6% and 10.8%. With regards to branch addition, only Chola and Sriram are able to add branches on a consistent basis year after year.
Risks & Concerns
- Cyclicality of commercial vehicle industry
Commercial vehicle (CV) industry is linked to economic activities, slowdown in economy will impact CV sales and inturn vehicle finance companies w.r.t. loan growth and asset quality. - High risk customers
Chola has strong presence in rural and semi-urban India, where majority of its branches are located. Rural India is dependant on monsoon and poor rainfall will lead to slowdown. Further, the customer base is of economically lower class with low or no credit ratings. - Deterioration in Asset quality under SME & LAP segment
Micro, Small and Medium Enterprises (MSMEs) are heavily impacted because of Covid-19. Chola’s exposure to MSMEs portfolio is seeing higher deliquencies and muted growth. Further delay in recovery will impact asset quality negatively.
Outlook & valuation
Chola is one of the best vehicle finance company with strong return ratios, improving NIMs, well capitalised balance sheet, and strong underwriting record & parentage. Transportation of goods is fast recovering, as economy is opening up. We expect demand for tractors and used commercial vehicles to be robust and chola being one of the largest players in these segments will benefit the most. We expect vehicle fianance disbursements to pick up from Q4 FY21 onwards, while FY22 to provide strong growth on back of resilient rural segment, pick up in economic activities and upturn in CV cycle.
We believe Home finance segment will be future growth engine, where AUM is expected to grow at 33% CAGR over FY20-23E and will contribute 7.4% of total AUM for FY23 E as compared to 5.6% in FY20.
The stock is currently trading at 2.8x / 2.3x FY22E / FY23E P/BV (book value) which is resonable given improved growth and strong uptick in earnings in FY22 E & FY23 E. We initiate a Buy on the Chola, valuing the stock at 2.75x FY23E P/BV and arrive at target price of Rs. 470.
Financial Statement
Profit & Loss statement
| Description | Mar-18 | Mar-19 | Mar-20 | Mar-21 E | Mar-22 E | Mar-23 E |
|---|---|---|---|---|---|---|
| Operating Income | 5479.23 | 6991.97 | 8652.63 | 9540.80 | 10912.79 | 12975.90 |
| Growth % | 18.00% | 28.00% | 24.00% | 10.00% | 14.00% | 19.00% |
| Interest Expense | 2659.33 | 3588.74 | 4592.23 | 4931.60 | 5340.17 | 6097.10 |
| Net Interest Income | 2819.90 | 3403.23 | 4060.40 | 4609.20 | 5572.62 | 6878.80 |
| Growth(%) | 16.00% | 21.00% | 19.00% | 14.00% | 21.00% | 23.00% |
| Other Income | 0.43 | 0.67 | 0.26 | 0.29 | 0.31 | 0.35 |
| Revenue from Operations | 2820.33 | 3403.90 | 4060.66 | 4609.49 | 5572.93 | 6879.15 |
| Employee benefits expense | 536.79 | 590.58 | 655.00 | 706.02 | 818.46 | 973.19 |
| Depreciation | 49.68 | 55.48 | 107.54 | 112.92 | 118.56 | 124.49 |
| Other expenses | 528.79 | 623.49 | 815.06 | 706.02 | 873.02 | 1038.07 |
| Total Operating Expenses | 1115.36 | 1269.63 | 1577.68 | 1524.96 | 1810.05 | 2135.75 |
| PPOP | 1704.97 | 2134.27 | 2482.98 | 3084.53 | 3762.89 | 4743.39 |
| Growth(%) | 20.00% | 25.00% | 16.00% | 24.00% | 22.00% | 26.00% |
| Provisions | 303.70 | 311.20 | 897.33 | 876.09 | 768.51 | 741.48 |
| PBT | 1401.27 | 1823.07 | 1585.65 | 2208.44 | 2994.38 | 4001.91 |
| Tax | 483.07 | 637.00 | 533.36 | 777.30 | 948.25 | 1195.33 |
| Profit After Tax | 918.20 | 1186.07 | 1052.29 | 1431.14 | 2046.13 | 2806.58 |
| Growth(%) | 28.00% | 29.00% | -11.00% | 36.00% | 43.00% | 37.00% |
| Basic EPS | 11.74 | 15.17 | 13.37 | 17.45 | 24.95 | 34.23 |
Balance Sheet
| Description | Mar-18 | Mar-19 | Mar-20 | Mar-21 E | Mar-22 E | Mar-23 E |
|---|---|---|---|---|---|---|
| EQUITY AND LIABILITIES | ||||||
| Share Capital | 156.40 | 156.43 | 163.98 | 164.00 | 164.00 | 164.00 |
| Total Reserves | 4941.74 | 6019.31 | 8007.86 | 9303.62 | 11210.40 | 13865.65 |
| Shareholder's Funds | 5098.14 | 6175.74 | 8171.84 | 9467.62 | 11374.40 | 14029.65 |
| Borrowings | 31278.81 | 45707.43 | 53417.20 | 65873.23 | 78455.78 | 90907.99 |
| Deferred Tax Assets / Liabilities | -361.71 | -453.00 | -520.83 | -520.83 | -520.83 | -520.83 |
| Long Term Provisions | 38.25 | 38.88 | 39.69 | 39.69 | 39.69 | 39.69 |
| Total Non-Current Liabilities | 30955.35 | 45293.31 | 52936.06 | 65392.09 | 77974.64 | 90426.85 |
| Trade Payables | 271.10 | 336.36 | 302.39 | 313.67 | 358.78 | 426.60 |
| Other Current Liabilities | 326.73 | 273.44 | 422.62 | 422.62 | 422.62 | 422.62 |
| Short Term Borrowings | 7051.52 | 4859.31 | 1588.23 | 1588.23 | 1588.23 | 1588.23 |
| Short Term Provisions | 25.18 | 35.14 | 51.07 | 51.07 | 51.07 | 51.07 |
| Total Current Liabilities | 7674.53 | 5504.25 | 2364.31 | 2375.59 | 2420.70 | 2488.52 |
| Total Liabilities | 43728.02 | 56973.30 | 63472.21 | 77235.30 | 91769.73 | 106945.03 |
| ASSETS | ||||||
| Net Advances | 42253.23 | 52622.27 | 55402.73 | 69340.24 | 84361.05 | 101008.88 |
| Net Block | 160.75 | 162.62 | 273.46 | 290.54 | 311.98 | 337.49 |
| Non Current Investments | 72.97 | 73.06 | 73.06 | 73.06 | 73.06 | 73.06 |
| Long Term Loans & Advances | 160.66 | 148.64 | 153.17 | 153.17 | 153.17 | 153.17 |
| Other Non Current Assets | 11.37 | 11.46 | 14.22 | 14.22 | 14.22 | 14.22 |
| Total Non-Current Assets | 42662.78 | 53031.15 | 55926.90 | 69871.24 | 84913.48 | 101586.82 |
| Cash and Bank | 887.95 | 3674.85 | 6959.10 | 6739.90 | 6242.46 | 4720.43 |
| Other Current Assets | 47.06 | 179.31 | 472.02 | 472.02 | 472.02 | 472.02 |
| Short Term Loans and Advances | 36.23 | 44.50 | 55.45 | 55.45 | 55.45 | 55.45 |
| Total Current Assets | 1065.24 | 3942.15 | 7545.31 | 7374.43 | 6895.59 | 5430.60 |
| Total Assets | 43728.02 | 56973.30 | 63472.21 | 77235.30 | 91769.73 | 106945.03 |
Key Ratios
| Description | Mar-18 | Mar-19 | Mar-20 | Mar-21 E | Mar-22 E | Mar-23 E |
|---|---|---|---|---|---|---|
| Earnings Per Share (Rs) | 58.75 | 15.17 | 13.37 | 17.45 | 24.95 | 34.23 |
| Adj DPS(Rs) | 1.30 | 1.30 | 1.70 | 1.70 | 1.80 | 2.00 |
| Adjusted Book Value (Rs) | 65.22 | 78.75 | 99.34 | 115.41 | 138.56 | 170.79 |
| NIIM (%) | 9.03 | 7.15 | 7.51 | 7.38 | 7.30 | 7.42 |
| ROA (%) | 2.48 | 2.36 | 1.75 | 2.03 | 2.42 | 2.82 |
| ROE (%) | 19.57 | 21.08 | 14.72 | 16.23 | 19.63 | 22.10 |
| Cost to Income Ratio | 41.3% | 38.9% | 41.5% | 35.5% | 34.6% | 32.9% |
| Total Debt/Equity(x) | 7.52 | 8.21 | 6.76 | 7.13 | 7.04 | 6.59 |
| GNPA (%) | 3.4% | 2.7% | 3.8% | 3.5% | 3.2% | 3.0% |
| NNPA (%) | 2.2% | 1.7% | 2.2% | 2.0% | 1.9% | 1.8% |