Blue Dart Express Ltd
Courier Services
Blue Dart Express Ltd
Courier Services
Stock Info
Shareholding Pattern
Price performance
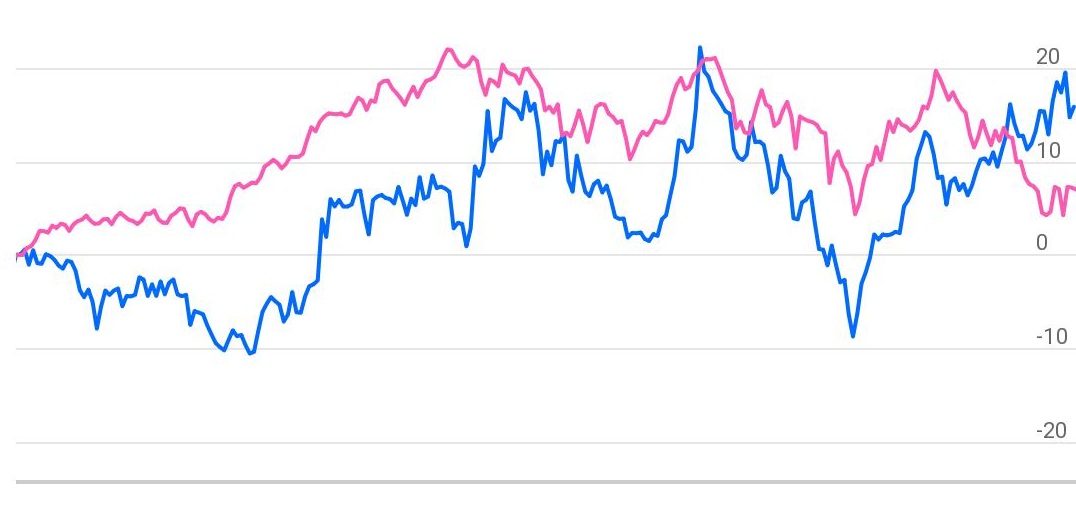
Indexed Stock Performance

NEW 52 WEEK HIGH

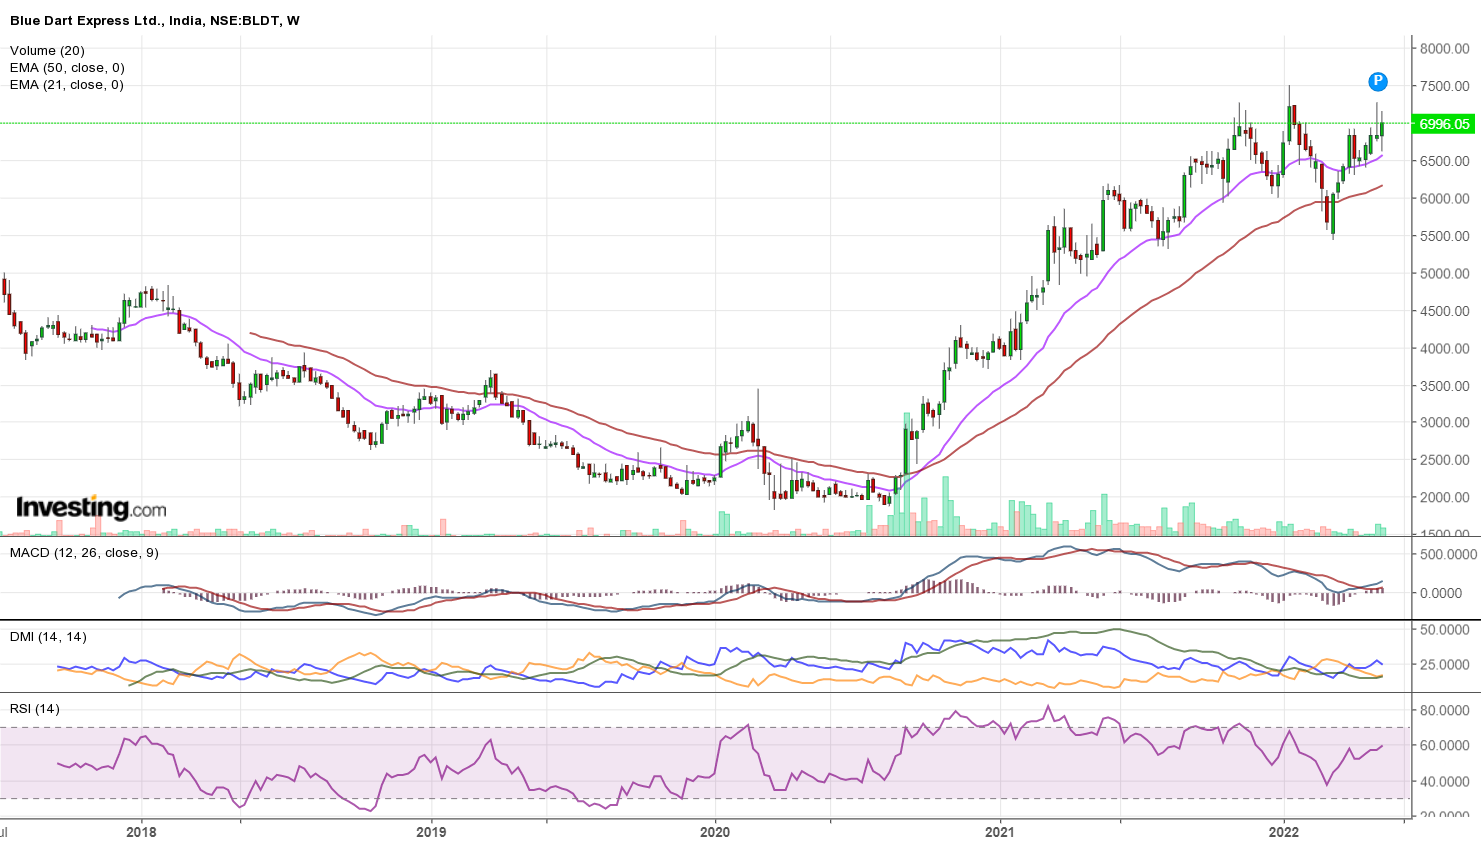
Price: BLUEDART is moving in pattern of higher highs and higher lows on weekly chart, which indicates signs of bullishness. The stock has made a bottom at Rs.5425.25 (on 07 March 2022), which also ended short term down trend in the stock from its previous swing high of Rs.7500 made on 13th January 2022 indicating its long-term secular uptrend has resumed. The stock has been significantly outperforming NIFTY over week-on-week basis. We expect the stock to continue its outperformance in the coming weeks. The stock has bounced from the support level with increase in volumes which indicates the strength in the counter.
Indicator: The stock is trading above important moving averages 21SMA & 50SMA on daily charts as well as weekly charts. Bollinger Band (20, 2, S) set up on daily chart has started to expand and currently the stock is trading near the upper band of Bollinger Band indicating the volatility expansion on the higher side. RSI (14) on daily chart is pegged at sub 63.12 levels, indicating the stock has not yet been over bought. The Parabolic SAR is trading below its price action on weekly charts reflect up trend in the stock will remain intact in near term. The MACD is trading above the signal in buy territory on weekly chart, indicating positive momentum in the stock in the near term.
Volume: Price and volume pattern are moving in the same direction which reflects the true movements in the stock. BLUEDART stock has seen increase in volume with increase in the price, which shows the movement of this stock is on bull side.
Conclusion: Considering all the above data facts, we recommend buying for medium term. The stock has seen volume break out on daily basis, which indicates strong hands are accumulating the stock at currents levels, which enhances our confidence on the stock.
Investor may go long on the stock around Rs.7135 keeping a stop loss below Rs.6200 for target of Rs.8500 level.