
Blue Dart Express Ltd
Courier Services
Blue Dart Express Ltd
Courier Services
Stock Info
Shareholding Pattern
Price performance
Indexed Stock Performance
South Asia's Premier Express Air and Integrated Transportation & Distribution Company
Blue Dart Express Limited (Blue Dart) is engaged in transportation and distribution of time-sensitive shipments, through a network of integrated ground and air transportation. It is the South Asia’s leading courier and integrated air express package distribution company. Founded in 1983, Blue Dart was acquired by DHL Express Singapore Pte. Ltd. (100% Subsidiary of Deutsche Post AG or DP DHL) in 2005 with 81.03% stake and later, in November 2012, DP DHL diluted 6.03% stake to comply with SEBI requirement of minimum public shareholding. As of December, the stake of DP DHL in Blue Dart stood at 75%.
Blue Dart has an extensive network of 35,000+ locations across India and servicing 220+ countries and territories worldwide through a sales alliance with DP DHL. Through the alliance, Blue Dart benefits from DP DHL’s global reach, cross border specialisation and larger network. Blue Dart operates with its own fleet of six Boeing 757-200 freighter aircrafts, a flotilla of 22,336 vehicles as well as 2,173 facilities and hubs. Since inception, the company has maintained its technology leadership and continues to invest in its technology infrastructure to create differentiated delivery capabilities, products, and solutions for its customers.
Investment Rationale
Undisputed Market Leader in the Express Logistics in India
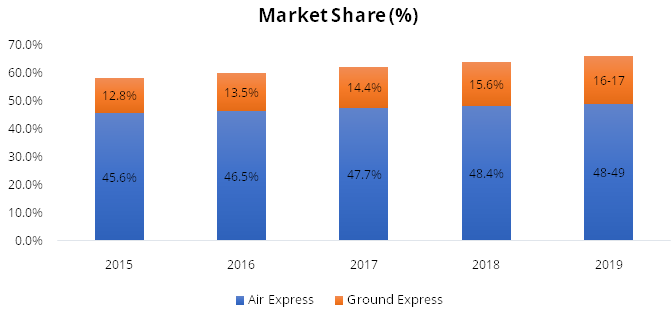
Blue Dart has a leading market share in domestic air express with a lion market
share of 48%-49%. The market share has witnessed a marginal uptick every year which
stood at ~45% in 2015. Further, the company is also fast emerging as a key player
in the ground express segment and its market share is witnessing a continuous growth
from ~13% in FY15 to 16%-17% currently.
Factors such as security infrastructure and upgrades in automation and technology are turning to be most vital aspects in differentiating business. Blue Dart gives a strong emphasis on the technology and is the only Indian air and ground express company that has invested extensively in technology infrastructure to create differentiated delivery capabilities, quality services and customised solutions for the customers. We believe that this gives a competitive edge to the Blue Dart over other players in the industry and this will continue to aid the company to remain a market leader in air express and gain market share in ground express in the coming years.
Source: Investor Presentation
Acceleration in E-commerce to Drive Growth
E-commerce is emerging as a major growth driver for the entire logistics sector
around the world. There has been a substantial shift in purchasing behaviour of
the consumers over the last couple of years towards e-commerce platforms on account
of convenience, easy to pay, quick delivery, large pool of products, among others.
This purchasing behaviour has been further boosted by the covid-19 pandemic. In
India, e-commerce has transformed the way business is done and the industry is expected
to reach at USD 200 billion by 2026 from USD 38.5 billion in 2017 (Source: IBEF).
The growth will be supported by the factors such as growing number of smartphone
users, higher internet penetration, increasing participation from Tier – II,
III and IV towns, increase in preference for shopping online over in-store purchase,
among others.
Blue Dart operates through its B2B and B2C segments. Under B2B segment, the company caters to industries such as E-commerce, Lifesciences & Healthcare, Automobile, Consumer Electronics, Banking, Financial Services & Insurance, etc. E-commerce segment is one of the biggest contributors to the company’s revenues and contributes between 20% - 25% of the total revenue. The customers of e-commerce expect and demand various services from e-commerce platforms such as competitive pricing & transit time, enhanced reach, on-time delivery, real-time tracking, reverse pickups/exchanges, various payment options, among others.
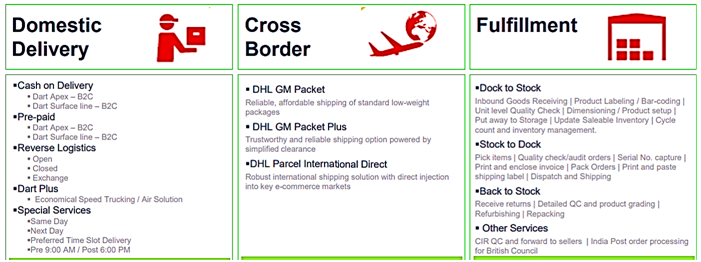
Blue Dart provides the most efficient solutions to its e-commerce clients with enhanced ground product (Dart Plus, Speed Trucking), a significant reach of 14,400 pin codes, 24x7 shipment visibility, same day and next day delivery options, open & closed reverse pickups with exchange services and more than 15 payment options in the form of digital wallets, debit/credit cards, UPI payments, etc. Further, it also offers some differentiated services such as time-slotted deliveries, Sunday/Holiday delivers, parcel shops & parcel lockers, etc. We believe that Blue Dart is well positioned to ride the new wave of growth in e-commerce which will contribute in the company’s growth in the coming years.
Unparalleled Integrated Air and Ground Pan-India Network
Infrastructure plays a vital role for any player in the express logistics and Blue
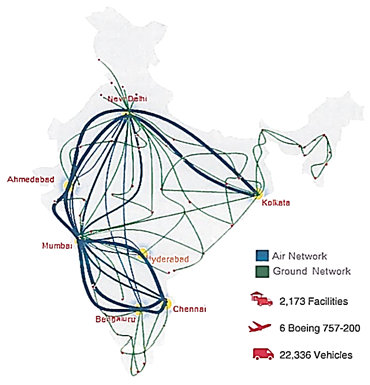
Dart has a mammoth infrastructure. It has an extensive network and offers deliveries
of consignments to more than 35,000 locations across India. Further, as a part of
DP DHL group, the company accesses the largest and most comprehensive express and
logistics network, covering more than 220 countries and territories. Blue Dart operates
its own fleet of six Boeing 757-200 freighter aircrafts (has seven hubs in all the
major metropolitan cities – Chennai, Bengaluru, Hyderabad, Mumbai, Ahmedabad,
Delhi, and Kolkata), a flotilla of 22,336 vehicles and has 2,173 facilities/hubs/offices
across India. It covers 14,400 pin codes to cater to 98% of India’s business
needs. The company’s network gives it a competitive edge over existing domestic
players as well as new entrants in the industry.
Consistent and Sustainable Volume Growth
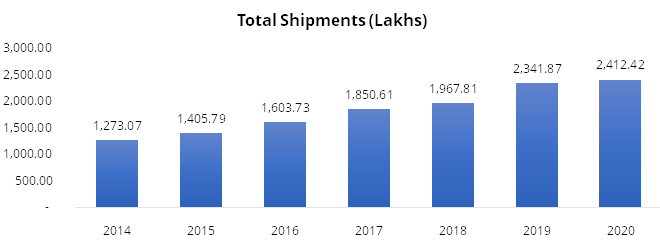
Growth in volume becomes important for any courier company as majority of the costs
are fixed in nature. Therefore, growth in volumes indicate growing revenue as well
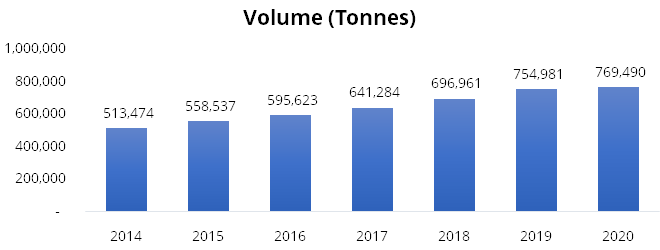
higher operating margins backed by higher operating leverage. Blue Dart’s
volume has witnessed a healthy growth in last 5-6 years and posted a CAGR of ~7%
from FY14 – FY20. Its operating revenue has grown at a CAGR of ~8% between
FY14 – FY21 and operating margins have stood at 20.9% in FY21 compared to
8.9% in FY14.
Blue Dart operates through its B2B and B2C segments. The company has built a strong B2B customer base across diverse industries such as BFSI, pharmaceuticals, medical equipment, consumer electronics, automotive, e-commerce, etc. The growth in economy leads to growth in spending and consumption and logistics facilitates in getting products and services as and when they are needed and desired to the customer. Also, it aids in economic transactions, serving as a major enabler of growth of trade and commerce in an economy. The strong customer base, along with other macro-economic factors such as GDP growth, Indian Government’s ambition of USD 5 trillion economy, infrastructure development, growth in consumption, amongst others, is expected to aid in Blue Dart’s volume growth in medium-to-long term.
Source: Company Annual Reports
Source: Company Annual Reports
Superior Technology Advantage
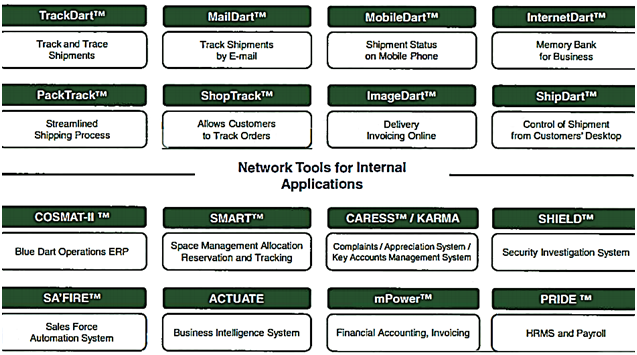
Blue Dart, since its inception, has maintained its technology leadership and continues
to invest in infrastructure to create differentiated delivery capabilities, quality
service, and customised solutions for the customers. The state-of-the-art technology
such as Weight Dimension Labelling (WDL) for accurate weight measurement and billing,
Hand Held Device for speedy delivery information, GPS for real-time shipment visibility
and Smart Truck for Intelligent pick-up and delivery, help the company to ensure
speed, safety, and accuracy. This is important in a business where majority of the
customers belong to the institutional segment and high value shipments are handled.
The company has developed tools, which provide inputs to improve operational efficiency and provide customers with seamless information about their shipments. Recently, the company has launched ‘My Blue Dart App’ which is designed to provide tailored solutions and acts as a one-stop-shop for customers; the app emphasises the company’s commitment to enhance customer experience. The technology-led disruptions will continue to test the business models in the express cargo industry and Blue Dart’s ability to continue to innovate and meet the evolving customer requirements is expected remain key over the long term.
Source: Investor Presentation
Strong Parentage
Global logistics sector is consolidated with top 3-4 players accounting for more
than 50% of total industry revenue and Deutsche Post DHL (DP DHL) is the second-largest
player in revenue terms as of 2019 (Source: Statista). DP DHL’s global
network spans more than 220 countries and territories in which ~1,11,000 employees
provide services to around 2.7 million customers. For Blue Dart, DP DHL brings in
best international practices, transparency, and good corporate governance. Blue
Dart has 48%-49% market share in domestic air express. As part of the DP DHL Group,
the company accesses the largest and most comprehensive express and logistics network
around the world, covering over 220 countries and territories and offers an entire
spectrum of logistics solutions.
Outlook & valuation
Blue Dart is South Asia’s premier express and integrated transportation and distribution company having a mammoth infrastructure/network with its own fleet of six Boeing 757-200 freighter aircrafts, a flotilla of 22,336 vehicles and has 2,173 facilities/hubs/offices across India, which gives it a competitive edge over existing domestic players and new entrants. The company is witnessing volume growth and the momentum is expected to continue further on account its strong customer base across various industries such as e-commerce, BFSI, pharmaceuticals, consumer electronics, etc. along with other factors such as GDP growth, Indian Government’s ambition to reach USD 5 trillion economy, infrastructure development, growth in consumption, amongst others.
Further, it also undertakes price increase by considering inflation, currency dynamics, fuel cost fluctuations and other regulatory and mandatory costs. Effective January 2021, it has announced General Price Increase (GPI) of 9.6% compared to 2020, which could aid in revenue growth. Further, in the express cargo industry, technology-led disruptions will continue to test the business models and Blue Dart’s ability to continue to innovate and meet the evolving customer requirements is expected to remain key over the long term. At the current market price, the stock is trading at 41.3x of FY23E earnings.
Financial Statement
Profit & Loss statement
| Year End March (Rs. in Crores) | 2019 | 2020 | 2021 | 2022E | 2023E |
|---|---|---|---|---|---|
| Net Sales | 3174.40 | 3175.13 | 3288.13 | 3799.40 | 4179.31 |
| Expenditure | |||||
| Material Cost | - | - | - | - | - |
| Employee Cost | 698.36 | 733.53 | 729.03 | 780.00 | 834.00 |
| Other Expenses | 2192.10 | 1967.68 | 1872.81 | 2188.46 | 2407.28 |
| EBITDA | 283.94 | 473.92 | 686.29 | 830.95 | 938.03 |
| EBITDA Margin | 8.94% | 14.93% | 20.87% | 21.87% | 22.44% |
| Depreciation & Amortization | 127.89 | 347.33 | 430.00 | 474.00 | 504.00 |
| EBIT | 156.05 | 126.59 | 256.29 | 356.95 | 434.03 |
| EBIT Margin % | 4.92% | 3.99% | 7.79% | 9.39% | 10.39% |
| Other Income | 20.75 | 15.78 | 20.30 | 19.00 | 19.00 |
| Interest & Finance Charges | 42.66 | 117.38 | 110.95 | 48.75 | 23.75 |
| Profit Before Tax - Before Exceptional | 134.14 | 24.99 | 165.64 | 327.20 | 429.28 |
| Profit Before Tax | 134.14 | -39.12 | 139.79 | 327.20 | 429.28 |
| Tax Expense | 44.38 | 2.74 | 37.98 | 88.34 | 115.90 |
| Exceptional Items | - | -64.11 | -25.85 | - | - |
| Net Profit | 89.76 | -41.86 | 101.81 | 238.85 | 313.37 |
| Net Profit Margin | 2.83% | -1.32% | 3.10% | 6.29% | 7.50% |
| Consolidated Net Profit | 89.76 | -41.86 | 101.81 | 238.85 | 313.37 |
| Net Profit Margin after MI | 2.83% | -1.32% | 3.10% | 6.29% | 7.50% |
Balance Sheet
| Year End March (Rs. in Crores) | 2019 | 2020 | 2021 | 2022E | 2023E |
|---|---|---|---|---|---|
| Share Capital | 23.76 | 23.76 | 23.76 | 23.76 | 23.76 |
| Total Reserves | 553.96 | 467.07 | 568.20 | 771.23 | 1048.56 |
| Shareholders' Funds | 577.72 | 490.83 | 591.96 | 794.99 | 1072.32 |
| Non Current Liabilities | |||||
| Long Term Borrowing | 425.00 | 410.00 | 245.00 | 145.00 | 45.00 |
| Deferred Tax Assets / Liabilities | -51.32 | - | - | - | - |
| Long Term Provisions | 743.06 | 22.91 | 17.94 | 17.94 | 17.94 |
| Current Liabilities | |||||
| Short Term Borrowings | 71.18 | - | - | - | - |
| Trade Payables | 434.25 | 401.03 | 509.41 | 524.28 | 590.21 |
| Other Current Liabilities | 189.45 | 413.87 | 646.66 | 646.66 | 646.66 |
| Short Term Provisions | 91.77 | 128.61 | 134.50 | 134.50 | 134.50 |
| Total Equity & Liabilities | 2487.70 | 2640.79 | 2897.43 | 3015.33 | 3258.59 |
| Assets | |||||
| Net Block | 654.36 | 1664.98 | 1583.18 | 1409.18 | 1205.18 |
| Non Current Investments | - | - | - | - | - |
| Long Term Loans & Advances | 846.32 | 230.37 | 219.54 | 219.54 | 219.54 |
| Current Assets | |||||
| Currents Investments | - | - | 150.07 | 150.07 | 150.07 |
| Inventories | 26.01 | 26.99 | 31.78 | 32.04 | 36.07 |
| Sundry Debtors | 491.02 | 528.23 | 517.92 | 582.54 | 655.78 |
| Cash and Bank | 268.71 | 100.00 | 310.52 | 537.54 | 907.52 |
| Short Term Loans and Advances | 19.99 | 33.82 | 32.36 | 32.36 | 32.36 |
| Total Assets | 2487.70 | 2640.79 | 2897.43 | 3015.33 | 3258.59 |