Birlasoft Ltd
IT - Software Services
Birlasoft Ltd
IT - Software Services
Stock Info
Shareholding Pattern
Price performance
Indexed Stock Performance
Increased spending on Digital & Cloud to aid in overall growth of the company
Company Profile:
Birlasoft Ltd. (BSOFT) was incorporated in 1990 as part of CK Birla Group, one of
India’s premier commercial and industrial houses. BSOFT combines the power
of domain, enterprise, and digital technologies to re-imagine business processes
for customers and their ecosystem. It offers IT services worldwide from development
centers in India and Australia. BSOFT and KPIT’s IT services business has
merged to form a leading publicly listed Enterprise, Digital, and IT Services company.

Consolidated Financial Statements
| Rs in Cr | Net Sales | EBITDA | EBITDAM | PAT | EPS | ROE | P/E | EV/EBITDA |
|---|---|---|---|---|---|---|---|---|
| FY19 | 3942.30 | 453.60 | 11.50% | 289.50 | 10.30 | 16.90% | 9.30 | 4.90 |
| FY20 | 3291.00 | 390.20 | 11.90% | 224.30 | 8.10 | 11.90% | 7.50 | 2.60 |
| FY21 | 3555.70 | 518.20 | 14.60% | 320.80 | 11.60 | 14.70% | 21.90 | 11.40 |
| FY22E | 4125.00 | 684.80 | 16.60% | 468.60 | 16.90 | 18.50% | 29.90 | 19.50 |
| FY23E | 4908.80 | 854.10 | 17.40% | 586.20 | 21.10 | 19.50% | 23.90 | 15.30 |
Investment Rationale
Focus on annuity business & new deal wins to drive growth:
The company has consistently focused on sustainable and profitable growth. Consistent
focus on mining existing clients, rationalize the client base, focus on large deals
benefitted the company to bring in more consistency in business. BSOFT has significantly
improved its annuity revenues from 60% in FY20 to 70% in FY21. The company continued
to maintain its annuity based revenue contribution at 71% during Q2FY22 and expects
to maintain the same at 70% by the end of FY22. Going forward, it is expected that
the company will continue to improve annuity revenues, and focus on niche verticals.
The company expects the net new deal win momentum to improve as travel restrictions
in US and Europe eased out. This coupled with BSOFT’s focus on client mining,
expansion in Europe & APAC, improving growth in top 30 accounts, healthy deal
pipeline, increase in deal sizes, project ramp ups, and focused ERP channel sales
bode well for revenue growth in coming years.

Significant traction in digital and cloud business:
BSOFT significantly improved its growth in Digital and Cloud business (60% of revenues).
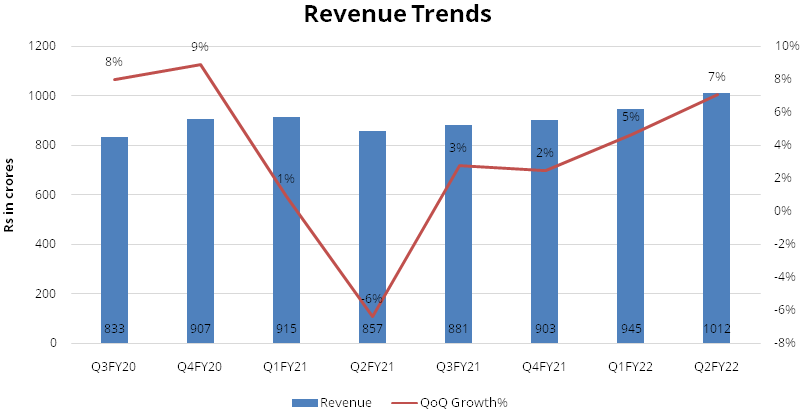
It reported revenues of USD 81 million in Q2FY22 against USD 55 million in Q4FY19.
Digital and cloud business started showing traction in FY22. In H1FY22, “Business
Transformation service” reported 26% YoY growth and “Cloud services”
reported 26.5% YoY growth. BSOFT is well positioned to leverage the opportunity
of digitization of services at much faster pace.
Well-placed to capitalize on opportunities in the Enterprise digital place:
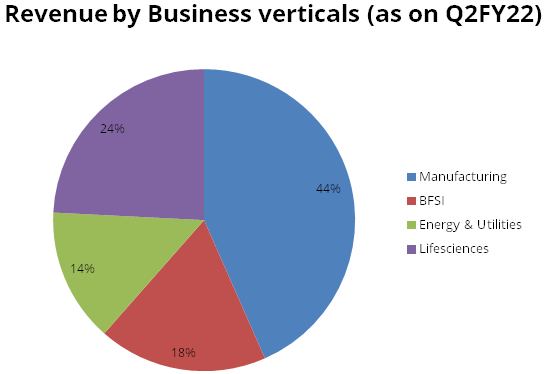
BSOFT generated 41% of revenues from enterprise solutions business during Q2FY22.
BSOFT has built unique and strong capabilities by combining enterprise applications
with the most modern platforms, software and digitization processes. Further, the
company’s alliances with key platform players and OEMs such as Microsoft,
Google, SAP, Oracle, JD Edwards, Salesforce.com, ServiceNow helps the company to
provide services to its customers with a broader range of solutions and participate
in enterprises’ digital transformation journey. Only 10-15% of total SAP installations
(30,000-35,000) across the globe have moved to cloud. This indicates huge growth
opportunity for IT service providers The Company’s strong relationships with
SAP and Oracle would help it to participate in enterprises’ cloud migration
journey as both SAP and Oracle are focusing aggressively on Cloud. Further, the
company partnered with Microsoft to scale its current Microsoft channel business
to $100 million in the next 2-3 years from current level of $23-$25 million.
Rationalizing long tail of clients:
With focus on mining existing large clients, BSOFT also continues to focus on rationalizing
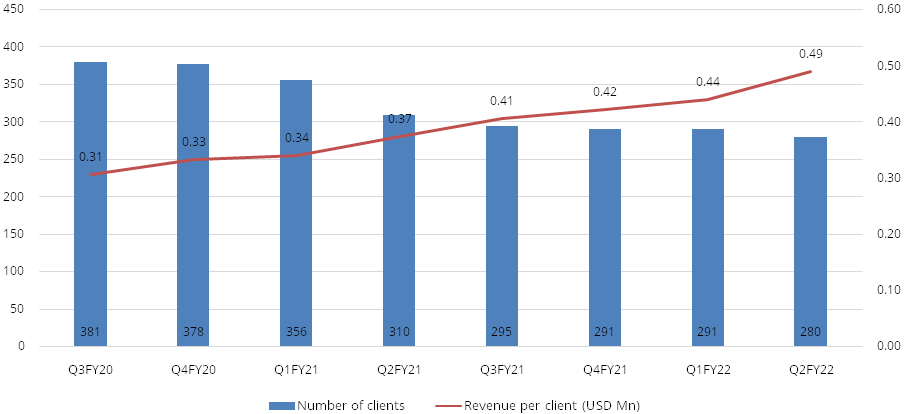
the long tail of clients. The company reduced number of active clients to 280 in
Q2FY22 as compared to 400 in FY19. The management is still looking to become leaner
to re-prioritize resources towards building deeper relations with clients and earning
higher margins.

Margins to remain sustainable going forward:
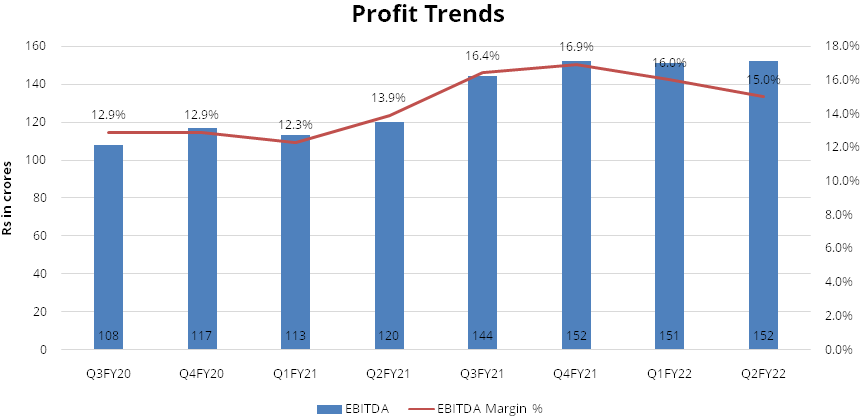
BSOFT missed its Q2FY22 margin guidance slightly as attrition spiked to 24% and
travel restrictions continued, leading to higher subcontracting costs (16% of revenue).
Employee additions (net) were steady for the last three quarters, averaging ~555.
It expects wage pressure and attrition to start easing by Q4FY22. The management
expects margins to improve and stabilize at 16% for FY22 (EBITDA margins for Q2FY22
– 15%) despite wage hike in Q2FY22 on the back of higher revenue growth, higher
off-shoring and cost optimization measures. The management expects EBITDA margins
to be at ~18% by FY2025 and subsequently EBIT margins will stand at ~16% (13% in
Q2FY22), led by moderation in subcontractor expenses, pyramid management, strong
growth in enterprise business and higher offshoring.

Focusing on building strong global partnership:
BSOFT has strong global partnership in the ERP space and now are focusing on building
partnership in the digital & cloud space. They have already tied-up with Mircosoft,
AWS, and now aiming towards engaging with Google which will make them technology
agnostic for clients. Recently, they partnered with Freshworks, where BSOFT is committed
to bring digital-first solutions to clients to expand business capabilities and
improve the end user-experience. The company has basket of solutions which they
have developed over the years to capture growth in the digital and cloud space.
Change in leadership and incentive structure:
In 2020, BSOFT promoted Mr Dharmendra Kapoor as the company CEO who served as COO
of BSOFT. Under him, the company started focusing more on cross-selling and annuity
based business to bring in sustainable and profitable growth. Over the last two
years, BOSFT has focused on hiring talents from tier-1 companies such as IBM, Accenture,
and Infosys. Also, the company changed its incentive structure to incentivize meritocracy
and make the organization more effective & agile. The incentive structure has
led to new deal wins from existing clients along with renewal of deals.
BSOFT aims to reach $1 billion revenue by 2025
The management aspires to reach $1billion annual revenues by FY2025 against current
annual revenue run-rate of $548 million. Of the targeted $1 billion revenue, $800-850
million would come from organic and the rest from inorganic activity ($150-200 million).
This also indicates that organic/overall revenue growth would remain strong, clocking
a 16%/22% CAGR over next four years. Management believes that the strong revenue
growth would be driven by strong deal intake, addition of new clients, acceleration
of cross selling, higher annuity revenue, strong strategic partnership and alliances
and building capabilities around macro services in its targeted verticals.
Strong industry tailwinds:
An accelerated shift to cloud and increased spending on digital technologies such
as cloud, artificial intelligence (AI), machine learning, data and analytics, cyber-security,
collaboration tools, and engineering post COVID are expected to drive demand for
IT services going ahead. Enterprises across the globe are now using these new-age
technologies to enhance digital experience, reduce costs, increase efficiencies,
and create greater operating resilience and agility within the organization. Most
large global companies are shifting technology investments from capital expenditure
to operating expenses as it would provide scalability. According to Gartner, IT
services and enterprise software spending are likely to remain strong, clocking
CAGR of 9.1% and 12%, respectively over FY20-FY25, which will be significantly higher
than the average growth during the last decade.
Outlook & valuation
Global demand for IT services is experiencing huge tailwind backed by increased spending on Cloud and Digital. BSOFT has transformed its business significantly from enterprise business to enterprise digital solutions in the last few years. The company management aspires to clock $ 1 billion in annual revenues by FY25. It expects growth to pick up in FY23 led by higher spends on legacy modernization by clients, strong partnerships with hyper-scalers and closure of multiple transformative deals. Based on our estimates, the stock is currently trading at 24x FY23E earnings and we initiate our coverage on BSOFT with a ‘BUY’ rating.
Financial Statement
Profit & Loss statement
| Yr End March (Rs Cr) | 2019 | 2020 | 2021 | 2022E | 2023E |
|---|---|---|---|---|---|
| Net Sales | 3942.30 | 3291.00 | 3555.70 | 4125.00 | 4908.80 |
| Growth % | 7.60% | -16.50% | 8.00% | 16.00% | 19.00% |
| Expenditure | |||||
| Material Cost | 7.60 | - | - | - | - |
| Employee Cost | 2433.50 | 1997.50 | 2115.80 | 2516.30 | 2994.30 |
| Other Expenses | 1047.60 | 903.20 | 921.70 | 924.00 | 1060.30 |
| EBITDA | 453.60 | 390.20 | 518.20 | 684.80 | 854.10 |
| Growth % | 19.80% | -14.00% | 32.80% | 32.10% | 24.70% |
| EBITDA Margin | 11.50% | 11.90% | 14.60% | 16.60% | 17.40% |
| Depreciation & Amortization | 105.50 | 82.60 | 80.40 | 88.70 | 99.20 |
| EBIT | 348.00 | 307.60 | 437.80 | 596.10 | 755.00 |
| EBIT Margin % | 8.80% | 9.30% | 12.30% | 14.50% | 15.40% |
| Other Income | 40.40 | 44.70 | 30.00 | 30.10 | 28.40 |
| Interest & Finance Charges | 18.90 | 16.10 | 13.00 | - | - |
| Profit Before Tax - Before Exceptional | 369.50 | 336.20 | 454.80 | 626.20 | 783.40 |
| Profit Before Tax | 387.10 | 336.20 | 454.80 | 626.20 | 783.40 |
| Tax Expense | 85.20 | 111.90 | 134.00 | 157.60 | 197.20 |
| Effective Tax rate | 22.00% | 33.30% | 29.50% | 25.20% | 25.20% |
| Exceptional Items | 17.60 | - | - | - | - |
| Net Profit | 301.90 | 224.30 | 320.80 | 468.60 | 586.20 |
| Growth % | 15.40% | -25.70% | 43.00% | 46.10% | 25.10% |
| Net Profit Margin | 7.70% | 6.80% | 9.00% | 11.40% | 11.90% |
| Consolidated Net Profit | 289.50 | 224.30 | 320.80 | 468.60 | 586.20 |
| Growth % | 14.50% | -22.50% | 43.00% | 46.10% | 25.10% |
| Net Profit Margin after MI | 7.30% | 6.80% | 9.00% | 11.40% | 11.90% |
Balance Sheet
| Yr End March (Rs Cr) | 2019 | 2020 | 2021 | 2022E | 2023E |
|---|---|---|---|---|---|
| Share Capital | 54.80 | 55.30 | 55.50 | 55.50 | 55.50 |
| Total Reserves | 1622.60 | 1837.10 | 2124.40 | 2482.10 | 2957.40 |
| Shareholders' Funds | 1713.50 | 1892.40 | 2179.90 | 2537.60 | 3012.90 |
| Minority Interest | - | - | - | - | - |
| Non Current Liabilities | |||||
| Long Term Burrowing | - | - | - | - | - |
| Deferred Tax Assets / Liabilities | -143.30 | -120.00 | -88.20 | -88.20 | -88.20 |
| Long Term Provisions | 63.70 | 69.50 | 80.30 | 70.00 | 70.00 |
| Current Liabilities | |||||
| Short Term Borrowings | 38.10 | - | - | - | - |
| Trade Payables | 214.80 | 190.40 | 131.80 | 178.90 | 210.40 |
| Other Current Liabilities | 404.20 | 343.20 | 423.40 | 423.40 | 423.40 |
| Short Term Provisions | 57.30 | 77.80 | 79.20 | 79.20 | 79.20 |
| Total Equity & Liabilities | 2354.30 | 2567.30 | 2906.20 | 3280.90 | 3787.70 |
| Assets | |||||
| Net Block | 588.10 | 751.00 | 698.20 | 745.50 | 806.30 |
| Non Current Investments | - | - | - | - | - |
| Long Term Loans & Advances | 81.60 | 110.60 | 56.90 | 56.90 | 56.90 |
| Current Assets | |||||
| Currents Investments | 190.90 | 33.00 | 55.30 | 69.30 | 69.30 |
| Inventories | - | - | - | - | - |
| Sundry Debtors | 710.70 | 740.20 | 518.20 | 683.90 | 804.40 |
| Cash and Bank | 377.20 | 630.10 | 1043.00 | 1176.70 | 1502.20 |
| Short Term Loans and Advances | 51.30 | 120.80 | 144.90 | 144.90 | 144.90 |
| Total Assets | 2354.30 | 2567.30 | 2906.20 | 3280.90 | 3787.70 |
Cash Flow Statement
| Yr End March (Rs Cr) | 2019 | 2020 | 2021 | 2022E | 2023E |
|---|---|---|---|---|---|
| Profit After Tax | 301.90 | 224.30 | 320.80 | 468.60 | 586.20 |
| Depreciation | 105.50 | 82.60 | 80.40 | 88.70 | 99.20 |
| Changes in Working Capital | -537.00 | -91.00 | 84.50 | -118.60 | -89.00 |
| Cash From Operating Activities | -71.60 | 309.90 | 557.80 | 438.70 | 596.40 |
| Purchase of Fixed Assets | -89.80 | -54.40 | -24.90 | -120.00 | -160.00 |
| Free Cash Flows | -161.40 | 255.60 | 533.00 | 318.70 | 436.40 |
| Cash Flow from Investing Activities | 124.80 | -43.80 | -444.40 | -120.00 | -160.00 |
| Increase / (Decrease) in Loan Funds | -8.90 | - | - | - | - |
| Equity Dividend Paid | -55.40 | -99.60 | -55.40 | -110.90 | -110.90 |
| Cash from Financing Activities | -116.20 | -179.70 | -96.90 | -110.90 | -110.90 |
| Net Cash Inflow / Outflow | -62.90 | 86.50 | 16.50 | 207.80 | 325.50 |
| Opening Cash & Cash Equivalents | 465.10 | 361.70 | 449.60 | 466.10 | 673.90 |
| Closing Cash & Cash Equivalent | 361.70 | 449.60 | 466.10 | 673.90 | 999.40 |
Key Ratios
| Yr End March | 2019 | 2020 | 2021 | 2022E | 2023E |
|---|---|---|---|---|---|
| Basic EPS | 10.30 | 8.10 | 11.60 | 16.90 | 21.10 |
| Diluted EPS | 10.30 | 8.10 | 11.60 | 16.90 | 21.10 |
| Cash EPS (Rs) | 14.10 | 11.10 | 14.50 | 20.10 | 24.70 |
| DPS | 2.00 | 2.00 | 3.50 | 4.00 | 4.00 |
| Book value (Rs/share) | 61.20 | 68.40 | 78.60 | 91.50 | 108.70 |
| ROCE (%) Post Tax | 15.70% | 12.90% | 16.20% | 19.90% | 21.10% |
| ROE (%) | 16.90% | 11.90% | 14.70% | 18.50% | 19.50% |
| Inventory Days | 1.10 | - | - | - | - |
| Receivable Days | 70.20 | 80.50 | 64.60 | 65.00 | 65.00 |
| Payable Days | 17.30 | 22.50 | 16.50 | 17.00 | 17.00 |
| PE | 9.30 | 7.50 | 21.90 | 29.90 | 23.90 |
| P/BV | 1.60 | 0.90 | 3.20 | 5.50 | 4.70 |
| EV/EBITDA | 4.90 | 2.60 | 11.40 | 19.50 | 15.30 |
| Dividend Yield (%) | 2.00% | 3.30% | 1.40% | 0.80% | 0.80% |
| P/Sales | 0.70 | 0.50 | 2.00 | 3.40 | 2.90 |
| Net debt/Equity | - | - | - | - | - |
| Net Debt/ EBITDA | -1.20 | -1.70 | -2.10 | -1.00 | -1.20 |
| Sales/Net FA (x) | 5.60 | 4.90 | 4.90 | 5.70 | 6.30 |