
Bajaj Finance Ltd
Finance - NBFC
Bajaj Finance Ltd
Finance - NBFC
Stock Info
Shareholding Pattern
Price performance
Indexed Stock Performance
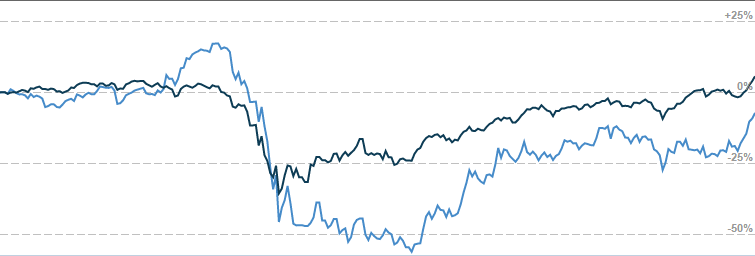
Long term growth story intact supported by robust growth
Company Profile
Set up in 1987, Bajaj Finance Limited (BFL) is a subsidiary of Bajaj Finserv (52.7%
ownership), the financial services arm of the Bajaj group. Bajaj Finance has a diversified
product suite comprising of key businesses such as vehicle loans, consumer durable
loans, personal loans, mortgage loans, small business loans, loans against securities,
commercial finance, and rural finance. Bajaj Finance is the largest financier of
2-wheelers and consumer durables in India.
BFL is present in 2641 locations across the country, including 1507 locations in rural/smaller towns and villages. It has two 100% subsidiaries: (i) Bajaj Housing Finance Ltd. (‘BHFL’), which is registered with National Housing Bank as a Housing Finance Company (HFC); and (ii) Bajaj Financial Securities Ltd. (‘Bfinsec’), which is registered with the Securities and Exchange Board of India (SEBI).
Investment Rationale
Strong market presence in the Indian retail finance operations
Bajaj Finance has emerged as one of the largest retail asset financing NBFCs in
India and continues with its two-pronged strategy of building scale and maximising
profit. The company has demonstrated track record of profitable growth with segments
such as mortgages, small business loans, and commercial lending through building
scale, while consumer durable loans, personal loans, and 2- and 3-wheeler financing
are focused on maximising profit.
Consistent Growth in Consumer Finance Business
The company is amongst the largest personal loan lenders in India and continued
to be the dominant lender for consumer electronics, furniture and digital products.
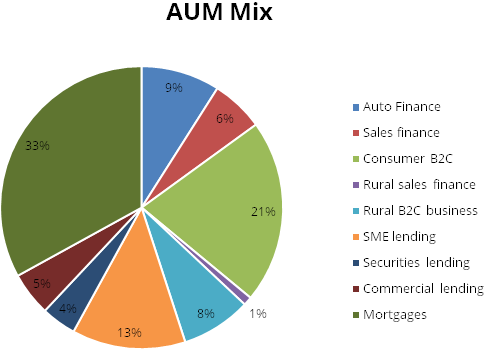
Consumer financing business constitutes 36% of the Loan book as on September 2020.
The company’s growth has been sustained by an expanding distribution reach,
innovative credit outreach and cross-selling opportunities. The company also extended
its loan offerings in the healthcare segment by introducing a ‘Healthcare
EMI Card’
SME financing form sustainable scale builders while partnerships drive granular
fee income
SME financing and commercial lending now comprise 13% and 9% of consolidated AUM
respectively as on September 2020. It launched used-car financing and small-ticket
secured SME loans in FY19. The Company’s co-branded credit cards business
in partnership with RBL Bank continued to grow in a robust manner and its co-branded
credit cards stood at 1.87 million cards-in-force (CIF). The company’s co-branded
wallet business in partnership with Mobikwik continued to grow by offering EMI cards
in digital format and it had 16.8 million users as on September 2020. Both partnerships
augur well to generate granular and sticky fee income.
Focus on Analytics & technology modernisation
Productivity has increased due to the effective use of technology and analytics.
The company has invested deeply in data analytics, machine learning models and artificial
intelligence (AI) to better service customers and drive the business. Facial recognition
technology has been deployed in offices and some branches on pilot basis, with the
aim of providing a differentiated and frictionless customer service experience.
Outlook & Valuation
We expect the company to capitalize on growth opportunities supported by healthy capitalization, surplus liquidity on its balance sheet and resilient asset quality. Further we expect the company to invest in distribution & expand its geographic footprint and it has multiple levers to reduce cost, given its multiple product lines. Further disbursements have been picking up gradually month on month which will enable stable earnings growth going forward. Thus, we initiate our coverage on Bajaj Finance with a Buy Rating.
Consolidated Financial Statements
| Rs in Cr | NII | PPOP | PAT | EPS | ROE | BV |
|---|---|---|---|---|---|---|
| FY18 | 6889.00 | 4874.00 | 2496.00 | 43.00 | 19.68% | 274.10 |
| FY19 | 9626.00 | 7681.00 | 3995.00 | 69.00 | 22.60% | 339.10 |
| FY20 | 13363.00 | 11252.00 | 5264.00 | 88.00 | 20.30% | 535.30 |
| FY21E | 14330.00 | 11936.00 | 4462.00 | 74.00 | 13.10% | 607.00 |
| FY22E | 16722.00 | 14543.00 | 7854.00 | 130.00 | 20.80% | 719.00 |
| FY23E | 20575.00 | 17726.00 | 9712.00 | 161.00 | 19.70% | 875.00 |
Investment Rationale
Strong market presence in the Indian retail finance operations
Bajaj Finance has emerged as one of the largest retail asset financing NBFCs in
India and continues with its two-pronged strategy of building scale and maximising
profit. The company has demonstrated track record of profitable growth with segments
such as mortgages, small business loans, and commercial lending which are focused
on building scale, while consumer durable loans, personal loans, and 2- and 3-wheeler
financing are focused on maximising profit.
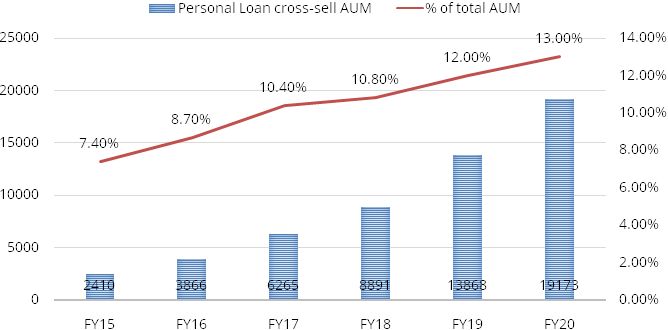
The Company’s loan book continued to remain strong as a result of its deeply embedded risk culture and robust risk management practices. Over FY2015-20, the company posted an AUM CAGR of ~35% and this growth has been broad-based spread across various product segments. Further the company’s robust growth has been supported by large cross sell opportunity, product innovation, increasing geographical penetration (2,641 locations, distribution network consisting of 1,14,000+ points), customer acquisition and focus on existing customers. We believe the company ensures lower credit risk across portfolios by creating larger cross-sell opportunities and this strong cross-sell momentum is generated through a combination of a large franchise of mass affluent customers and multiple product offerings coupled with superior customer experience.
Exhibit 1: Personal Loan Cross sell AUM book
Consistent growth in Consumer finance business
The company is amongst the largest personal loan lenders in India and continued
to be the dominant lender for consumer electronics, furniture and digital products.
The company’s product offering consists of consumer durable loans, lifestyle
product loans, digital product loans, EMI cards, personal loans, retail spend financing,
e-commerce consumer finance and life care financing. Consumer financing business
constitutes 36% of the loan book as on September 2020. The company’s growth
has been sustained by an expanding distribution reach, innovative credit outreach
and cross-selling opportunities. The company was also the largest financier of Bajaj
Auto motorcycles and three-wheelers in FY20 (it financed purchase of 1.1 million
motorcycles in FY20).
As part of its product expansion strategy, the company also extended its loan offerings in the healthcare segment & also introduced a ‘Healthcare EMI Card’ thus facilitating hassle-free processing of loans to customers. This initiative has resulted in health care offerings contributing over 19% of lifestyle finance business. Personal loans cross-sell (PLCS) (To cross-sell is to sell related or complementary products to an existing customer) and salaried personal loans AUM posted robust growth which was fuelled by growing customer franchise, investment in the effective use of advanced analytical capabilities, robust risk management and customer-centric loan processing capabilities. The company has been financing EMI card customers on e-commerce platforms for their various purchases and it has become a strategic business in the last 2-3 years. Further the company also expanded its online relationships from 19 to 33 partners in FY20.
Exhibit 2: AUM mix as on September 2020
SME financing & Partnerships business shall drive growth
SME financing and commercial lending now comprise 13% and 9% of consolidated AUM
respectively as on September 2020. SME lending includes secured and unsecured loans
to its customers. Unsecured lending is done through two product offerings: (i) business
loans to small and medium enterprises and to self-employed persons, and (ii) professional
loans. The company has launched two new products in the SME lending business in
FY19, namely used car financing and secured enterprise loans. Commercial lending
comprises of six products: loan against securities, loans to financial institution
group lending (These clients are typically financial institutions which include
banks, insurance companies, technology companies, specialty finance, and asset management
firms), working and growth capital loans to auto component manufacturers, loans
to light engineering industry and loans to speciality chemical industry verticals.
The company offers various products to its customers in partnership with various financial service providers such as life insurance, health insurance, extended warranty, comprehensive asset care, co-branded credit card, co-branded wallets and financial fitness reports. The company’s co-branded credit cards business in partnership with RBL Bank continued to grow in a robust manner and its co-branded credit cards stood at 18.7 lakhs cards-in-force (CIF) as on September 2020. The company’s co-branded wallet business in partnership with Mobikwik continued to grow by offering EMI cards in digital format and it had 16.8 million users as on September 2020. Both partnerships augur well to generate granular and sticky fee income.
Consistent high growth due to expansive distribution channel
The Company has not only diversified risk across millions of customers and product
categories but has also diversified its risk and portfolio in about 2,641 urban
and rural locations in India. We believe that the company’s geographically
distributed portfolio aids in decreasing concentration risks to the minimal. Further
we believe that one of the major reasons behind the consistent growth in AUM is
continuous expansion in distribution channel, Consumer businesses are tough to grow
and ordinarily have strong entry barriers as they require a significant support
from a distribution standpoint. Competition has remained benign for the company
despite the company consistently delivering highly profitable growth (which should
ideally attract competition) mainly due to high upfront investments in distribution,
technology and processes to compete in the relatively low-ticket size, high volume
business.
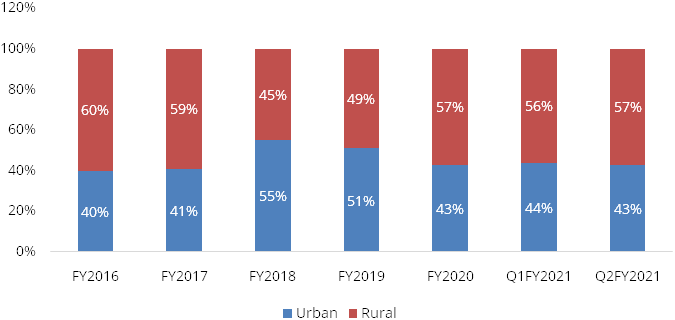
As of Q2FY21, the overall distribution network stood at 114,400+ touch points, almost 3x over the last three years. Over FY13-FY19, the company expanded its distribution network at 34-63% annually. However, it slowed down to 25% in FY20.
The rural-lending vertical was launched in 2014 with 7 branches to start with in Maharashtra. Incrementally, the company has equally focused on scaling up the rural presence, whereby the current rural presence is 43% of the total branch mix.
Exhibit 3: Branch mix (%)
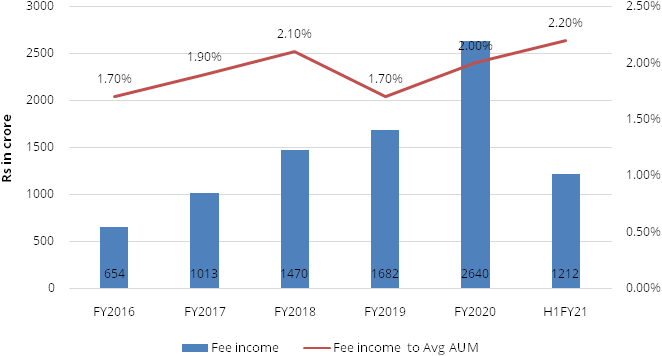
Major focus on fee income generation
The company has been pioneer in delivering industry-leading NIMs on a sustainable
basis. Moreover, the company has equivalent focus on augmenting profitability through
fee income generation. The company’s major part of the fee income is earned
through distribution income and other activities which are not in co-relation to
the asset growth. Generally, we believe a fee income growth which is not co-related
with the balance sheet growth is more sustainable in nature and can camouflage for
weak asset growth during tough times. The company has a superior fee income generation
capability in comparison to its peers.
Distribution of insurance and other financial products, EMI cards have also aided in strengthening the fee income stream. As of Q2FY21, the EMI franchise stood at 20.6 million cards while Bajaj Finserv Mobikwik app has 16.8 million users who have linked their EMI card to wallet.
Exhibit 4: Fee Income Trends
Focus on Analytics & technology modernisation
Productivity has increased due to the effective use of technology and analytics.
The company has invested deeply in data analytics, machine learning models and artificial
intelligence (AI) to better service customers and drive the business. Facial recognition
technology, natural language processing (NLP) and optical character recognition
(OCR) have been deployed in offices and some branches, with the aim of providing
a differentiated and frictionless customer service experience. The company is planning
to launch a financial service core proprietary ecosystem by Q2FY22 with an aim to
provide an insurance mall (compare, review and buy across 800 insurance products),
broking account, mutual fund and health & wellness products – all combined
in one.
The company has been investing in an e-store which should be live soon and should enable customer origination, considering the customer trend of increasing online and digital purchases, over the past 3-4 years. Moreover, the company is looking to harmonize the offline ecosystem and help merchants with SIS (store-in-store) with a table to enable it for all of its merchant partners over a three-year horizon. Further the company has deeply invested in Application Programme Interface (API) to integrate specialised applications with customer facing interfaces like web portals, app infrastructure and BOTS on to a micro services architecture supported by platform as a service (PaaS) infrastructure.
Prudent Asset Liability management
The company’s strategy is to create a balanced mix of wholesale and retail
borrowings. It continued to prudently manage its asset liability with a strategy
of raising long-term debt and maintaining a judicious mix of borrowings between
banks, money markets, external commercial borrowings and deposits thus enabling
the company to effectively manage their NIM.
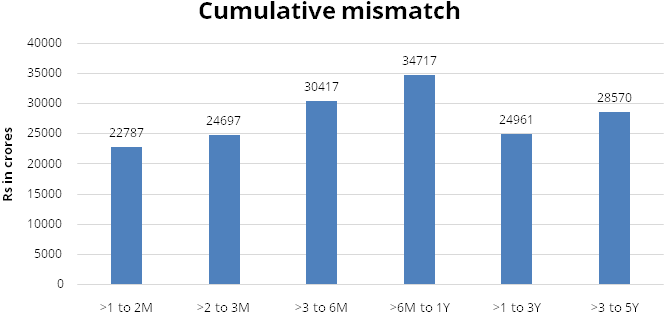
The Liquidity Coverage Ratio requirement mandates NBFCs to maintain a minimum level of high-quality liquid assets to cover expected net cash outflows in a stressed scenario. The company’s liquidity buffer management framework exceeds these requirements and demonstrates its strong orientation towards liquidity management. As on 31 March 2020, the Company had a consolidated liquidity buffer of Rs 15,725 crore which will enable to prudently manage liquidity risk.
\Exhibit 5: Cumulative Mismatch as on September 2020
Financials
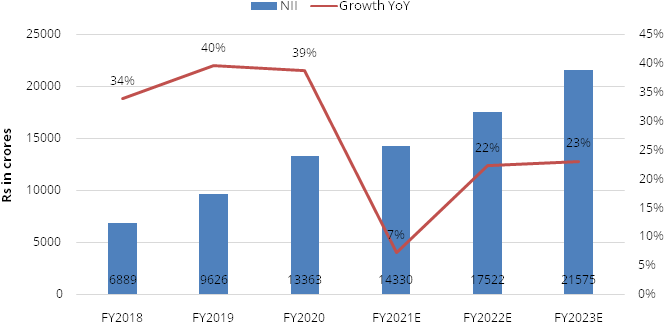
Net Interest Income expected to grow @~ 17% CAGR over FY20-FY23E
We expect Net interest income to grow @ 17% CAGR over FY20-23E supported by i) cross
sell franchise ii) better customer experience model by June 2021 which will further
strengthen its technology, data science, app design, etc. iii) acceleration in partnerships
and Card business. We have a positive outlook on the company led by credit growth
and business normalcy.
Exhibit 6: NII trends
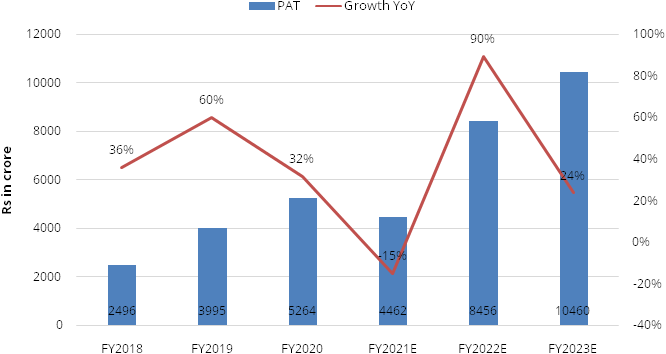
Net profit expected to grow @~26% CAGR over FY20-FY23E
We expect Net profit to grow @ 26% CAGR over FY20-23E supported by i) focus on cost
rationalisation ii) strong AUM growth and iii) comparatively lower provisions. The
business volumes are returning to normal and we believe the company intends to be
aggressive on pricing which will enable strong growth going forward.
Exhibit 7: Net profit Trends
Diversified Liability Profile
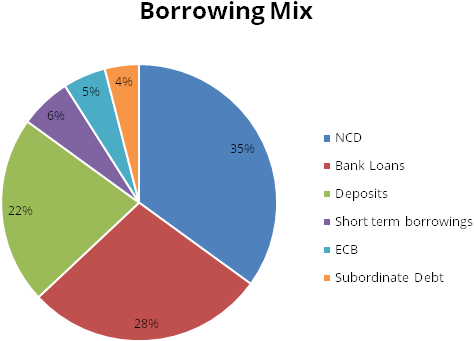
We believe the company has steadily increased its borrowings from deposits. Deposits
have increased from 8% in March 2017 to 22% in September 2020. Currently with excess
liquidity buffer, the company is able to borrow at lower interest rate, which will
lead to improvement in spreads.
Exhibit 8: Borrowing Mix as on 30 September 2020
Asset quality
We believe that the management has been quite proactive in perceiving stress and
providing for it upfront. The company’s provisioning norms have always been
more stringent than regulatory requirements and have been expedited during early
stage of delinquencies. Further we believe that company’s strategy towards
risk is a highly comprehensive one, which takes priority over growth. Additionally,
the company’s capability on risk analytics and scorecards have aided in following
the expected credit
loss (ECL) based provisioning requirement. As on 30 September 2020, the company has taken a loan loss provision of Rs 3386 crores against its credit cost estimate of Rs 6000 crore for FY21, which will enable them to provide for additional losses that may otherwise occur in FY22. Adjusted GNPA and NNPA stood at 1.34% and 0.56% respectively
Industry
The NBFC sector continued to grow its share in the financial services industry. Credit growth of scheduled commercial banks (SCBs) continued to moderate throughout FY20. On 31 March 2019, growth in advances of SCBs was 13.2%. By 30 September 2019, this had reduced to 8.7% and on 27 March 2020, it was further down to 6.1%. SCBs also continued to face asset quality challenges in FY20. Data published by the RBI in its Financial Stability Report dated 27 December 2019 show that NBFCs have outperformed SCBs on asset quality.
NBFCs play a crucial role in financial inclusion by providing last mile access to meet the diversified financial needs of less-banked customers. The sector also plays a vital role by meeting the credit needs of retail and MSME segment. Over the years, the sector has rapidly grown with a few large players becoming comparable in size to some of the private sector banks and has also witnessed advent of many non-traditional players leveraging technology to adopt tech-based innovative business models.
The primary activities of NBFCs are providing consumer credit, including consumer durable products finance, automobile finance, home finance and wholesale finance products such as bills discounting for small and medium companies and infrastructure finance, and fee-based services such as investment banking and underwriting. NBFCs mobilise resources largely from debentures and bank borrowings. The default by one large NBFC a couple of years ago has shaken the market confidence and created ripple effect over the entire sector which had resulted in drying-up bank lending, thereby forcing NBFCs to scout for alternate sources of funding. However, in 2020-21, up to September, market confidence revived and NBFCs’ borrowings from banks and FIs accelerated, buoyed by various policy measures taken by the RBI and the government to combat the impact of covid-19 pandemic.
Various segments for financing include:
Consumer Lending
This segment comprises of consumer durables, furniture and digital products in India.
Personal loans cross-sell (PLCS) (To cross-sell is to sell related or complementary
products to an existing customer). and salaried personal loans is gaining a lot
of traction and this growth was fuelled by growing customer franchise, investment
in the effective use of advanced analytical capabilities, robust risk management
and customer-centric loan processing capabilities.
SME Lending
SME lending includes secured and unsecured loans to its customers. Unsecured lending
is done through two product offerings: (i) business loans to small and medium enterprises
and to self-employed persons, and (ii) professional loans. New products in the SME
lending business consists of used car financing and secured enterprise loans.
Rural Lending
This segment caters to financial services needs of rural consumers. Rural lending
is gaining lot of traction and many companies are setting up branches in new states
and penetrating deeper in the existing states. Rural lending business also offers
fixed deposit schemes which will further widen product offerings to rural customers
and expand its retail liabilities business.
Commercial Lending
It comprises of six products: loan against securities, loans to financial institution
group lending (These clients are typically financial institutions which include
banks, insurance companies, technology companies, specialty finance, and asset management
firms), warehouse receipt financing ( finance owners of goods for own processing
against Warehouse Receipts), working and growth capital loans to auto component
manufacturers, loans to light engineering industry and loans to speciality chemical
industry verticals.
Partnerships and Services
In partnership with various financial service providers comprises the following
products to its customers: life insurance, health insurance, extended warranty,
comprehensive asset care, co-branded credit card, co-branded wallets and financial
fitness reports.
Risks & Concerns
- Deterioration in macros and company financials would enable in higher cost of funds, impacting margin/profit estimates.
- Higher slippages (than expected) and Lower growth, would impact profit and book value estimates.
Outlook & valuation
We expect the company to capitalize on growth opportunities supported by healthy capitalization, surplus liquidity on its balance sheet and resilient asset quality. Further we expect the company to invest in distribution & expand its geographic footprint and it has multiple levers to reduce cost, given its multiple product lines. Further disbursements have been picking up gradually month on month which will enable stable earnings growth going forward. Thus, we initiate our coverage on Bajaj Finance with a Buy Rating.
Financial Statement
Profit & Loss statement
| DESCRIPTION | Mar-18 | Mar-19 | Mar-20 | Mar-21E | Mar-22E | Mar-23E |
|---|---|---|---|---|---|---|
| Interest income | 11586.00 | 16349.00 | 22970.00 | 23831.00 | 29291.00 | 36782.00 |
| Interest Expense | 4696.00 | 6723.00 | 9608.00 | 9501.00 | 12570.00 | 16207.00 |
| Net Interest Income | 6889.00 | 9626.00 | 13363.00 | 14330.00 | 16722.00 | 20575.00 |
| Growth% | 34.00% | 40.00% | 39.00% | 7.00% | 17.00% | 23.00% |
| Other Income | 1213.00 | 2151.00 | 3415.00 | 2629.00 | 4109.00 | 5106.00 |
| Total Income | 8102.00 | 11778.00 | 16778.00 | 16959.00 | 20831.00 | 25681.00 |
| Total Operating Expenses | 3228.00 | 4097.00 | 5526.00 | 5023.00 | 6288.00 | 7955.00 |
| PPOP | 4874.00 | 7681.00 | 11252.00 | 11936.00 | 14543.00 | 17726.00 |
| Provisions and Contingencies | 1030.00 | 1501.00 | 3929.00 | 5974.00 | 4043.00 | 4741.00 |
| Profit Before Tax | 3843.00 | 6179.00 | 7322.00 | 5962.00 | 10500.00 | 12985.00 |
| Provision for Tax | 1347.00 | 2184.00 | 2058.00 | 1500.00 | 2646.00 | 3272.00 |
| Tax Rate% | 35.00% | 35.00% | 28.00% | 25.00% | 25.00% | 25.00% |
| Profit After Tax | 2496.00 | 3995.00 | 5264.00 | 4462.00 | 7854.00 | 9712.00 |
| Earnings Per Share | 43.00 | 69.00 | 88.00 | 74.00 | 130.00 | 161.00 |
Balance Sheet
| DESCRIPTION | Mar-18 | Mar-19 | Mar-20 | Mar-21E | Mar-22E | Mar-23E |
|---|---|---|---|---|---|---|
| EQUITY AND LIABILITIES | ||||||
| Share Capital | 115.00 | 115.00 | 120.00 | 120.00 | 120.00 | 120.00 |
| Reserves & Surplus | 15733.00 | 19582.00 | 32208.00 | 36446.00 | 43259.00 | 52671.00 |
| Deferred Tax Assets / Liabilities | -767.00 | -669.00 | -850.00 | -801.00 | -913.00 | -999.00 |
| Borrowings | 66109.00 | 101588.00 | 129806.00 | 129912.00 | 160073.00 | 183839.00 |
| Current Liabilities | 2074.00 | 2948.00 | 2257.00 | 2349.00 | 2879.00 | 3591.00 |
| Total Liabilities | 84031.00 | 123563.00 | 163541.00 | 168026.00 | 205418.00 | 239222.00 |
| ASSETS | ||||||
| Non-Current Assets | ||||||
| Net Advances | 79103.00 | 112513.00 | 141376.00 | 145995.00 | 180876.00 | 210475.00 |
| Net Block | 470.00 | 695.00 | 1321.00 | 1352.00 | 1629.00 | 2038.00 |
| Investments | 3139.00 | 8599.00 | 17544.00 | 16701.00 | 18684.00 | 21401.00 |
| Sundry Debtors | 639.00 | 809.00 | 952.00 | 1085.00 | 1279.00 | 1701.00 |
| Cash and Bank | 340.00 | 349.00 | 1383.00 | 1656.00 | 1702.00 | 2209.00 |
| Other Current Assets | 340.00 | 599.00 | 965.00 | 1237.00 | 1249.00 | 1397.00 |
| Total Assets | 84031.00 | 123563.00 | 163541.00 | 168026.00 | 205418.00 | 239222.00 |
Key Ratios
| DESCRIPTION | Mar-18 | Mar-19 | Mar-20 | Mar-21E | Mar-22E | Mar-23E |
|---|---|---|---|---|---|---|
| Growth (YoY%) | ||||||
| Borrowed funds | 46.00% | 54.00% | 28.00% | 0.00% | 23.00% | 15.00% |
| Advances | 147.00% | 42.00% | 26.00% | 3.00% | 24.00% | 16.00% |
| Total Assets | 26.00% | 47.00% | 32.00% | 3.00% | 22.00% | 16.00% |
| NII | 34.00% | 40.00% | 39.00% | 7.00% | 17.00% | 23.00% |
| Non-interest income | 21.00% | 77.00% | 59.00% | -23.00% | 56.00% | 24.00% |
| Operating expenses | 28.00% | 27.00% | 35.00% | -9.00% | 25.00% | 27.00% |
| Operating profit | 35.00% | 58.00% | 46.00% | 6.00% | 22.00% | 22.00% |
| Provisions | 28.00% | 46.00% | 162.00% | 52.00% | -32.00% | 17.00% |
| Reported PAT | 36.00% | 60.00% | 32.00% | -15.00% | 76.00% | 24.00% |
| Yield Margins (%) | ||||||
| Interest Spread | 7.80% | 7.90% | 7.90% | 7.10% | 7.70% | 7.70% |
| NIM | 9.30% | 9.30% | 9.40% | 8.70% | 9.20% | 9.10% |
| Profitability (%) | ||||||
| ROA | 3.30% | 3.80% | 3.60% | 2.60% | 4.30% | 3.80% |
| ROE | 19.68% | 22.60% | 20.30% | 13.10% | 20.80% | 19.70% |
| Valuation Ratios | ||||||
| Earnings Per Share (Rs) | 43.40 | 69.30 | 87.70 | 74.00 | 130.30 | 161.10 |
| DPS(Rs) | 4.00 | 6.00 | 10.00 | 3.70 | 14.00 | 18.00 |
| Dividend Yield(%) | 0.00 | 0.00 | 0.00 | 0.00 | 0.00 | 0.00 |
| Book Value (Rs) | 274.10 | 339.10 | 535.30 | 607.00 | 719.00 | 875.00 |
| Price / Book Value(x) | 6.50 | 8.90 | 4.10 | 8.10 | 6.90 | 5.60 |