
Bajaj Auto Ltd
Automobile Two & Three Wheelers
Bajaj Auto Ltd
Automobile Two & Three Wheelers
Stock Info
Shareholding Pattern
Price performance
Indexed Stock Performance

Established player in motorcycle segment
Company Profile
Incorporated in 1945, Bajaj Auto is a part of Bajaj group and manufactures motorcycles,
scooters and auto rickshaws. It was founded by Jamnalal Bajaj in Rajasthan in 1945
and is an Indian multinational two-wheeler and three-wheeler manufacturing company
based in Pune, Maharashtra. The company has plants in Chakan (Pune), Waluj (near
Aurangabad) and Pantnagar in Uttarakhand. The oldest plant at Akurdi (Pune) houses
the R&D centre 'Ahead'. In 2007, KTM and Bajaj Auto entered into a technological
partnership whereby Bajaj Auto acquired 14.5% stake in KTM through its subsidiary
company Bajaj Auto International Holdings BV. Since then, Bajaj’s stake has
grown over 48% as on FY20.
Rationale for investment
Established market position in the motorcycle segment
The company has an established market position and remains the second-largest player
in motorcycle segment with a domestic market share of 17% as of September 2020.
Over the past few years, the company has exhibited robust product development capabilities,
which is reflected in model launches under the KTM and Husqvarna brands in the premium
segment, Pulsar and Platina brands in the executive and economy segment. The company
has been the frontline player in the two-wheelers industry due to its innovative
products such as providing latest features like disk-brakes, anti-skid technology
and dual suspension in low price bikes segment.
Exports market will provide impetus to growth
The company is the largest exporter of 2Ws and 3Ws in India with a share of 59.6%
and 59.1%, respectively FY20. This is majorly due to early entry into markets like
Africa and South America with a competent pricing strategy. Currently, it exports
to over 79 countries in Latin America, Africa, South Asia, the Middle East, Asia
Pacific and Europe. Further the company’s aim is to grow exports supported
by i) deepening penetration in existing markets whereby ~80- 90% of its export revenue
is generated from markets where it is either market leader or close number 2 player
and has minimum 25% market share (aids in setting pricing in foreign market).
Dominance in three wheelers to continue going forward
The company is the world’s largest manufacturer and seller of three-wheelers
and remained by far the market leader, accounting for 58.1% of all three-wheeler
sales, and 61.6% of passenger vehicle sales in FY20. The company’s three wheeler
export growth in the past has been driven by entry into new markets and this will
continue going forward as well. The company’s success in its export business
has been led by top management commitment and extremely deep understanding of its
export markets.
Partnership business auguring well for the company
KTM is an Austrian motorcycle company that specializes in making 2-stroke and 4-stroke
motorcycles for street and off-road riding. Currently, KTM’s renowned motorcycles
in India are – Duke 200, Duke 250, Duke 390, RC 200 and RC 390. In FY20, KTM
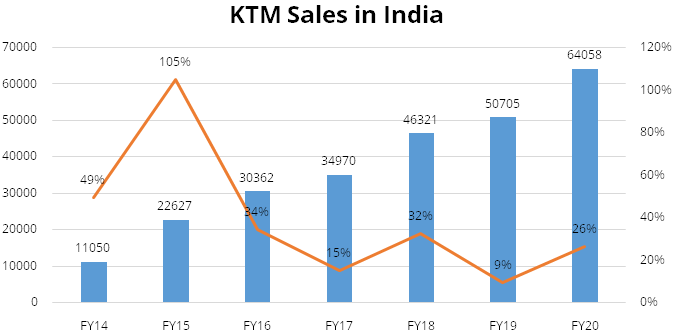
comfortably crossed the 64,000-unit mark by growing at 26% YoY majorly due to new
product launches in 125cc category and revamp in its existing models. The brand
strengthened its presence in the 125cc premium sports bikes with the launch of RC125.
The 125cc pair of bikes i.e Duke and RC have helped the company to boost brand’s
growth in smaller towns and attract young customers buying their first bike.
Outlook & Valuation
We expect the company to capture growth opportunities supported by i) strong demand for its premium portfolio like Pulsar, KTM and Husqvarna ii) demand rebound in overseas market for 3Ws iii) improved product mix with higher operating leverage iv) improved demand outlook for electric 2Ws/3Ws v) current lean inventory and new capex plans. Further we believe the key driver for the company’s growth shall be continued preference of personal mobility, differentiated products with strong brand appeal enticing all kinds of buyers and robust demand in exports market. Amongst peers, Bajaj Auto is fairly valued at PE of 16.7x FY23E EPS vis-à-vis Hero MotoCorp valuation of 17x FY23E EPS and TVS valuation of 22x FY23E EPS and thus we recommend to buy.
Consolidated Financial Statements
| Rs in Cr | Net Sales | EBITDA | EBITDAM | PAT | EPS | ROE | P/E | EV/EBITDA |
|---|---|---|---|---|---|---|---|---|
| FY18 | 25219.00 | 4836.00 | 19.00% | 4219.00 | 146.00 | 21.00% | 19.00 | 15.00 |
| FY19 | 30358.00 | 5190.00 | 17.00% | 4928.00 | 170.00 | 21.00% | 17.00 | 16.00 |
| FY20 | 29919.00 | 5096.00 | 17.00% | 5212.00 | 180.00 | 24.00% | 11.00 | 11.00 |
| FY21E | 27010.00 | 4770.00 | 18.00% | 4443.00 | 154.00 | 18.00% | 23.00 | 21.00 |
| FY22E | 31922.00 | 5664.00 | 18.00% | 5230.00 | 181.00 | 19.00% | 19.00 | 17.00 |
| FY23E | 36953.00 | 6599.00 | 18.00% | 6027.00 | 209.00 | 21.00% | 17.00 | 14.00 |
Investment Rationale
Established market position in the motorcycle segment
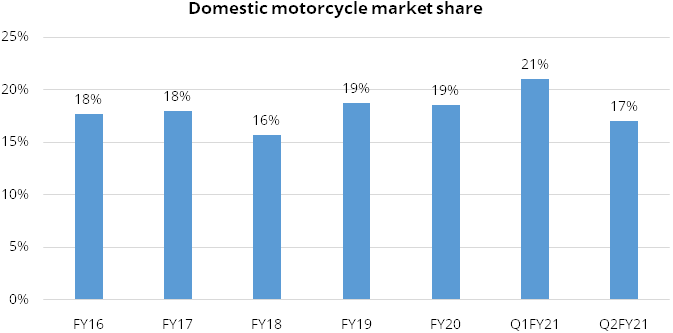
The company has an established market position and remains the second-largest player
in motorcycle segment with a domestic market share of 17% as of September 2020.
Over the past few years, the company has exhibited robust product development capabilities,
which is reflected in model launches under the KTM and Husqvarna brands in the premium
segment, Pulsar and Platina brands in the executive and economy segment. The company
has been the frontline player in the two-wheelers industry due to its innovative
products such as providing latest features like disk-brakes, anti-skid technology
and dual suspension in low price bikes segment.
Over the years, the company has brought tremendous transformation in its products and design, engineering and manufacturing process. Further the company has been open to creating more exciting and distinctive offerings to its customers. We expect the company’s performance to remain stable going forward driven by a healthy market position, strong product development capabilities, an established brand, and a diversified product portfolio. The company is also looking to gain crucial edge in the electric two-wheeler market with Bajaj Chetak.
Exhibit 1: Domestic motorcycle market share trends
Source: Company Annual Report
Exports market will provide impetus to growth
The company is the largest exporter of 2Ws and 3Ws in India with a share of 59.6%
and 59.1%, respectively FY20. This is majorly due to early entry into markets like
Africa and South America with a competent pricing strategy. Currently, it exports
to over 79 countries in Latin America, Africa, South Asia, the Middle East, Asia
Pacific and Europe. Further the company’s aim is to grow exports supported
by i) deepening penetration in existing markets whereby ~80- 90% of its export revenue
is generated from markets where it is either market leader or close number 2 player
and has minimum 25% market share (aids in setting pricing in foreign market). The
company aims to hit top 2 position and increase market share in other markets as
well over the next 2-3 years and ii) enter larger geographies like Brazil, Indonesia,
Thailand and Vietnam which has huge growth potential. Further the company is also
looking at entering parts of Europe such as Portugal, Spain etc. where it has done
the initial work on understanding the product requirements.
Exhibit 2: Export Performance
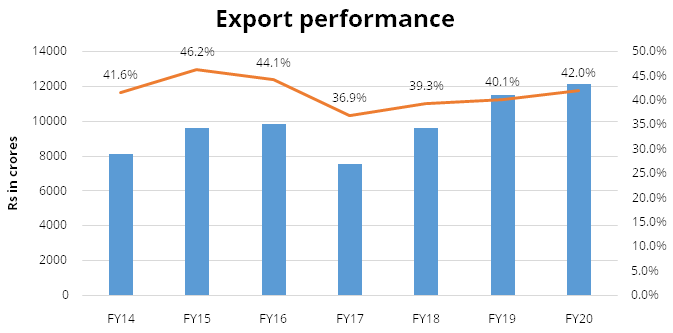
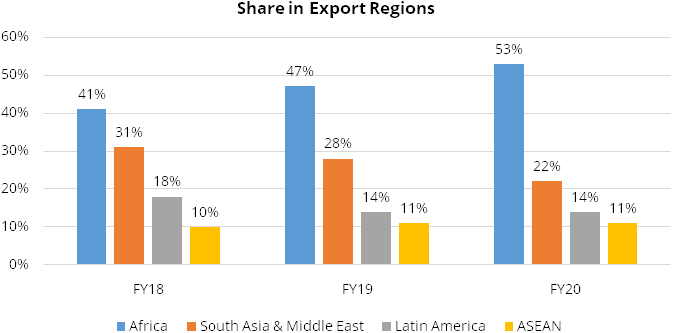
Two wheeler export sales have been good in the last couple of years on the back of very strong growth in Africa, as large economies like Nigeria and Uganda continued to grow by over 20% CAGR. The company has further improved its dominant position in Africa and launched a second brand, CT 110 in Kenya and Guinea Conakry to fulfil the need for greater mileage for some customers. It has a strong presence in the ASEAN region, driven by market share gains in the Philippines. Also, growth in South Asia and the Middle East was driven by recovery in Egypt and increasing penetration in newer markets like Iraq. The company is seeing stable volume in Latin America on the back of growth in Mexico and Central America.
Exhibit 3: Export Region-wise share
Dominance in three wheelers to continue going forward
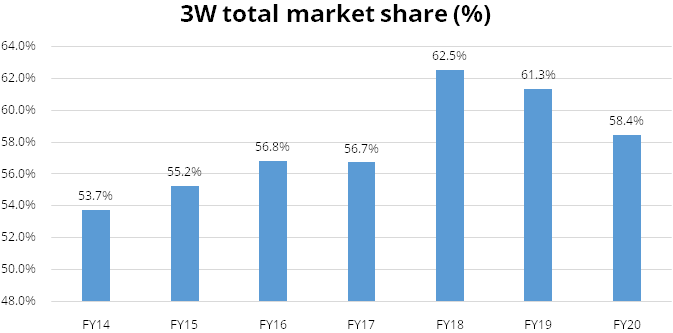
The company is the world’s largest manufacturer and seller of three-wheelers
and remained by far the market leader, accounting for 58.1% of all three-wheeler
sales, and 61.6% of passenger vehicle sales in FY20. The company’s three wheeler
export growth in the past has been driven by entry into new markets and this will
continue going forward as well. The company has identified further 15 countries
where currently they don’t sell three wheelers and expects these markets to
contribute ~10,000 monthly volumes in the next 3 years. Overall, the company is
aiming to grow 3W exports at ~10% CAGR over next few years. We believe recovery
in Sri Lanka volumes will further aid volumes as all imports had been banned in
Sri Lanka due to pandemic scenario. The company’s success in its export business
has been led by top management commitment and extremely deep understanding of its
export markets.
Exhibit 4: Dominant share in 3W market
We believe that domestic 3W recovery will depend on i) how fast consumers come back to public transport. The company is looking at utilization levels of 80-90% levels, which will likely indicate normalization of customer preference of public transport and ii) improving comfort levels of financiers to lend to three wheelers. Further the company’s strategy is to work with different financiers to offer some innovative financing solution. In FY19, the quadricycle, Qute, was successfully launched in four states: Kerala, Gujarat, Odisha and Rajasthan. Further in FY20, the company sold 942 units of Qute in domestic market. Moreover, a partnership with Uber enabled the company to sell 270 Qutes in the Bangalore market, with over 150 such vehicles now running on the Uber platform.
Partnership business auguring well for the company
KTM is an Austrian motorcycle company that specializes in making 2-stroke and 4-stroke
motorcycles for street and off-road riding. Currently, KTM’s renowned motorcycles
in India are – Duke 200, Duke 250, Duke 390, RC 200 and RC 390. In FY20, KTM
comfortably crossed the 64,000-unit mark by growing at 26% YoY majorly due to new
product launches in 125cc category and revamp in its existing models. The brand
strengthened its presence in the 125cc premium sports bikes with the launch of RC125.
The 125cc pair of bikes i.e Duke and RC have helped the company to boost brand’s
growth in smaller towns and attract young customers buying their first bike. Further
KTM revamped its existing models with the launch of the 2020 range whereby the popular
Duke 200 was revamped in a completely new form, as was the Duke390 with a Quick
shifter+. Furthermore, the company joined the big league of superbikes in India
with the launch of the KTM 790 Duke, which will cater to top-end biking enthusiasts.
Exhibit 5: KTM Sales in India
In 2017, Bajaj Auto and Triumph Motorcycles Ltd teamed up to develop and manufacture motorcycles with mid to high displacement engines (350cc-700 cc cruiser bike range). The motorbike will be designed and developed by Triumph and manufactured by Bajaj Auto at its Chakan plant. The bikes will be sold by Triumph through their dealership network while Bajaj Auto will sell it in some international markets. We expect first products from this collaboration to be launched by end of FY22. Further both the companies have done joint market research in India which has given good directions for styling and other product related aspects. There was some delay due to pandemic but now business operations are back to normal and their major focus has shifted to marketing, branding aspects. Further we believe both partners are evaluating if they can leverage Bajaj’s distribution network for Triumph in some countries.
Electric Vehicles to be new growth driver
The company launched its first electric scooter, Chetak at a price range of Rs 1.08-1.10
lakhs (on-road price). The scooter is powered by 3kWh Li-ion battery, with range
of 95kms and full charge time of 5 hours. Moreover, the Chetak offers a fully-connected
riding experience by virtue of being embedded with mobility solutions like data
communication, security and user authentication that ensure customers to have a
seamless ownership and riding experience. The Chetak mobile app gives the rider
a comprehensive overview of all aspects of his/her vehicle and its ride history.
It offers two drive modes i.e Eco and Sport — and a reverse assist mode to
ensure that all the demands of a rider are satisfied. The Chetak will also be sold
through the company’s pro-biking dealerships.
We believe the company is getting prepared for the Electric vehicle revolution in India and there is a strong possibility that at some point, battery costs will drop which shall lead to shift in EVs. As a result, its current endeavor including manufacturing of Chetak is to understand the EV space – consumer requirements, vendor networks, production issues, and ensure that when the shift happens, consumers recognize Bajaj as a credible EV player. It is also working with KTM and looking to develop high end sports electric bikes.
Rich product pipeline going forward
We expect the company’s overall domestic motorcycle product pipeline to be
robust over the next 2-3 years. The company’s strategy to gain market share
in motorcycle segment are i) Uplift customers to the executive segment (125-150cc
segment) wherein the Pulsar 125cc has achieved tremendous success and has increased
the overall share of this segment ii) Focus on innovation and styling in the sports
segment whereby the company has roped in designers from Japan and Europe and has
opened a design center in Bangkok.
Financials
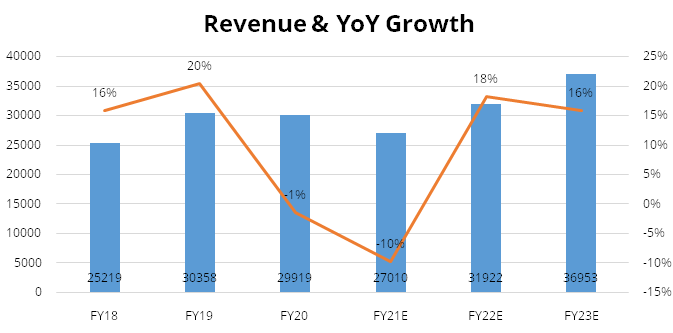
Revenue is expected to grow @~ 17% CAGR over FY21E-FY23E
We expect Bajaj Auto’s consolidated revenue to grow at ~17% CAGR over FY21E-FY23E
to Rs 36952 crores majorly supported by i) robust demand in premium portfolio with
products like Pulsar (on the back of market share gains in Pulsar 125), KTM and
Husqvarna ii) higher demand in export markets, iii) faster than expected recovery
in three wheeler market and iv) strong volume recovery.
EBITDA is expected to grow @~ 17.6% CAGR over FY21E-FY23E
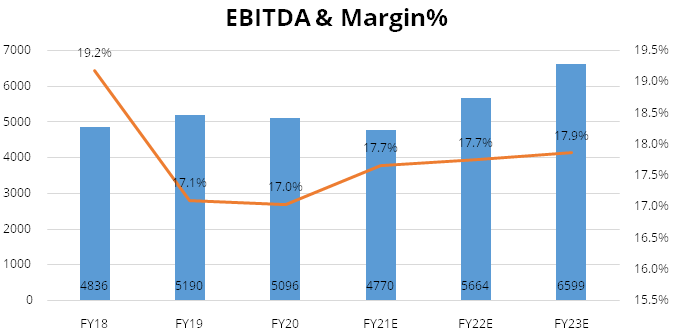
We expect Bajaj Auto’s consolidated EBITDA to grow at ~17.6% CAGR over FY21E-FY23E
to Rs 6599 crores and EBITDA margins to expand by 90 bps to 17.9% aided by better
product mix and higher operating leverage and cost rationalization. Further we expect
the adverse impact of higher input costs to be offset by improvement in segment
mix.
Net Profit is expected to grow @~ 16.4% CAGR over FY21E-FY23E
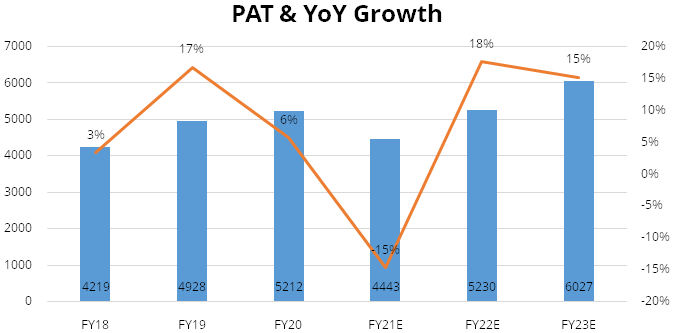
We expect Net profit to grow at ~16.4% CAGR over FY21E-FY23E to Rs 6027 crores and
PAT margins to be stable at 16.3% in FY23E. Further we expect PAT to grow supported
by gaining market share in almost every single international market and expect demand
momentum to continue.
Industry
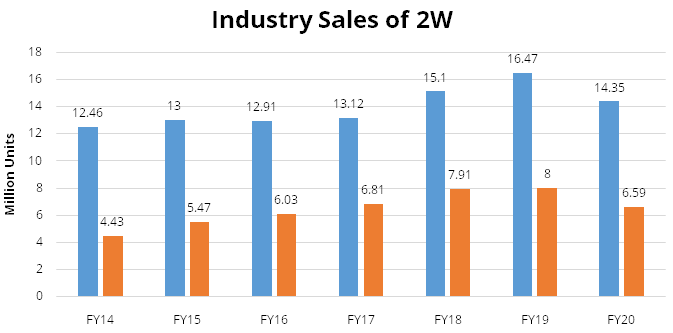
After an outstanding growth in FY19, Indian industry’s domestic sale and exports of motorcycles declined by 12.8% in FY20 to 14.35 million units. It was not just the relative lack of demand but the motorcycle industry was subjected to several regulations which significantly increased the cost of ownership. Notable among these were: (i) compulsory five-year third party insurance which was introduced in October 2018, (ii) more rigorous braking norms from April 2019, and (iii) the implementation of the more stringent emission norms under BS-VI from April 2020.
Exhibit 9: Industry Sales of Two wheelers (Domestic+ Exports)
Source: SIAM, Company Annual report
Indian motorcycle industry is dominated by the commuter segment i.e. powered by up to 125cc engine mainly due to better fuel economy. This segment was over 80% of total motorcycles in FY13. Over the years and with the launch of models with bigger engines (Bajaj Pulsar, TVS Apache, Royal Enfield Classic etc), the commuter segment shrunk to 65% in FY17. The segment has now gained back owing to slowdown caused by pandemic in the last few months. 2Ws had a steep price increase of almost 15% post insurance cost increase in September 2018 and implementation of new safety norms in April 2019. In a short span we have seen the steepest price increase ever. This, we believe, has led to down-trading to sub-125cc segment, which has also forced OEMs like Bajaj Auto to launch a 125cc version of Pulsar.
Motorcycles are rural centric products as it’s the only mode of commute due to lack of public transport system. Also, 1/3rd of the rural households own a 2W vs 1/7th of urban households and hence there is a correlation between farm income and Motorcycle sales growth. We expect farm income to grow in a stable manner going forward and this growth should reflect in rural spending in FY22 and hence could support motorcycle sales. We believe as the BS-VI price increase have settled down, rural demand shall pick up motorcycle sales in FY22.
Peer comparison
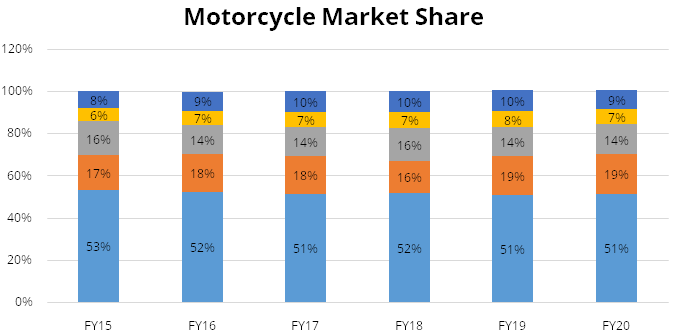
Hero MotoCorp has a dominant share in the motorcycle segment with its commuter segment
models like Splendor and Passion whereas Honda dominates the scooter segment with
the Activa. Hero MotoCorp’s market share has been 50% plus for the last five
years and for FY20, its market share is 51.3%. Hero MotoCorp is followed by Bajaj
Auto with a market share of 18.7% in FY20. Bajaj Auto is second largest player and
its market share has been hovering in the range of 16%-19% in last five years. In
last five years, the emerging players in the motorcycle market are TVS motors (market
share hovering in the range of 6%-8%) and Royal Enfield (market share hovering in
the range of 2%-4%). Hero MotoCorp dominates the sub-125cc segment with a market
share of 65% as of FY20 whereas Bajaj Auto dominates the 125-250cc segment with
the help of its Pulsar range. Royal Enfield dominates the 250cc plus segment with
the help of its Classic 350 model.
Exhibit 10: Industry Motorcycle Market share
Source: SIAM
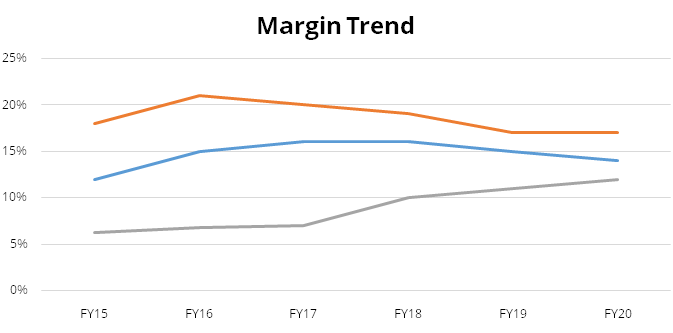
Hero MotoCorp leads in network and reach and its main focus area is mass motorcycle segment. However, in recent past they have shown more inclination to penetrate sports and premium categories. TVS Scooters major focus area has been scooter segment, moped and sports motorcycle. Bajaj Auto has its focus area sports motorcycle, 3W and entry level motorcycle segment. Bajaj Auto has the leanest cost structure resulting into highest margins amongst its peers.
Risks & Concerns
- Rise in raw material prices may adversely impact margins.
- Any stress in the company’s export geographies could lead to lower volumes.
- Three-wheelers business faces a risk from electrification if the company cannot adapt to the technology.
- Foreign exchange risk, as around 42% of revenue comes from exports.
Outlook & valuation
We expect the company to capture growth opportunities supported by i) strong demand for its premium portfolio like Pulsar, KTM and Husqvarna ii) demand rebound in overseas market for 3Ws iii) improved product mix with higher operating leverage iv) improved demand outlook for electric 2Ws/3Ws v) current lean inventory and new capex plans. Further we believe the key driver for the company’s growth shall be continued preference of personal mobility, differentiated products with strong brand appeal enticing all kinds of buyers and robust demand in exports market. Amongst peers, Bajaj Auto is fairly valued at PE of 16.7x FY23E EPS vis-à-vis Hero MotoCorp valuation of 17x FY23E EPS and TVS valuation of 22x FY23E EPS and thus we recommend to buy.
Financial Statement
Profit & Loss statement
| Yr End March (Rs Cr) | 2018 | 2019 | 2020 | 2021E | 2022E | 2023E |
|---|---|---|---|---|---|---|
| Net Sales | 25218.93 | 30357.63 | 29918.65 | 27010.14 | 31922.00 | 36952.71 |
| Growth % | 16.00% | 20.00% | -1.00% | -10.00% | 18.00% | 16.00% |
| Expenditure | ||||||
| Material Cost | 17679.00 | 22146.00 | 21384.00 | 19177.00 | 22569.00 | 26089.00 |
| Employee Cost | 1069.00 | 1257.00 | 1391.00 | 1290.00 | 1389.00 | 1583.00 |
| Other Expenses | 1635.00 | 1766.00 | 2049.00 | 1773.00 | 2300.00 | 2682.00 |
| EBITDA | 4836.00 | 5190.00 | 5096.00 | 4770.00 | 5664.00 | 6599.00 |
| Growth % | 9.00% | 7.00% | -2.00% | -6.00% | 19.00% | 17.00% |
| EBITDA Margin | 19.00% | 17.00% | 17.00% | 18.00% | 18.00% | 18.00% |
| Depreciation & Amortization | 315.00 | 266.00 | 246.00 | 258.00 | 273.00 | 302.00 |
| EBIT | 4521.00 | 4924.00 | 4849.00 | 4512.00 | 5391.00 | 6297.00 |
| EBIT Margin % | 18.00% | 16.00% | 16.00% | 17.00% | 17.00% | 17.00% |
| Other Income | 1158.00 | 1344.00 | 1525.00 | 1432.00 | 1603.00 | 1761.00 |
| Interest & Finance Charges | 1.00 | 4.00 | 3.00 | 6.00 | 5.00 | 4.00 |
| Profit Before Tax - Before Exceptional | 5678.00 | 6264.00 | 6371.00 | 5938.00 | 6989.00 | 8054.00 |
| Profit Before Tax | 5646.00 | 6606.00 | 6371.00 | 5938.00 | 6989.00 | 8054.00 |
| Tax Expense | 1714.00 | 2028.00 | 1480.00 | 1495.00 | 1759.00 | 2027.00 |
| Effective Tax rate | 30.00% | 32.00% | 23.00% | 25.00% | 25.00% | 25.00% |
| Exceptional Items | -32.00 | 342.00 | 0.00 | 0.00 | 0.00 | 0.00 |
| Net Profit | 3931.00 | 4578.00 | 4890.00 | 4443.00 | 5230.00 | 6027.00 |
| Growth % | 3.00% | 16.00% | 7.00% | -9.00% | 18.00% | 15.00% |
| Net Profit Margin | 16.00% | 15.00% | 16.00% | 16.00% | 16.00% | 16.00% |
Balance Sheet
| Yr End March (Rs Cr) | 2018 | 2019 | 2020 | 2021E | 2022E | 2023E |
|---|---|---|---|---|---|---|
| Share Capital | 289.00 | 289.00 | 289.00 | 289.00 | 289.00 | 289.00 |
| Total Reserves | 20136.00 | 22944.00 | 21373.00 | 23941.00 | 26965.00 | 30449.00 |
| Shareholders' Funds | 20425.00 | 23234.00 | 21662.00 | 24231.00 | 27254.00 | 30738.00 |
| Non Current Liabilities | ||||||
| Long Term Burrowing | 121.00 | 125.00 | 126.00 | 126.00 | 126.00 | 126.00 |
| Deferred Tax Assets / Liabilities | 323.00 | 543.00 | 346.00 | 346.00 | 346.00 | 346.00 |
| Long Term Provisions | 112.00 | 15.00 | 81.00 | 81.00 | 81.00 | 81.00 |
| Current Liabilities | ||||||
| Trade Payables | 3244.00 | 3787.00 | 3200.00 | 3431.00 | 3471.00 | 3963.00 |
| Other Current Liabilities | 726.00 | 931.00 | 880.00 | 880.00 | 880.00 | 880.00 |
| Short Term Provisions | 141.00 | 156.00 | 174.00 | 174.00 | 174.00 | 174.00 |
| Total Equity & Liabilities | 25141.00 | 28834.00 | 26510.00 | 29310.00 | 32373.00 | 36349.00 |
| Assets | ||||||
| Net Block | 1821.00 | 1708.00 | 1645.00 | 1787.00 | 2064.00 | 2382.00 |
| Non Current Investments | 13186.00 | 19082.00 | 17188.00 | 17188.00 | 17188.00 | 17188.00 |
| Long Term Loans & Advances | 589.00 | 748.00 | 958.00 | 958.00 | 958.00 | 958.00 |
| Current Assets | ||||||
| Currents Investments | 5765.00 | 1576.00 | 2780.00 | 2780.00 | 2780.00 | 2780.00 |
| Inventories | 743.00 | 962.00 | 1064.00 | 858.00 | 969.00 | 1132.00 |
| Sundry Debtors | 1492.00 | 2560.00 | 1725.00 | 2106.00 | 2018.00 | 2264.00 |
| Cash and Bank | 793.00 | 933.00 | 316.00 | 2769.00 | 5531.00 | 8779.00 |
| Short Term Loans and Advances | 62.00 | 130.00 | 177.00 | 177.00 | 177.00 | 177.00 |
| Total Assets | 25141.00 | 28834.00 | 26510.00 | 29310.00 | 32373.00 | 36349.00 |
Cash Flow Statement
| Yr End March (Rs Cr) | 2018 | 2019 | 2020 | 2021E | 2022E | 2023E |
|---|---|---|---|---|---|---|
| Profit After Tax | 3931.00 | 4578.00 | 4890.00 | 4443.00 | 5230.00 | 6027.00 |
| Depreciation | 315.00 | 266.00 | 246.00 | 258.00 | 273.00 | 302.00 |
| Others | 635.00 | -54.00 | 220.00 | 0.00 | 0.00 | 0.00 |
| Changes in Working Capital | 1091.00 | -798.00 | 366.00 | 57.00 | 16.00 | 82.00 |
| Cash From Operating Activities | 4328.00 | 2487.00 | 3850.00 | 4758.00 | 5519.00 | 6411.00 |
| Purchase of Fixed Assets | -183.00 | -164.00 | -283.00 | -400.00 | -550.00 | -620.00 |
| Free Cash Flows | 4145.00 | 2323.00 | 3568.00 | 4358.00 | 4969.00 | 5791.00 |
| Others | -1883.00 | -251.00 | 1822.00 | 0.00 | 0.00 | 0.00 |
| Cash Flow from Investing Activities | -2053.00 | -338.00 | 1556.00 | -400.00 | -550.00 | -620.00 |
| Increase / (Decrease) in Loan Funds | 0.00 | 3.00 | 0.00 | 0.00 | 0.00 | 0.00 |
| Equity Dividend Paid | -1588.00 | -1736.00 | -5195.00 | -1555.00 | -1830.00 | -2109.00 |
| Others | 0.00 | -4.00 | -2.00 | 0.00 | 0.00 | 0.00 |
| Cash from Financing Activities | -1885.00 | -2074.00 | -6247.00 | -1875.00 | -2207.00 | -2543.00 |
| Net Cash Inflow / Outflow | 389.00 | 74.00 | -840.00 | 2483.00 | 2763.00 | 3248.00 |
| Opening Cash & Cash Equivalents | 288.00 | 776.00 | 916.00 | 285.00 | 2769.00 | 5531.00 |
| Closing Cash & Cash Equivalent | 776.00 | 916.00 | 285.00 | 2769.00 | 5531.00 | 8779.00 |
Key Ratios
| Yr End March | 2018 | 2019 | 2020 | 2021E | 2022E | 2023E |
|---|---|---|---|---|---|---|
| Basic EPS | 146.00 | 170.00 | 180.00 | 154.00 | 181.00 | 209.00 |
| Diluted EPS | 146.00 | 170.00 | 180.00 | 154.00 | 181.00 | 209.00 |
| Cash EPS (Rs) | 157.00 | 179.00 | 189.00 | 163.00 | 190.00 | 219.00 |
| DPS | 60.00 | 60.00 | 120.00 | 54.00 | 63.00 | 73.00 |
| Book value (Rs/share) | 706.00 | 803.00 | 749.00 | 838.00 | 943.00 | 1064.00 |
| ROCE (%) Post Tax | 21.00% | 19.00% | 22.00% | 19.00% | 20.00% | 21.00% |
| ROE (%) | 21.00% | 21.00% | 24.00% | 18.00% | 19.00% | 21.00% |
| Inventory Days | 11.00 | 10.00 | 12.00 | 13.00 | 10.00 | 10.00 |
| Receivable Days | 18.00 | 24.00 | 26.00 | 26.00 | 24.00 | 21.00 |
| Payable Days | 40.00 | 42.00 | 43.00 | 45.00 | 39.00 | 37.00 |
| PE | 18.90 | 17.10 | 11.20 | 22.70 | 19.30 | 16.70 |
| P/BV | 4.00 | 4.00 | 3.00 | 4.00 | 4.00 | 3.00 |
| EV/EBITDA | 15.00 | 16.00 | 11.00 | 21.00 | 17.00 | 14.00 |
| Dividend Yield (%) | 2.00% | 2.00% | 6.00% | 2.00% | 2.00% | 2.00% |
| P/Sales | 3.00 | 3.00 | 2.00 | 4.00 | 3.00 | 3.00 |
| Net debt/Equity | 0.00 | 0.00 | 0.00 | 0.00 | 0.00 | 0.00 |
| Net Debt/ EBITDA | -1.00 | 0.00 | -1.00 | -1.00 | -1.00 | -2.00 |
| Sales/Net FA (x) | 13.00 | 17.00 | 18.00 | 16.00 | 17.00 | 17.00 |